
Publication


May 23rd Virtual Tour of State Health Compare: A New Online Tool to Study State Health Estimates
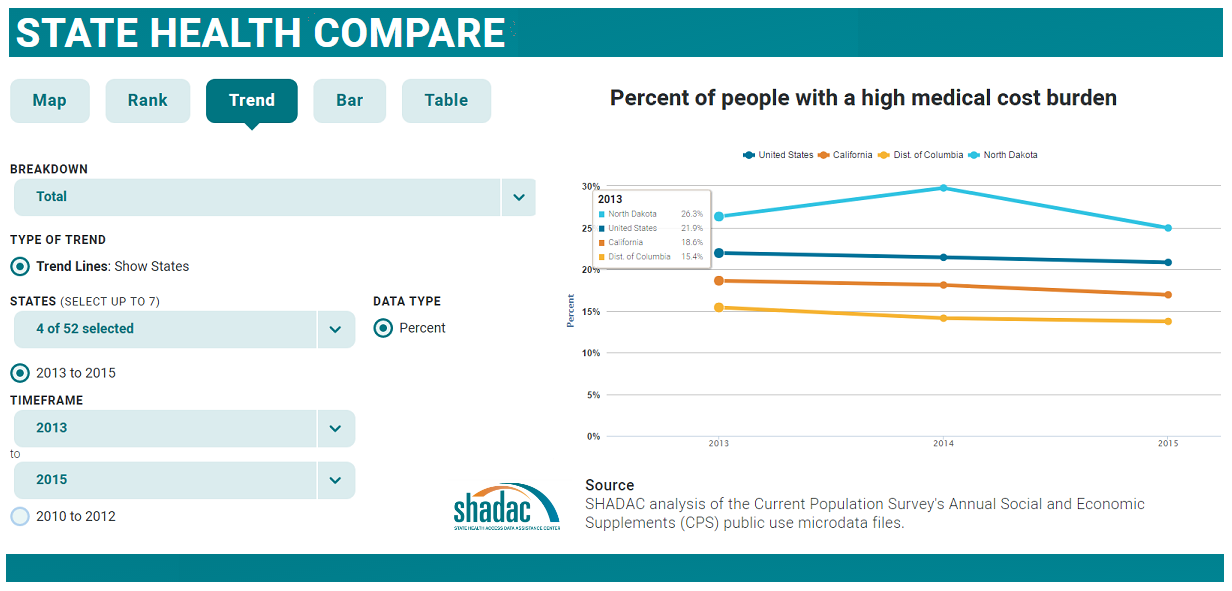
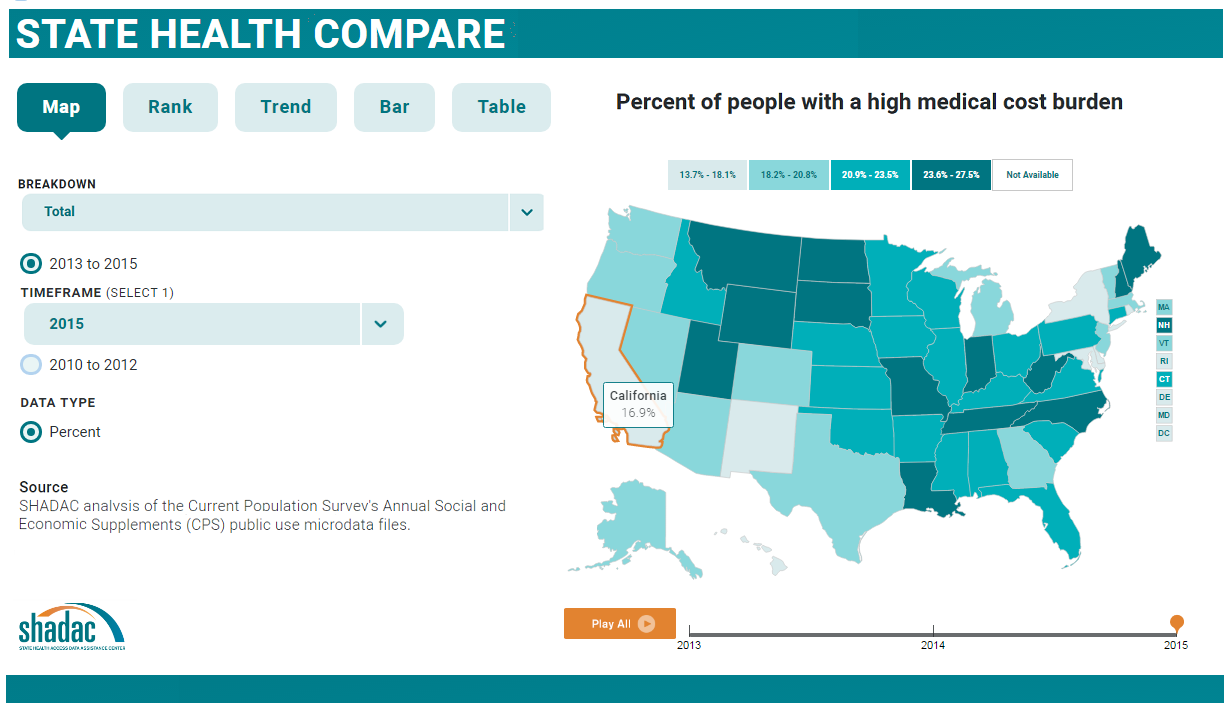
Join us for a virtual tour of State Health Compare, a new, user-friendly online tool for obtaining and comparing state-level estimates related to health and health care.
State Health Compare: How's It Different?
State Health Compare combines estimates previously available separately through the SHADAC Data Center and the Robert Wood Johnson Foundation (RWJF) Data Hub. The new, merged tool brings together estimates on a wide range of health-related topics in an effort to allow analysts and policymakers to view state-level data through a broad Culture of Health lens.
 The Virtual Tour: What Will You Learn?
Ms. Turner will be joined on the webinar by Carolyn Miller, Senior Program Officer at RWJF, and by SHADAC Director Lynn Blewett. SHADAC Senior Research Fellow Brett Fried will also be available to answer questions.

Publication
Ohio: Affordable Care Act (ACA) Impacts on Insurance Coverage by Congressional District
Click on an Ohio Congressional District to see changes in the uninsured between 2013 and 2015. These data show the impact of the ACA, which was implemented in 2014, on the uninsured.
|
2013-2015 Change in Uninsured
|
|---|
Estimates are provided for several demographic breakdowns, including race; ethnicity; nativity and U.S. citizenship; educational attainment; employment status; and ratio of income to Federal Poverty Level (FPL; see note below for further information about the income categories used in this analysis).
Click here to download the data file for all Ohio Congressional Districts.
Estimates Available for All Districts, All States
Click here to access estimates for Congressional Districts in a different state.
About the American Community Survey
The estimates in this analysis come from the American Community Survey (ACS) via the U.S. Census Bureau's American FactFinder (AFF) tool.
The ACS is a household survey that began in 2005 and produces annually updated data on a variety of population characteristics, including health insurance coverage. In total, the ACS surveys approximately three million US households each year.
An important feature of the ACS is that it includes a large enough sample for state‐level and sub‐state estimates such as the estimates in this analysis.
Note: Federal Poverty Levels
For this analysis, estimates are provided for houshold incomes that are: below 138% of the Federal Poverty Level (FPL); from 138% FPL to 199% FPL; from 200% FPL to 399% FPL; and at or above 400% FPL. These income levels correspond with ACA income eligibility levels. In Medicaid expansion states, individuals with incomes at or below 138% FPG are eligible for Medicaid. Additionally, people with incomes at or below 400% FPL are eligible for premium subsidies to buy private coverage through Marketplaces.* The following table provides 2015 FPL dollar amounts for key income thresholds used in this analysis.
| Ratio of Income to 2015 Federal Poverty Level (FPL) | |||
|---|---|---|---|
| 138% FPL | 200% FPL | 399% FPL | |
| Single Person | $16,673 | $24,164 | $48,207 |
| Family of Four | $33,475 | $48,514 | $96,785 |
| Source: US. Census Bureau. 2015 Federal Poverty Levels. | |||
*The income cuts used in this analysis are slightly different than ACA eligibility levels because of how data are tabulated in American FactFinder, but the differences are negligible. Although Medicaid eligibility for the expansion population covers people with incomes at or below138% FPL, this analysis groups incomes below 138% FPL. The scenario is similar for premium subsidy eligibility. This analysis groups incomes below 400% FPL, but people with incomes up to and including 400% FPL are eligible for premium subsidies
About this Resource
This analysis was supported by a grant from the California HealthCare Foundation.
Blog & News

Video: Sarah Gollust Finds Little Public Health Substance in Early TV News Coverage of the ACA
February 17, 2017:In a new video from Health News Review, Dr. Sarah Gollust (University of Minnesota) discusses an analysis just released in the American Journal of Public Health (AJPH).
The analysis examines the content of local TV news coverage of the Affordable Care Act (ACA) during the first ACA open enrollment period (October 1, 2013 through April 19, 2014), when 10 million Americans gained insurance. This new analysis is relevant to the work of policymakers, health policy scholars, and enrollment advocates as they seek to understand the information environment to which Americans were exposed at this historic time of widespread coverage gains. The authors found that common source of news for Americans provided little public health–relevant substance about the ACA during its early implementation, favoring a political approach to news coverage of the law.
Watch the video below or read the accompanying Health News Review article here.
Access the AJPH article, "Local Television News Coverage of the Affordable Care Act: Emphasizing Politics Over Consumer Information."
The research highlighted here was supported by a grant from the Robert Wood Johnson Foundation's SHARE program, which is managed by SHADAC. Learn more about Dr. Gollust's SHARE-funded research.
Blog & News
Gollust: Local TV News Coverage of the ACA during the First Open Enrollment Provided Little Public Health Substance
February 17, 2017:In 2014, new Medicaid and Marketplace enrollees identified news as the top source of information about health insurance options, with local television news cited more than any other news media type as their most influential information source. Despite the key role of television news media in providing information about the ACA during the time when Americans were first learning about the details of the new insurance options available to them, no one has analyzed the public health-relevant content of this coverage during the ACA's first open enrollment period.
 In an article released today in the American Journal of Public Health, Dr. Sarah Gollust (University of Minnesota) and her co-authors examine the content of local TV news coverage of the Affordable Care Act (ACA) during the first ACA open enrollment period (October 1, 2013 through April 19, 2014), when 10 million Americans gained insurance. This new analysis is relevant to the work of policymakers, health policy scholars, and enrollment advocates as they seek to understand the information environment to which Americans were exposed at this historic time of widespread coverage gains.
Research Approach
The researchers identified a sample of1569 ACA-related television news stories broadcast during the first open enrollment period. The sample was generated using keyword searches of closed captions from local evening news broadcasts in 208 U.S. media markets. Data were collected and the content of news broadcasts coded at Wesleyan University through a partnership between the University of Minnesota and the Wesleyan Media Project, which study author Dr. Erika Franklin Fowler directs.
Results: Types of Television News Coverage
- 26.5% of the stories in the study sample focused solely on the politics of the ACA, not mentioning any information about health insurance products.
- 44.9% focused entirely on the health insurance options available through the ACA.
- 28.6% presented a mix of coverage, looking at both politics and available health insurance options.
Results: Policy-Relevant Variables
- Just 7.4% of the sample news stories mentioned Medicaid, and only 5.0% had a Medicaid focus. Stories in the politics-focused subsample were more likely to have a Medicaid focus than were stories in the insurance product-focused subsample (10.1% vs. 3.1%).
- Among the news sample that addressed health insurance products (in whole or part), about a third included some factual policy details about enrollment (e.g., mention of fines, subsidies, or how to get help enrolling) in 2013, and about 4 in 10 did so in 2014. Just 13.9% of the product-related sample provided viewers with information on where to go or a number to call to get help, and less than seven (6.9) percent of stories mentioned the availability of subsidies to make health insurance more affordable.
- Health insurance product-related news stories presented information on the number of enrollees to date about one fourth of the time, with 14.2 percent describing federal or state enrollment goals. Mentions of research or evaluation evidence about the ACA were only found in 1.8% of stories.
- A common message in product-related ACA news stories had to do with website glitches: 33.3% mentioned some type of website glitch, whether at healthcare.gov or state-based marketplace sites.
- Among sources cited in local TV news stories about the ACA, the most common were President Obama (38.9% of stories), and a White House or other federal executive agency figure (28.7%). Republican (22.3%) or Democratic (15.9%) politicians or officials were also common sources.
Discussion
The authors emphasize that only half of all news coverage about the ACA focused on the health insurance products available through the law and note that key policy aspects of the ACA content were surprisingly uncommon even among these stories, with Medicaid mentioned in only seven percent of them and the availability of subsidies mentioned in only eight percent. The authors point to a dominant journalistic style that focuses on political strategy and on who is winning or losing in a given scenario. Political strategy framing was evidenced by attention to enrollment expectations and achievements and to web site problems—i.e., “wins” and “losses” for ACA proponents—over policy substance. Reliance on partisan sources further supports a focus on strategic over substantive reporting. Few news stories, the authors point out, included any public health, medical, research, or health advocacy perspectives. They argue that the framing of the law by the local media using a political strategy frame limited citizens’ exposure to the substance of ACA policy content, instead heightening the likelihood of the public perceiving the law through a politically charged lens.
Access the article, "Local Television News Coverage of the Affordable Care Act: Emphasizing Politics Over Consumer Information."
The research highlighted here was supported by a grant from the Robert Wood Johnson Foundation's SHARE program, which is managed by SHADAC. Learn more about Dr. Gollust's SHARE-funded research.
Blog & News
NHIS: Coverage and Uninsurance Rates Mostly Stable in January-September 2016
May 17, 2017:The National Center for Health Statistics (NCHS) released health insurance coverage estimates for January through September 20161 from the National Health Interview Survey (NHIS) as part of the NHIS Early Release Program.
In the Nation
With only a few exceptions coverage and uninsurance rates remained stable between the first three quarters of 2015 and the first three quarters of 2016.
Coverage by Type
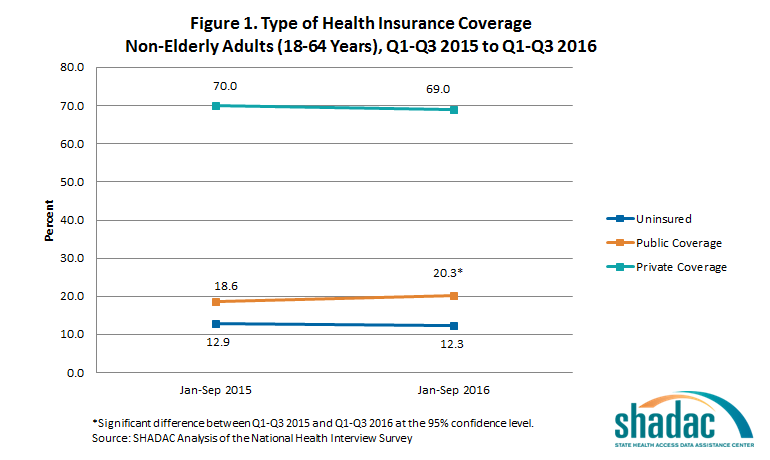
Adults (18-64 years)
The new estimates show that among adults aged 18 to 64, only the rate of public coverage changed significantly, increasing 1.7 percentage points. Uninsurance and private coverage were statistically stable. Among this group, in the first three quarters of 2016:
- 12.3% were uninsured at the time of interview
- 20.3% had public coverage (vs. 18.6% in January-September 2015)
- 69.0% had private coverage
Children (0-17 years)
The rates of coverage for children (0-17 years) by type of coverage were statistically unchanged from the first three quarters of 2015. Among this group in January through September of 2016:
- 5.0% were uninsured at the time of interview
- 43.4% had public coverage
- 53.5% had private coverage
The Uninsured
Adults (18-64 years)
Not only did uninsurance hold steady from the first three quarters of 2015 and the first three quarters of 2016 among non-elderly adults taken as a whole, but the distribution of uninsurance among subgroups remained stable:
- Adults aged 25 to 34 years continued to be the most likely to be uninsured, with nearly twice the uninsured rate of 45-64 year olds (16.4% vs. 8.6%).
- Adults aged 18 to 24 and adults aged 35 to 44 once again had similar rates of uninsurance, at 13.6 and 14.7, respectively.
Children (0-17 years)
Uninsurace among children was stable overall between January through September 2015 and January through September 2016; however, a breakdown by poverty status and coverage type shows that the percentage of poor children (<100% FPL) with private health insurance coverage decreased significantly, from 9.6 to 7.1 percent.
Race/Ethnicity
The only racial/ethnic group that saw a statistically significant change from January through September 2015 to January through September 2016 was Hispanics/Latinos, among whom uninsurance dropped 2.1 percentage points (from 21% to 18.9%).
Enrollment in High-Deductible Health Plans
Among persons under the age 65 with private health insurance, the percentage who were enrolled in a high deductible health plan (HDHP) increased in 2016. Among this age group:
- 39.1 percent were enrolled in an HDHP (vs. 36.2% in January-September 2015)
- 15.2 percent were enrolled in HDHPs that incorporated health savings accounts (vs. 13.2% in January-September 2015)
In the States
NHIS estimates of the uninsured are available for 38 individual states with sufficient sample size for the first three quarters of the 2016 calendar year. Among states with estimates available for the first three quarters of both 2015 and 2016, the only one that saw a significant change in uninsurance was California, with a decrease of 4.5 percentage points.
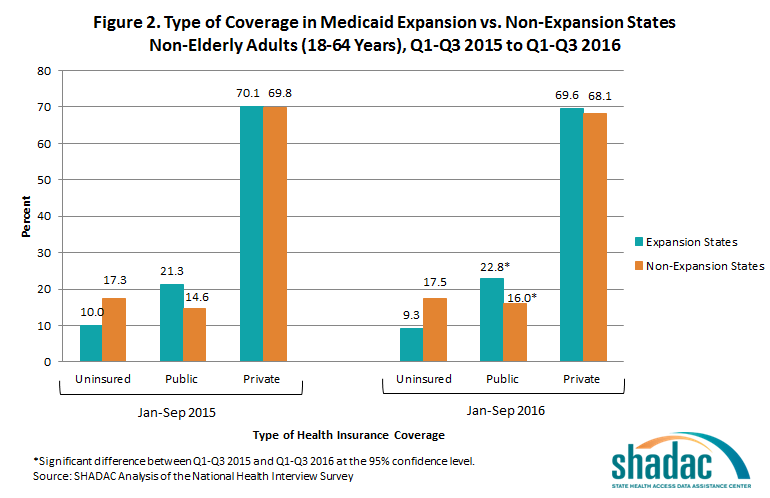
State Medicaid Expansion Status
In both Medicaid expansion states and non-expansion states, rates of public coverage increased significantly among non-elderly adults (18 to 64) from the first three quarters of 2015 to the first three quarters 2016. Uninsurance rates and rates of private coverage held stable in both expansion and non-expansion states.
Among adults ages 18 to 64 living in expansion states:
- 9.3 percent were uninsured at the time of interview
- 69.6 percent had private coverage
- 22.8 percent had public coverage (up from 21.3 % in the first three quarters of 2015)
Among adults ages 18 to 64 living in states that did not expand Medicaid:
- 17.5 percent were uninsured at the time of interview
- 68.1 percent had private coverage
- 16.0 percent had public coverage (up from 14.6% in January through September 2015)
Non-elderly adults in expansion states continued to be less likely to be uninsured than non-elderly adults in non-expansion states in the first three quarters of 2016, with uninsurance in expansion states at 9.3% and uninsurance in non-expansion states at 17.5%.
View the NCHS Early Release Report, "Health Insurance Coverage: Early Release of Esimates from the National Health Interview Survey, January-September 2016."
About the NHIS Early Release Program
The new NHIS estimates were published as part of the NHIS Early Release Program, through which analytic reports and preliminary microdata files are made available on an expedited schedule so that data users have access to the most recent NHIS information without having to wait for the final annual NHIS microdata files to be released after the end of each data collection year. The early release reports and files are produced prior to final data editing and weighting.
1SHADAC's analysis differes slightly from the NCHS report because SHADAC'compares estimates from the first three quarters of 2015 with estimates from the first three quarters of 2016, while the NCHS compares the estimates for all of 2015 with estimates from the first three quarters of 2016.

