
Blog & News


Assessing Physician Acceptance of Medicaid Patients Using State Health Compare
August 25, 2022:In order for the more than 80 million Medicaid beneficiaries to access needed care in a timely manner, there must be a sufficient number of health care providers to serve these patients. There has long been concern that providers are less likely to accept Medicaid patients than patients with other types of health insurance coverage, making it difficult for individuals with Medicaid coverage to get health care when they need it. In the U.S., nearly all physicians accept new patients with private insurance, but only about three quarters accept new patients with Medicaid coverage. Though this trend is clear nationally, there is a large degree of variation across the states in how likely physicians are to accept new patients with Medicaid coverage compared to other forms of insurance.
|
|
Physicians are more likely to take patients with private insurance over Medicaid in most states |
Nationally, in 2014–2017, while more than 95 percent of physicians said they accepted new patients with private insurance, only 74 percent accepted new patients with Medicaid coverage (among physicians accepting new patients), a greater than 20 percentage-point gap.
This gap was much larger in some states than others. For example, in New Jersey, Florida, Louisiana, and California, physicians were more than 30 percentage-points less likely to accept new patients with Medicaid coverage than those with private insurance. And in New Jersey, less than half of physicians said they accepted new patients with Medicaid (42.2%). However, in twelve states, physicians were no more than five percentage points less likely to accept Medicaid patients than private patients, and in Wisconsin, Minnesota, and North Dakota, there was essentially no difference between physicians’ acceptance of Medicaid versus private insurance.
Though the Affordable Care Act (ACA) led to important policy changes that could have prompted shifts in the share of physicians who accept Medicaid patients, rates of acceptance of Medicaid patients have been stable over time nationally and in most states, both before most ACA coverage policies were implemented (2011–2013) and after these policies were in force (2014–2017).
Nationally, the percentage of physicians accepting new Medicaid patients was statistically unchanged between 2011–2013 and 2014–2017, remaining between 73 and 74 percent. Six states—Idaho, Massachusetts, Missouri, Ohio, Vermont, and West Virginia—saw significant increases in the percent of physicians accepting Medicaid patients. Of these states, Missouri saw the largest increase, with 78 percent of physicians accepting Medicaid-covered patients in 2014–2017 compared to less than 69 percent in 2011–2013, a greater than nine percentage-point increase.
Six states saw increases in the share of physicians accepting new Medicaid patients
Visit SHADAC’s State Health Compare to dive deeper into state-level trends for these two measures:
- Physician acceptance of new patients by coverage type
- Factors associated with physician acceptance of Medicaid patients
Related Resource
SHADAC brief summarizing Dr. Hannah Neprash’s study examining the effects of Medicaid expansion on physician participation
Notes
Estimates in this post are representative of non-federally employed office-based physicians who are primarily engaged in direct patient care and reported accepting new patients. Data years 2011–2013 and 2014–2017 were merged to improve sample sizes and facilitate the production of state-level estimates. Estimates represent a weighted average of the years in these periods.
Differences between physician acceptance of Medicaid versus private insurance were not evaluated for statistical significance. All described differences in physician acceptance of Medicaid coverage over time were statistically significant at the 95% confidence level.
All data in this post come from SHADAC analysis of the 2011–2017 National Electronic Health Records Survey (NEHRS) data, produced by the National Center for Health Statistics (NCHS). The analysis was performed by SHADAC under contract with the Medicaid and CHIP Payment and Access Commission (MACPAC). The findings, statements, and views expressed here are those of SHADAC and do not necessarily reflect those of MACPAC. Data were analyzed at the University of Minnesota's Census Research Data Center. Data for 2016 are not available.
Blog & News

SHADAC Advocates a Data-based Approach to Advancing Medicaid and CHIP Access Monitoring Plan (Response to CMS Request for Information)
April 29, 2021:On February 17, 2022, the Centers for Medicare & Medicaid Services (CMS) released a request for information (RFI) regarding access to coverage and care in Medicaid and the Children’s Health Insurance Program (CHIP).
SHADAC researchers focused our response on Objective 4: Question 1, which asked researchers to consider how CMS might develop a stronger Medicaid and CHIP access monitoring approach through data reporting and analysis, and is copied for reference below.
Portions of SHADAC’s response were also included as part of a larger commentary on each of the RFI’s five total objectives submitted to CMS by President and CEO Richard Besser, MD, of the Robert Wood Johnson Foundation (RWJF) on April 18, 2022.
|
Centers for Medicare & Medicaid Services (CMS) – Request for Information (2022) Objective 4: CMS has data available to measure, monitor, and support improvement efforts related to access to services (i.e., potential access; realized access; and beneficiary experience with care across states, delivery systems, and populations). CMS is interested in feedback about what new data sources, existing data sources (including Transformed Medicaid Statistical Information System [T-MSIS], Medicaid and CHIP Core Sets, and home and community based services (HCBS) measure set), and additional analyses could be used to meaningfully monitor and encourage equitable access within Medicaid and CHIP programs. 1. What should CMS consider when developing an access monitoring approach that is as similar as possible across Medicaid and CHIP delivery systems (e.g., fee-for-service and managed care programs) and programs (e.g., HCBS programs and dual eligibility in Medicaid and Medicare) and across services/benefits? Would including additional levels of data reporting and analyses (e.g., by delivery system or by managed care plan, etc.) make access monitoring more effective? What type of information from CMS would be useful in helping states identify and prioritize resources to address access issues for their beneficiaries? What are the most significant gaps where CMS can provide technical or other types of assistance to support states in standardized monitoring and reporting across delivery systems in areas related to access? |
Response from SHADAC
Thank you for the opportunity to help inform the development of an improved Medicaid and CHIP access monitoring plan. These comments are based on SHADAC’s experience providing data and evaluation technical assistance (TA) to states, which has given us a unique view into the day-to-day challenges and barriers that states encounter related to these issues. These comments mirror recent testimony to the Medicaid and CHIP Payment Access Commission (MACPAC) provided by SHADAC’s Deputy Director.
We present five points for your consideration, each of which are guided by the same principle, which is: That any monitoring plan should seek to minimize burden on state agencies.
First, consider an iterative approach that starts with a limited number of measures and expands over time. This will require difficult tradeoffs regarding priorities, but these tradeoffs will be worth it if the first iteration is achievable for a wide range of states. As the plan develops and more complicated measurement concepts are added, it should engage leading states by including them in additional measure selection and incentivizing them to participate in pilots that test the collection and analysis of data – sharing concrete implementation lessons with other states.
Second, support states in efforts to improve existing data with a focus on the ability to disaggregate. There are existing data streams to draw on (as documented by Urban Institute in 2017 and discussed at a recent MACPAC meeting), and while none are perfect, a successful plan should first focus on improving those. One tangible way to improve states’ existing data is to support data disaggregation efforts. There is a renewed focus and energy to promote equity within Medicaid and calls from stakeholders to see data about important groups of interest. This includes an interest in better data by race, ethnicity, sexual orientation, gender identity, disability, and geography. Improving existing data streams to better support disaggregation is a good investment and one that will meet multiple demands.
For example, the Transformed Medicaid Statistical Information System (T-MSIS) will likely play a role in monitoring service use, but there are concerns regarding the existing quality and completeness of the race and ethnicity data. We have worked with several states who are trying to improve the collection of race and ethnicity data in Medicaid—modifying question wording and expanding response options to better represent the populations they serve, making technical changes to better capture the data, and modifying instructional language and scripts for enrollment assisters to make them stronger partners in data collection. And, most importantly, they are doing this with community input. But they continue to face challenges in this work. For example, current OMB standards for demographics are dated and do not align with the most current research. Additionally, rules for collecting race and ethnicity data are not uniform across federal programs. A new access monitoring effort could serve as further impetus for federal agencies to revise the guidance on race and ethnicity and for states to take action to improve existing data collection to address this critical data gap.
Third, states need both direct funding and hands-on technical assistance to support this work. We appreciate CMS’s understanding that states will need assistance to implement the access monitoring framework. However, based on our work with states, we think this needs to go beyond documentation and uniform measure specifications. To do this well, states should have access to experts who can provide practical, hands-on advice that is responsive to their specific needs. The type of assistance needed will vary and needs to be flexible, from states who are further along in their process and may seek help troubleshooting a particular coding challenge to other states whose request might require more fundamental support, such as walking through the requirements to assess staff and training needs, setting priorities, and help developing contract amendments or RFPs. We would also recommend that any TA effort include a forum for states to discuss implementation challenges with their peers.
The funding provided to states for this effort should also be flexible. It should support direct costs like system modifications, but also things like stakeholder engagement, which is critical to the iteration and improvement of the monitoring plan, and related data collection, but will also allow the results of this monitoring to be shared in a meaningful way.
Fourth, some areas of Medicaid access monitoring are best addressed through federal data collection. We believe that the access monitoring effort would benefit from periodic fielding of a 50-state Medicaid Consumer Assessment of Healthcare Providers and Systems (CAHPS) survey aimed at both children and adults and administered by the federal government. The federal government has a long and successful track record of fielding high-quality surveys that produce estimates for all 50 states, including a one-time National Medicaid Adult CAHPS survey.
While this undertaking would be resource intensive, it seems to us to be the most efficient way to collect comparable information on important facets of access, like enrollee experience, and a starting point for comparing individuals enrolled in fee-for-service versus managed care.
Finally, it is critical to treat states as a full partner in this process, including the communication of results. It goes without saying that states should be consulted in the development of the monitoring plan, but they should also be consulted when the data are being released, preferably beforehand. Ideally, they should have access to analytic files so that they can do their own data runs and share customized findings with stakeholders. Finally, once the data are collected, there should be a commitment that the data be published or released in some format in a timely manner.
Blog & News

Understanding the Undercount of Medicaid Enrollees in the 2020 Current Population Survey Health Insurance Coverage Data
April 6, 2022:Studies have long shown that surveys underestimate the number of people enrolled in Medicaid, and that the extent of this “undercount” varies across surveys and states. SHADAC researchers have made significant contributions in this area, and the extent to which the Current Population Survey Annual Social and Economic Supplement (CPS ASEC) undercounts Medicaid is one of the reasons we typically rely on the American Community Survey (ACS) to track state-level health insurance coverage. However, as the COVID-19 pandemic and ensuing disruptions to data collection for this survey resulted in considerable nonresponse bias in the 2020 ACS and led to the decision to release 2020 ACS data in an experimental-only format, SHADAC has chosen to produce 2020 state-level estimates of coverage using the CPS as a stand-in for the ACS for this year only.1
It is important for users to understand the Medicaid undercount in the CPS when interpreting coverage estimates. In this blog post, we briefly review the research regarding the Medicaid undercount in the CPS, and provide estimates of how it varies across states in 2020. We also discuss the impact of assigning single coverage for those with multiple sources (known as the insurance “hierarchy”) on the Medicaid undercount in the CPS, and other limitations of the data that contribute to the undercount.
Medicaid Undercount
The “Medicaid undercount” refers to the discrepancies that exist between survey estimates of enrollment in Medicaid and the number of enrollees that are actually reported in state and national administrative data—a pattern in which the former estimate is consistently reported lower than the latter. Studies on the subject have shown that nearly all surveys undercount Medicaid/CHIP enrollment relative to administrative sources, but the magnitude of the undercount range can vary broadly between major federal surveys (e.g., the American Community Survey, the Current Population Survey, the Medical Expenditure Panel Survey, etc.).
Previous studies have estimated the Medicaid undercount in the CPS at approximately 30 percent. Research on the Medicaid undercount relies on linking survey data to administrative records to identify whether respondents who were enrolled in Medicaid according to state administrative data reported having Medicaid when surveyed, a process which provides researchers with the best information about the undercount. However, published estimates for 2020 do not exist. Therefore, in order to provide an approximation of the undercount in the 2020 CPS, we compared the weighted count of the population with Medicaid in the CPS to the actual count of Medicaid enrollees based on data from the Centers for Medicare & Medicaid Services (CMS).
Table 1 shows the results of this comparison by state, measuring SHADAC’s estimate of the number of people with Medicaid as a primary source of coverage against the count of Medicaid enrollees from CMS. The undercount varies considerably by state, from just 3 percent in Wyoming to 57 percent in Hawaii.
Reasons for the Medicaid Undercount
Research has shown that the undercount is driven primarily by reporting error; in other words, by people who are enrolled in Medicaid reporting either that they have no insurance or reporting some other type of insurance. As Table 1 demonstrates, the size of the undercount also varies across states. This variation can result from a variety of factors, including how the characteristics of those enrolled in Medicaid differ across states. For example, studies have shown that adults, those with higher incomes, and those with shorter spells of Medicaid coverage are less likely to report having Medicaid when responding to surveys.
There is also reason to consider that the undercount in 2020 may be more severe due to the pandemic. According to recent research, the pandemic resulted in nonresponse bias in the CPS, including the underrepresentation of communities reporting lower incomes, which is likely to mean fewer people reporting Medicaid coverage. It is also likely that the provisions of the public health emergency that provide continuous coverage for those enrolled in Medicaid will result in a larger discrepancy between survey estimates and enrollment, because people that would otherwise become disenrolled due to redetermination of eligibility or for administrative reasons would remain covered.
Impact of Implementing an Insurance “Hierarchy”
Although reporting error is an important driver of the Medicaid undercount in survey data, there are also analytic choices that can impact the extent to which survey respondents are attributed to Medicaid coverage. One of these is the approach of assigning people who report multiple coverage types to just one type of coverage using what is known as an insurance “hierarchy.” SHADAC routinely imposes a primary source of coverage hierarchy when reporting national, state, and sub-state estimates of health insurance coverage. The goal of SHADAC’s coverage hierarchy is to identify survey respondents who report multiple sources of health insurance and determine which source is likely to: (a) be a comprehensive health insurance plan, that (b) serves as the respondent’s primary payer (i.e., the insurance plan that pays first). Despite the analytic soundness of this goal, SHADAC’s hierarchy usually has the effect of increasing the apparent size of the Medicaid undercount.
SHADAC uses separate coverage hierarchies for children (age < 19) and adults (age 19+), as shown in Table 2. The reason for using separate hierarchies by for children and adults is that Medicare is considered the primary source of coverage for adults age 19 and older, as it is the primary payer for covered medical services. For example, if an eligible adult is covered by Medicare either due to age (65+) or disability and is also covered by Medicaid, the primary payer would still be Medicare. Children age 18 and younger are not eligible for Medicare (except in one rare and specific instance), and therefore Employer/Military coverage is considered primary, as many children draw on this source of coverage as dependents of an adult parent or caregiver. Medicaid is considered the payer of last resort in most cases for people who have both Medicaid and some other form of coverage, which is why it is assigned after Medicare and Employer for adults and after Employer coverage for children. More information about SHADAC’s insurance hierarchy is available here.
Table 3 below compares the Medicaid undercount in the CPS with and without application of the SHADAC insurance hierarchy. In the “non-hierarchy” estimates, anyone with Medicaid (regardless of whether they are also covered by another type of insurance) is “counted” as having Medicaid. Not surprisingly, this results in a smaller undercount; in the U.S., the difference between the CPS and CMS data drops from 41 percent to 28 percent. Similar to the undercount estimates with application of the hierarchy, the extent of the change to non-hierarchy data varies across states, from 24 percentage points in Maine to 4 percentage points in Maryland. This variation is due to the difference in the share of people reporting Medicaid and some other coverage type in the CPS. It is also important to note that eliminating the insurance hierarchy does not eliminate the problem of the Medicaid undercount in the CPS overall, or in the vast majority of states.
It is also important to note that the CPS presents unique challenges related both to implementing an insurance hierarchy and the Medicaid undercount. This is primarily due to the reference period of coverage collected in CPS. The CPS gathers information about insurance status over the entire previous year; for instance, if a respondent had separate, non-concurrent spells of Medicaid and employer insurance in the previous year, that respondent would be shown to have both types of coverage in the previous year. With the application of SHADAC’s insurance hierarchy, this person would be assigned to employer-sponsored insurance (ESI) alone, despite having both ESI and Medicaid as primary sources of coverage in the previous year. This is different from the ACS, which captures information about coverage at the time of interview, and therefore all respondents with multiple sources of coverage hold those coverages concurrently.
It is also important to note that there are pros and cons to applying an insurance hierarchy, and the decision to do so or not depends on the research question at hand. A hierarchy may not be appropriate when looking at respondents with a specific source of coverage when the status of that type of coverage as primary versus supplementary is not relevant to the analysis. (e.g., if the question is about understanding the health status of everyone enrolled in Medicaid, regardless of the duration or supplementary status of that coverage). Also, no single hierarchy will be appropriate for every analysis. Rather, analysts can and should alter the priority of coverage types in the hierarchy according to their specific research question. A study focusing on changes in the rates of public coverage over time, for instance, would likely put public coverage types first in the hierarchy before forms of private coverage such as ESI or direct purchase coverage.
Looking Ahead
The CPS has historically undercounted the Medicaid population for a variety of reasons. This issue of undercount does not mean that the CPS is not useful for understanding coverage, but it is important for users to understand this limitation and its causes. SHADAC is available to provide technical assistance to analysts looking to make decisions about how and whether to use the CPS, based on the specific research question of interest.
We are also optimistic that the American Community Survey (ACS) will once again serve as a reliable source of coverage information in 2021, and plan to revert to this data source for providing state-level estimates of coverage. Although Census researchers remain uncertain on whether or not the pandemic may again have impacts on the ACS in the coming year, the fundamental data collection issues (i.e., temporary suspension of mail operations and in-person interviews) that resulted in significant nonresponse bias during the height of the pandemic were not factors for the data collected in 2021.
1 The 2021 CPS was also subject to pandemic-related nonresponse bias, though likely to a lesser extent than the 2020 ACS.
Publication
California's Implementation of the Affordable Care Act: How Medi-Cal expansion has impacted health care access and health status for low-income Californians
Natalie Schwehr, SHADAC Senior Research Associate, was invited by the Center of California Studies at Sacramento State University to give a webinar presentation on Friday, January 28, as part of their "Envisioning California Speaker Series." Dr. Schwehr presented a study conducted by herself and several other SHADAC researchers that was recently published in the California Journal of Politics and Policy (CJPP), entitled Impacts of the Affordable Care Act Medicaid Expansion in California. Dr. Schwehr was also joined by Scott Bain, Principal Consultant for the California State Assembly Committee on Health, for a discussion of the study findings. Click the image below to access slides from this presentation.
Publication
UPDATE State Health Insurance Program Names: 2023
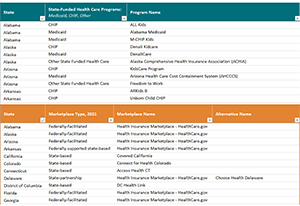 This Excel file includes the names of state-sponsored health insurance programs for all 50 states and the District of Columbia. It documents program names familiar to enrollees; therefore it includes colloquial as well as official names. The document has two tabs – the first includes names of traditional state-sponsored insurance programs such as Medicaid and CHIP. The second tab includes information on insurance marketplaces.
The purpose of the document is to act as a resource for researchers interested in state health care programs. This list was compiled by the State Health Access Data Assistance Center (SHADAC).On an annual basis, SHADAC contacts state Medicaid staff to verify the names of public health insurance programs within each state. SHADAC compiles and delivers these program names to the U.S. Census Bureau for use in federal surveys that measure health insurance coverage, such as the Current Population Survey (CPS).
Information on program names was collected between September and October of 2021 and includes all comprehensive state-sponsored health insurance programs that were in operation during 2021. Therefore, it includes programs that were scheduled to cease operations. Information on marketplace type was confirmed using HealthCare.gov and the Kaiser Family Foundation's 2022 table found here.
We welcome any suggestions for modifications or corrections. Please share them through our email address at shadac@umn.edu.

