
Blog & News


NHIS: Coverage Changes Occurred among Key ACA Subgroups from First Three Quarters of 2016 to First Three Quarters of 2017
February 22, 2018:New coverage estimates from the National Health Interview Survey for the first three quarters of 2017 were published today and indicate few significant changes in health insurance coverage rates when compared with the first three quarters of 2016. At 12.7%, the uninsurance rate for nonelderly adults (ages 18 to 64) at the time of interview was stable, as were the rates of public coverage (19.5%) and private coverage (69.3%) for this group.
This stability in NHIS estimates of uninsurance from 2016 to 2017 mirrors the stability seen from 2015 to 2016, which was preceded by historic declines from 2013 to 2014 and from 2014 to 2015.
Few Significant Changes in Coverage, Except by Income
The new NHIS estimates show that uninsurance rates were stable across age and race/ethnicity when comparing the first three quarters of 2016 to the first three quarters of 2017. The few significant changes that did occur between January-September 2016 and January-September 2017 were seen in coverage by income group. An analysis of non-elderly adults (ages 18-64) by ACA-relevant income breakdowns shows that:
- Among those below 100% FPL, public coverage decreased from 55.0% to 51.3%, and private coverage increased from 20.6% to 25.6%.
- Among those between 138% and 250% FPL, the uninsured rate increased from 19.6% to 21.5%, and private coverage decreased from 54.5% to 52.2%.
- Among those with incomes between 250% and 400% FPL, the uninsured rate increased from 9.9% to 12.1%, and private coverage decreased from 78.3% to 76.1%.
These changes are important to note from a policy perspective because the income groups are among the population (below 400% FPL) specifically targeted by the ACA’s coverage provisions: The ACA’s Medicaid expansion provision aims to increase public coverage among nonelderly adults below 138% FPL, and the ACA’s individual market provisions specifically aim to expand private coverage among nonelderly adults between 138% and 400% FPL.
| Uninsurance: Disparities among Subgroups in 2017 | |
|---|---|
|
Disparities in uninsurance levels continued to be seen among certain subpopulations in the first three quarters of 2017:
|
Increased Enrollment in High-Deductible Health Plans
The percentage of nonelderly Americans enrolled in high-deductible health plans (HDHPs) was one of the few broad points of change in the NHIS estimates, increasing significantly between the first three quarters of of 2016 and the first three quarters of 2017, from 39.1% to 43.2% (4.1pp). This increase was even more pronounced among individuals with employer-sponsored insurance, among whom the percentage enrolled in HDHPs jumped from 39.1% in the first three quarters of 2016 to 43.7% in the first half of 2017 (4.6pp).
A Note about the Numbers
The above estimates provide a point-in-time measure of uninsurance, indicating the percent of persons without coverage at the time of the interview. First three quarters of the year refers to January through September.
For more information about the early 2017 NHIS health insurance coverage estimates, read the National Center for Health Statistics brief. Estimates for the first three quarters of 2016 are available here.
Citation
Martinez, M.E., Zammitti, E.P., & Cohen, R.A. February 22, 2018. “Health Insurance Coverage: Early Release Estimates from the National Health Interview Survey, January-September 2017.” National Center for Health Statistics: National Health Interview Survey Early Release Program. Available at https://www.cdc.gov/nchs/data/nhis/earlyrelease/insur201802.pdf
Blog & News
SHADAC Examines the Implementation of Section 1115 Medicaid Expansion Waivers: MACPAC Report
February 20, 2018:A SHADAC analysis of how four states implemented Section 1115 Medicaid expansion waivers is now available. These states—Arkansas, Indiana, Iowa, and Michigan—are among eight that have expanded their Medicaid programs through Section 1115 of the Social Security Act rather than through the expansion option available under the Affordable Care Act (ACA).

About the Analysis
SHADAC’s analysis, commissioned by the Medicaid and CHIP Payment and Access Commission (MACPAC), sought to understand how Arkansas, Indiana, Iowa, and Michigan approached the implementation of key provisions of their Section 1115 Medicaid expansion waivers:
- Exchange plan premium assistance (Arkansas & Iowa)
- Enrollee contribution requirements (Iowa & Michigan)
- Health savings accounts (Arkansas & Indiana)
- Healthy behavior incentives (Indiana, Iowa, & Michigan)
- Graduated copayments for emergency department use (Indiana)
SHADAC researchers conducted interviews with 33 individuals representing current and former state agency staff and health insurance carriers in the four study states to identify the steps that states took to operationalize their programs. The report provides background information on the waiver program elements implemented in each of the four study states, summarizes the key pieces of administrative capacity that states put into place to implement their waivers, and details the specific program challenges they faced.
Key Themes
Key themes that emerged from the interviews include:
- These waiver programs were more administratively complex than traditional Medicaid, but the effort was worthwhile in order to expand access to coverage.
- The value in waiver-based Medicaid expansions is in testing approaches to incentivize behavior change, not necessarily in saving the state money.
- Involving operational staff in the waiver design process as early as possible may help to ensure policy goals are achievable.
- Building off of existing capacity and infrastructure made implementation manageable under short timelines, but it was not necessarily efficient.
- Significant administrative resources were needed to implement and support ongoing operations of these new programs.
- Considerable IT system redesign was required to develop and maintain programs.
- The complexity of policy provisions being tested meant that targeted and ongoing member outreach was essential, but also an ongoing challenge.
- Despite a need for substantial communication and negotiation with states, health plans generally felt equipped to take on additional implementation responsibilities.
Blog & News
New SHADAC Brief Explores the Impact of Federal Health Care Reform in Minnesota
February 09, 2018:A new brief from SHADAC deputy director Elizabeth Lukanen considers Minnesota’s health insurance market before and after passage of the Affordable Care Act (ACA) as well as the outlook for the state’s market given the current policy environment.
Minnesota’s Market before and after the ACA
The brief, “The Impact of Health Care Reform in Minnesota,” explores insurance coverage, public program generosity, insurance market regulations, and care quality and costs in Minnesota. Except in the area of costs, Minnesota had relatively high marks in these areas predating the ACA. Since the ACA went into effect, the state’s uninsured rate has declined further, although the cost of health care and coverage in Minnesota continues to rise, with a substantial number of Minnesotans (an estimated 50,000 to 70,000) foregoing coverage on the individual market between 2016 and 2017 due to costs.
Health Reform Today: Minnesota
The current health reform focus in Minnesota is the state’s individual insurance market, which state lawmakers have been working to stabilize following the exit of several major insurers. Lawmakers passed a premium relief bill in 2017 to assist consumers in the individual market with the cost of coverage. To further reduce premiums, the state established a state-funded reinsurance program that will reimburse insurers for 80% of insurance claims between $50,000 and $250,000.
Health Reform Today: The National Picture
There have been numerous attempts to repeal and replace the ACA since President Trump took office, but none has so far been successful. In the meantime, the Trump administration can significantly reform health care through other legislative vehicles and has taken steps to do so. Most recently, President Trump signed legislation overhauling the nation’s tax code that included a provision repealing the ACA’s individual mandate tax penalty. The impact of this particular change on the health insurance market as a whole—and the individual market in particular—is not yet known, but experts are concerned about the likelihood of healthier individuals choosing to opt-out of purchasing health insurance, leaving the market to support less healthy individuals.
Looking Ahead
Federal direction on health reform remains unclear, and this uncertainty may be taking a toll on coverage gains made under the ACA, with recent Gallup data showing an increase in the national uninsured rate since the end of 2016. In the face of federal uncertainty and the potential for coverage losses, many states, including Minnesota, are likely to continue to move forward with state-specific legislation to stabilize their individual markets and provide coverage for their residents.
Related
Blog & News
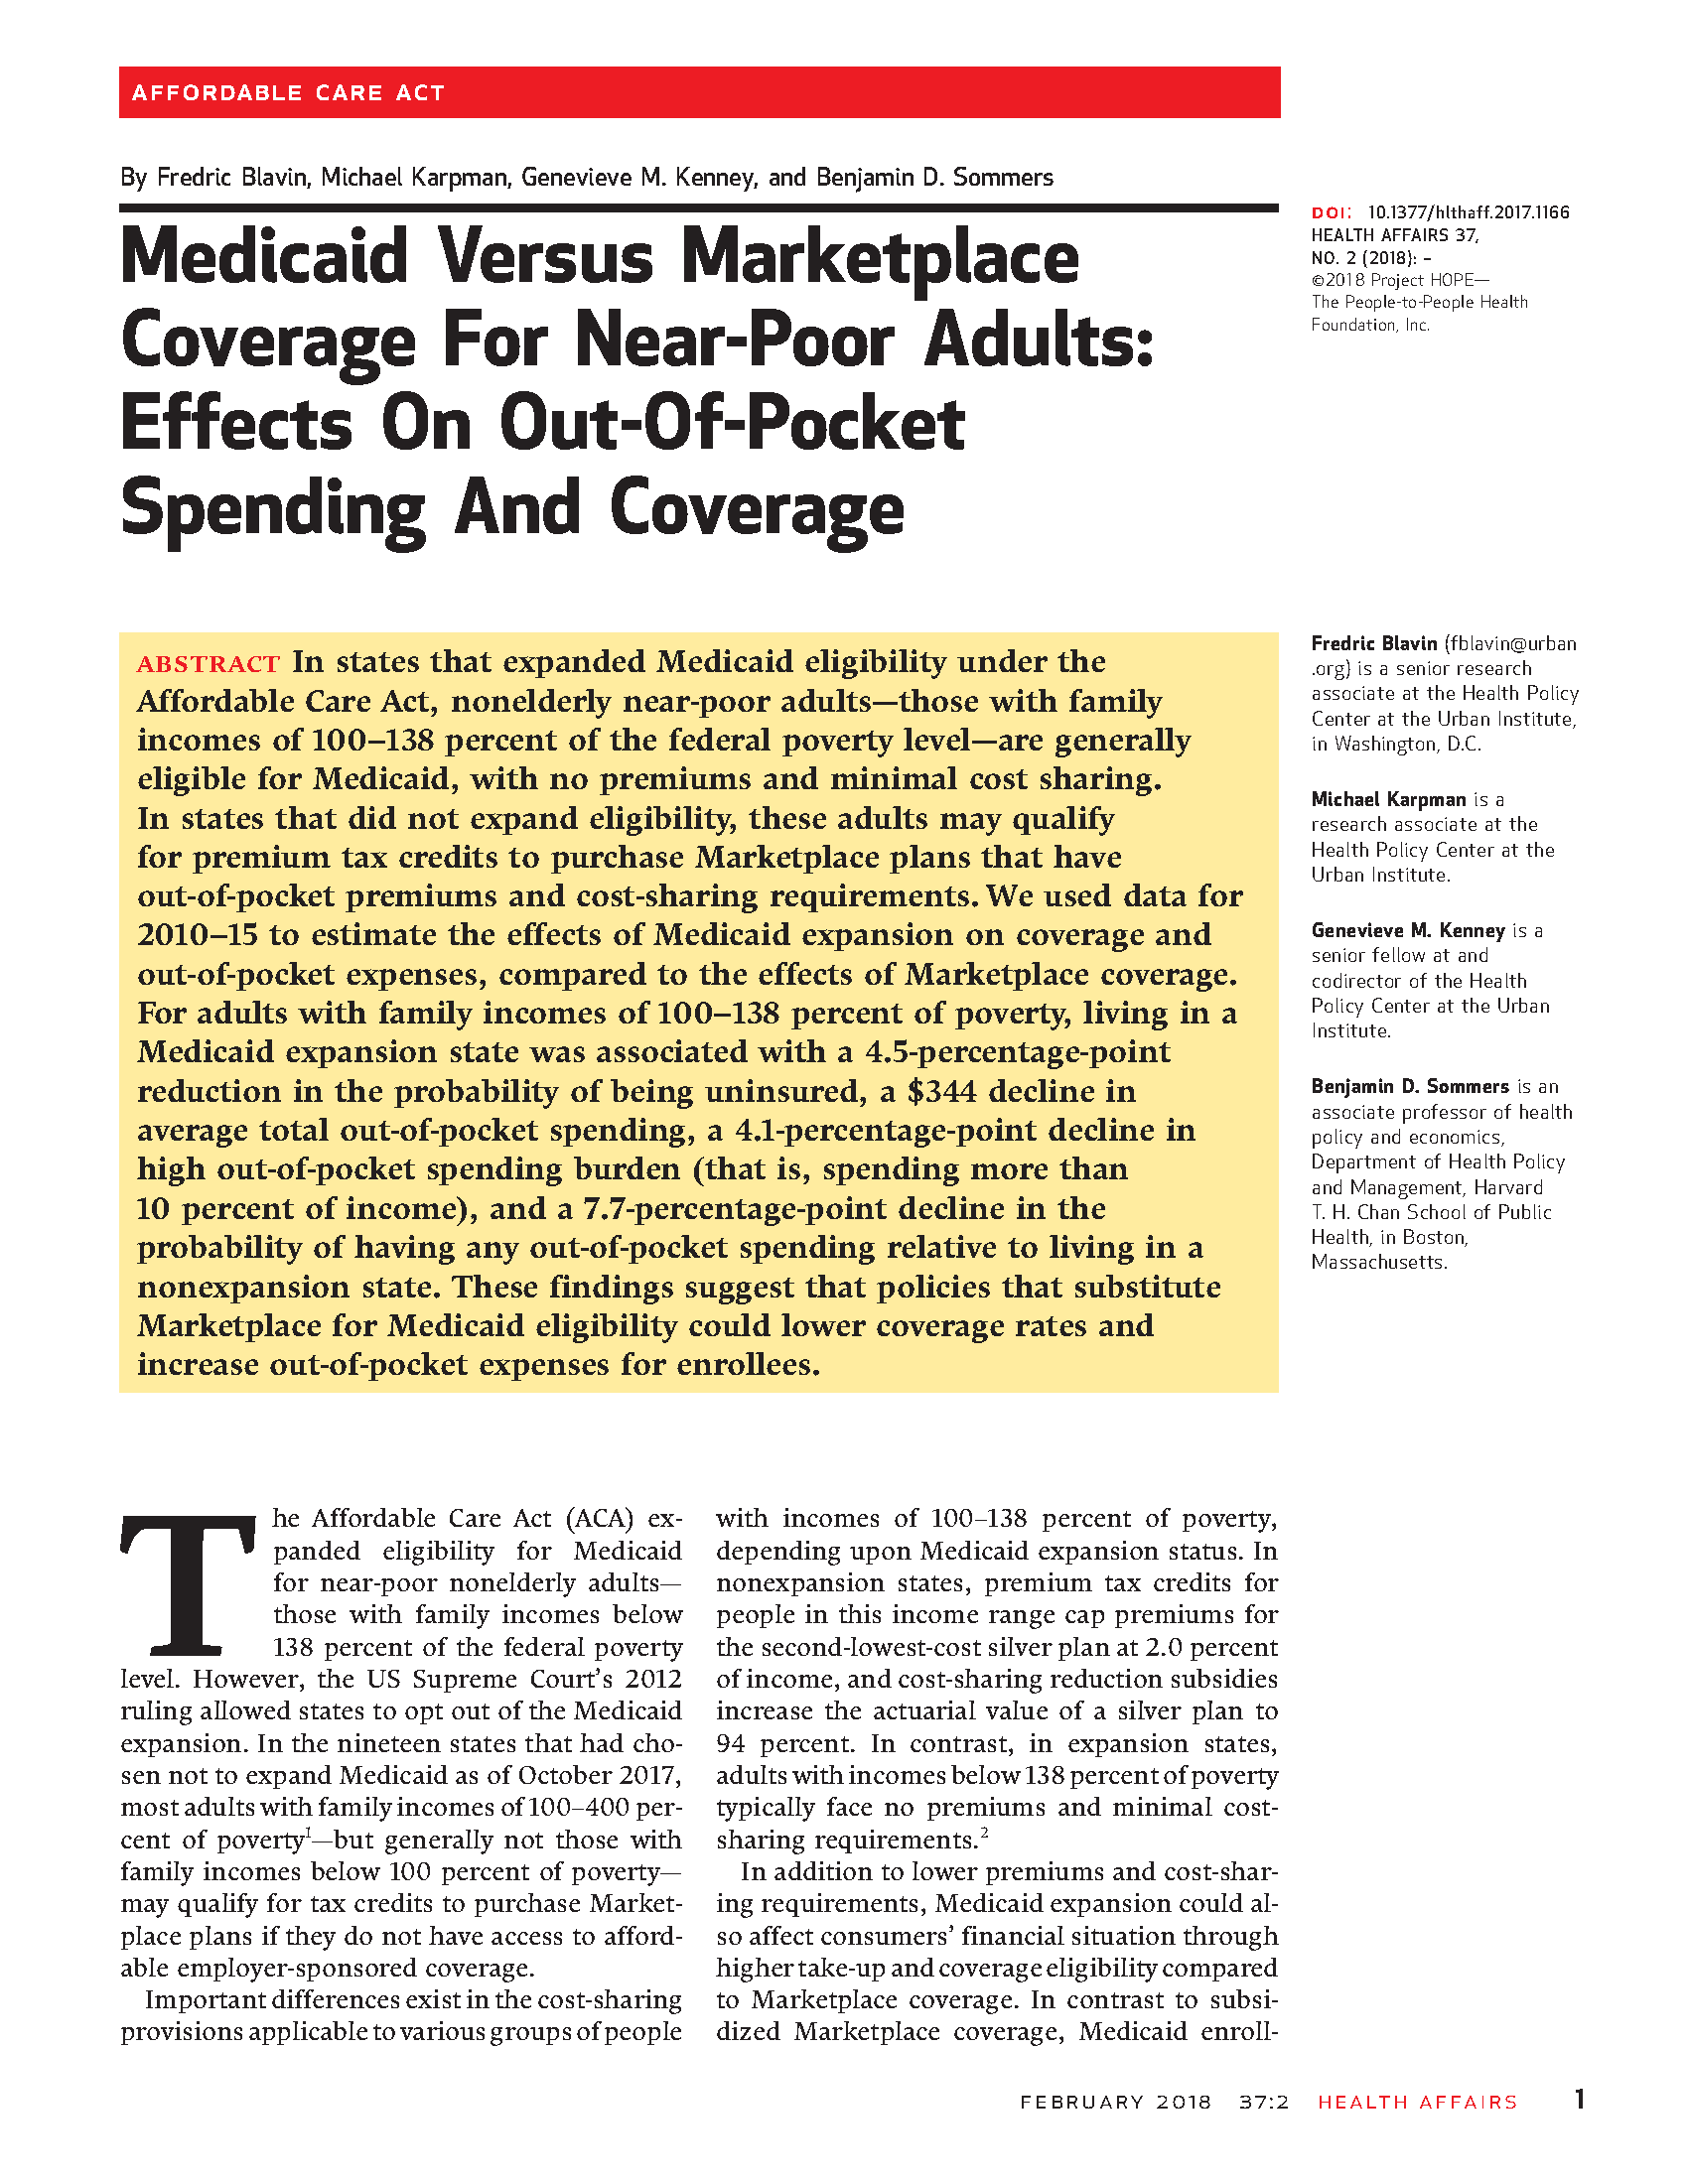
SHARE Results from Fred Blavin in Health Affairs: Among Near-Poor Adults, Access to Medicaid Reduced Out-of-Pocket Spending and Uninsurance
May 15, 2018:According to an article released today in Health Affairs, adults with incomes between 100 and 138 percent of the federal poverty level (FPL)—i.e., “near-poor” adults—saw lower out-of-pocket (OOP) costs and a reduced likelihood of being uninsured in states that expanded Medicaid than in non-expansion states.
Overview: Access to Medicaid among Near-Poor Adults
The analysis, which is based on a SHARE-funded study led by Dr. Fred Blavin (Urban Institute), used 2010 to 2015 data from the Current Population Survey (CPS) and the American Community Survey (ACS) along with state Medicaid expansion decisions as a natural experiment to estimate the impact of access to Medicaid on OOP health expenses and health insurance coverage, compared with access to subsidized Marketplace coverage. In states that chose not to expand Medicaid, near-poor adults may qualify for tax credits to purchase Marketplace plans that involve OOP premiums and cost-sharing; in expansion states, this population would generally face no premiums and minimal cost-sharing if they enrolled in Medicaid instead.
Key Findings: Out-of-Pocket Spending
Using OOP spending information from the CPS, Dr. Blavin and his co-authors found that Medicaid expansion, relative to Marketplace access, was associated with a $344 (33.9%) reduction in average total OOP spending, a $125 (23.0%) reduction in average OOP premium spending, and a $218 (46.4%) reduction in average OOP cost-sharing spending from 2010-2013 (before Medicaid expansion) to 2014-2015 (after Medicaid expansion). These decreases in average OOP spending were primarily driven by declines in the probability of having any OOP spending.
The $344 reduction in average total OOP spending from Medicaid expansion corresponds to 2 percent of annual income for adults in the 100 to 138 percent FPL range, and this is consistent with the amount that near-poor individuals would have to pay out-of-pocket for a Marketplace plan in a states that chose not to expand Medicaid. The authors note, however, that the impact of expansion for those who newly enrolled in Medicaid is likely to be higher, especially for those who had high OOP expenses prior to the ACA—e.g., high-cost uninsured adults and those with expensive employer plans.
| Related Resource: Webinar Recording and Slides | |
|---|---|
|
Dr. Blavin presented findings from this analysis during a SHARE webinar on December 5, 2017. The recording and transcript of this event, along with the presentation slides, are now available online. |
|
| Click here to access these materials. |
Key Findings: Coverage
Using coverage information from the ACS, the authors found that Medicaid expansion reduced the probability of being uninsured among near-poor adults by 4.5 percentage points between 2010-2013 and 2014-2015, compared to non-expansion states. This impact was driven by significant increases in Medicaid coverage that were partially offset by declines in ESI and direct purchase coverage.
According to the authors, these findings imply that more restrictive eligibility and enrollment policies, combined with higher premiums for Marketplace coverage relative to Medicaid, were associated with lower take-up rates among near-poor adults.
Read the full Health Affairs article.
Blog & News

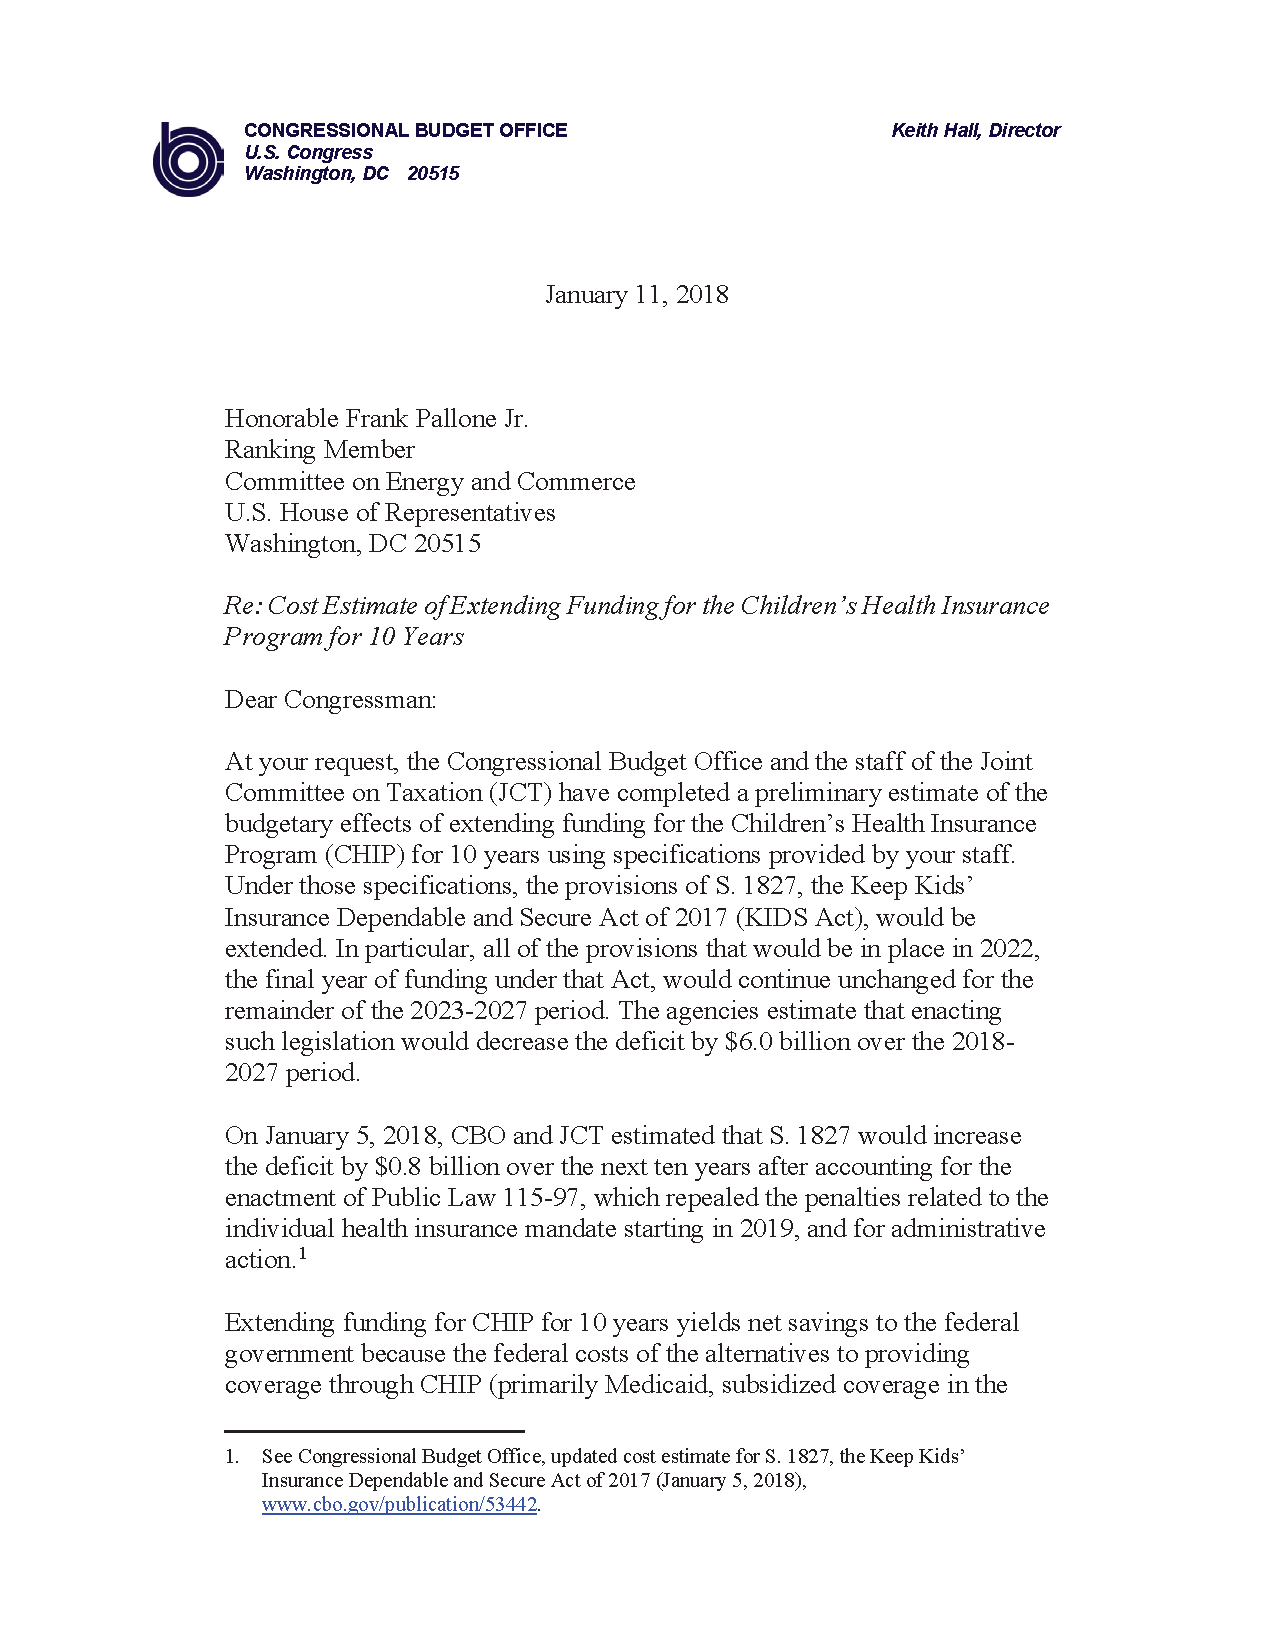
The Children's Health Insurance Program: A Minnesota Perspective
January 22, 2018:Congress has still not fully reauthorized the Children’s Health Insurance Program (CHIP), and states are working to figure out how to keep their kids covered. CHIP provides essential coverage for millions of our nation’s poorest children and should not be used as a bargaining tool in federal budget negotiations. It’s time to put politics aside and reauthorize this program that is vital for vulnerable children and that both sides ofthe aisle claim to support.
Minnesota: A Pioneer in Covering Kids
Minnesota, as a national leader in health care, has a long history of providing coverage for its children--well before the passage of the federal CHIP program. As far back as 1987, Minnesota provided coverage to low-income children who were just above the income level to qualify for Medicaid, and we paid for it with state funds alone. The program initially covered physician services for children under age six and low-income pregnant women who were not Medicaid-eligible. The state financed the program through an annual fee of $35 for pregnant women and $25 for children, and a one-cent tax on cigarette packs.
In 1991, Minnesota's public coverage for kids was expanded to all children under age 18, and in 1992, Governor Carlson passed comprehensive health reform legislation, the HealthRight Act, with broad bipartisan support. Renamed MinnesotaCare, the state's public coverage program provided subsidized health insurance for working families with incomes just above Medicaid eligibility levels (up to 275% of the Federal Poverty Level) who not eligible for employer-sponsored insurance. The program continued to be funded with state-only dollars, and the legislation behind it included earmarked funding from a new 2% provider tax, a 1% health insurance premium tax, as well as a five-cent increase in the cigarette tax.
Early analyses of the impact of MinnesotaCare found that between 1990 and 1995 the proportion of uninsured children (uninsured for 12 months or longer) in Minnesota decreased from 5.2% to 3.1%. This change translated to an increase in access to care for kids and a reduction in the amount of free care given by medical providers to the uninsured.
CHIP's Evolving Role in Minnesota and the Nation
Minnesota and other states that had similarly funded their own safety net programs were thrilled when CHIP passed in 1997. Modeled in part on the Minnesota program, CHIP targeted families just above the eligibility level for Medicaid and provided needed support to low-income working families. In its early years, CHIP funded very few of Minnesota’s low-income children, as the program was targeted to states with larger numbers of uninsured children; in fact, a report from 2000 showed only 8 children in Minnesota covered by CHIP. However, Minnesota leveraged CHIP funding over time, and today Minnesota uses its CHIP dollars to support coverage for 127,000 children and pregnant women. Nationwide, the program is now well-established and covers close to 9 million children.
The Uncertain Future of CHIP Puts the Most Vulnerable at Risk
Minnesota’s goal has always been to get and keep children and their families insured. We know that providing health insurance coverage enhances children’s school performance, increases parents’ work attendance, improves and sustains high immunization rates, and advances the health and economic future of children as they age into adulthood. Most of all, coverage assures that all have an opportunity to pursue their goals and aspirations in life.
Both the delay in the CHIP reauthorization and the real potential for no future funding affects the most vulnerable: poor children. It’s hard to believe, but close to one in every four children in this country lives in poverty. For African American children, the rate is over 40%.
States Employing Stopgap Measures
With the end of CHIP’s authorization on September 30th, states have been able to apply for emergency funding to keep their programs going. Oregon and Minnesota have both pledged to make up what they hope is a temporary funding gap with state dollars, but it puts their finances in jeopardy — Minnesota’s latest budget projection released in early December includes a $188 million shortfall if CHIP is not reauthorized. Meanwhile, other states will need to shut down new enrollment and start notifying families of potential loss of coverage.
In the meantime, the stress to families of not knowing if coverage will continue and for how long, is real. States are scrambling to keep kids covered — making tremendous efforts to find alternative funding, notifying families of the potential phase out of the program, and placing limits on new enrollment in anticipation of a lack of funding.
Funding CHIP: A No-Brainer and the Right Thing to Do
Lynn A. Blewett, PhD, MPA, is Professor of Health Policy at the University of Minnesota, School of Public Health

