
Blog & News
Hest, Robert
Lanigan, Lindsey
Stewart, Andrea


CPS ASEC: 2022 National Health Insurance Coverage Estimates Show Falling Rates of Uninsurance and Direct-Purchase Coverage (Infographic)
September 12, 2023:
Related Releases and Materials
|
The U.S. Census Bureau has released an initial report detailing the state of health insurance coverage in the United States for 2022.
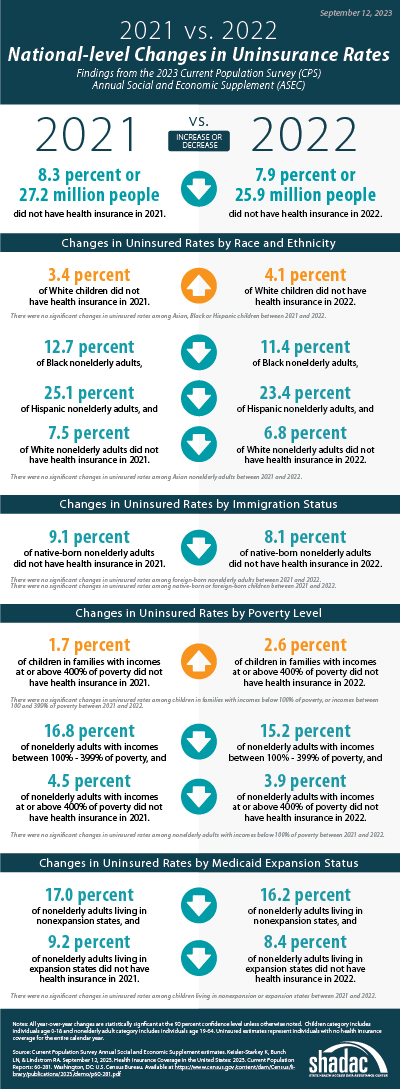
Drawing on data from the Current Population Survey Annual Social and Economic Supplement (CPS ASEC), the report highlights good news overall as the percentage of the population without health insurance coverage at any point in 2022 fell to 7.9% from 8.3% in 2021—a decrease of 0.4 percentage points or approximately 1.3 million people (25.9 million in 2022 vs. 27.2 million in 2021).
The following blog post explores changes in national-level coverage rates by demographic characteristics - such as age, employment, race and ethnicity, immigration status, poverty status, and Medicaid expansion status - for nonelderly adults (age 19-64) and for children (age 0-18). While neither group saw an overall significant change in uninsured rates, both experienced shifts across demographic subgroups.
Additionally of note, though not within the scope of this blog to explore further, elderly adults (age 65+) saw a significant increase in Medicare rates, which the Census Bureau notes is due to a larger elderly population overall, not a larger share of those adults having Medicare. The continued growth of an aging population will continue to have ramifications for a number of health-related measures, including health insurance coverage rates, and bears following in future research.
Changes in Uninsurance by Age (Nonelderly Adults age 19-64, and Children age 0-18) and Characteristics
 Among nonelderly adults, the overall rate of uninsurance fell to 10.8% in 2022, a 0.8 percentage point (PP) decrease from 2021.
Comparatively, the uninsured rate among children remained statistically unchanged from 2021 (5.0%) at 5.4% in 2022.
Race and ethnicity
In 2022, rates of uninsurance fell among nonelderly Black, Hispanic, and White adults, declining to 11.4%, 23.4%, and 6.8% (versus 12.7%, 25.1%, and 7.5%), respectively. Rates of uninsurance among nonelderly Asian adults were unchanged at 7.4%.
Similarly, while uninsurance rates remained stable for children of several racial and ethnic groups in 2022 - 4.1% for Asian children, 4.7% for Black children, and 8.6% for Hispanic children - the rate of uninsurance rose significantly among White children, increasing to 4.1% in 2022 from 3.4% in 2021.
Immigration status
The rate of uninsurance among native-born nonelderly adults fell to 8.2% in 2022 from 9.1% in 2021, while the uninsurance rate among foreign-born adults remained statistically unchanged at 22.1% in 2022 compared to 22.8% in 2021.
Rates of uninsurance were unchanged among native-born children at 4.7% in 2022 and among foreign-born children at 20.6% in 2022.
Poverty level
When examining coverage by poverty level, rates of uninsurance were unchanged at 24.2% among nonelderly adults with incomes below 100% poverty, decreased to 15.2% from 16.8% for those between 100%-399% poverty, and decreased to 3.9% from 4.5% for those living at or above 400% poverty.
In 2022, rates of uninsurance were unchanged for children in the two lower poverty level categories—8.9% for those in families with incomes below 100% poverty and 6.1% for those living in families with incomes between 100%-399% poverty. However, uninsured rates rose to 2.6% among children in families with incomes at or above 400% of poverty, an increase of 0.9 PP from 2021.
Medicaid expansion status
As of January 1, 2022, 38 states and the District of Columbia have chosen to act on the option provided by the Affordable Care Act (ACA) and expand Medicaid eligibility requirements, with the additions of Missouri and Oklahoma last year. Comparing rates of uninsurance by expansion and nonexpansion states revealed divergent trends for nonelderly adults and children.
In 2022, the uninsured rate fell to 8.4% in 2022 from 9.2% in 2021 for nonelderly adults living in expansion states and fell to 16.2% in 2022 from 17.0% in 2021 for those in nonexpansion states.
However, children in expansion and nonexpansion states saw no significant change in uninsured rates for 2022 compared to 2021 at 4.1% and 8.1%, respectively.
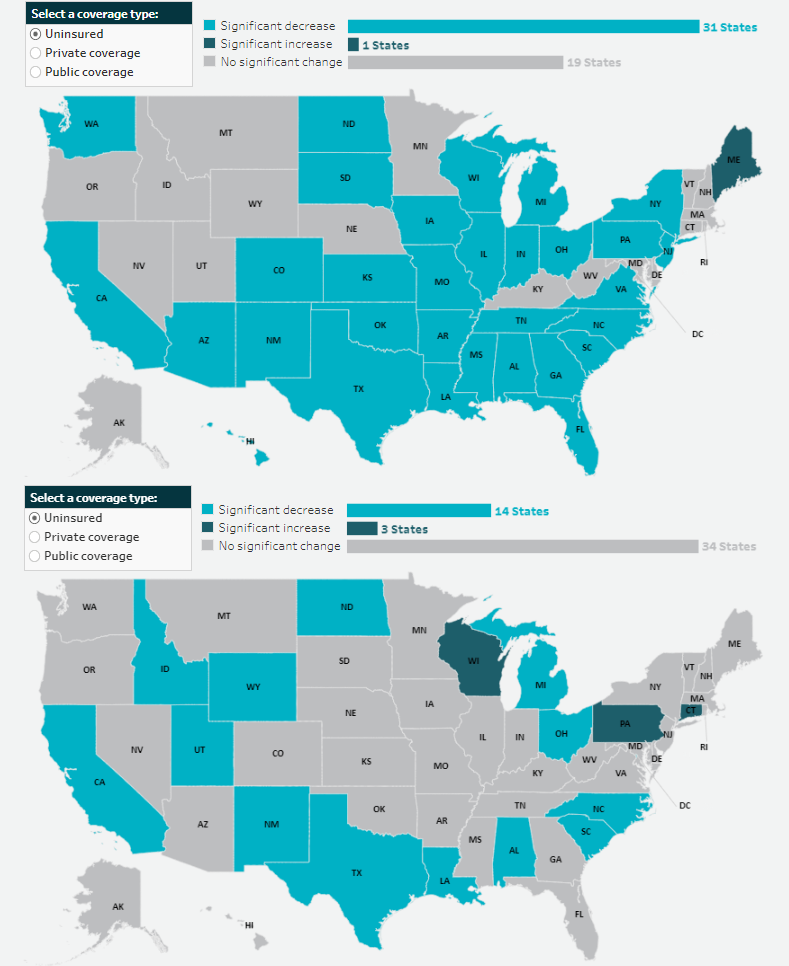
Notable Public and Private Coverage Changes
Among nonelderly adults, rates of public coverage and private coverage were unchanged at 19.1% and 72.9%, respectively. Rates of employer-based coverage increased to 63.5% in 2022 among nonelderly adults, up 0.6 PP from 2021. Rates of Medicare coverage fell to 3.6% among nonelderly adults in 2022, down from 3.8% in 2021.
By Race and Ethnicity (Total Population)
Rates of private and public coverage were statistically unchanged among Asian (72.2% and 27.8%, respectively) and Hispanic individuals (49.4% and 37.7%, respectively).
Among Black persons, the percentage with private coverage rose to 56.6% in 2022, up from 55.1% in 2021, and the percentage with public coverage fell to 41.2% in 2022, down from 42.7% in 2021.
Among White individuals, the percentage with private coverage fell to 72.3% in 2022, down from 73.2% in 2021, and the percentage with public coverage rose to 35.4% in 2022, up from 34.6% in 2021.
Immigration Status (Total Population)
Rates of private and public coverage were unchanged among the native-born population at 67.6% and 36.7%, respectively. Among the foreign-born population, the percent with private coverage was unchanged at 54.4% while the percentage with public coverage rose to 32.8% in 2022 from 31.7% in 2021.
Medicaid Expansion Status (Total Population)
In expansion states, the share with private coverage fell to 66.6% in 2022 from 67.1% in 2021 while the share with public coverage rose to 37.6% in 2022 from 36.9% in 2021. In nonexpansion states, the share of the population with private coverage and public coverage were unchanged at 63.6% and 32.9%, respectively.
Employment Status (Nonelderly Adults)
Public coverage rose among working nonelderly adults in 2022 to 12.6% from 11.8% in 2021 while the share with private coverage was stable at 80.0%. Public coverage rose among those who worked full-time year round and those who worked less than full-time, year round, rising to 8.9% and 23.5%, respectively. Private coverage was unchanged among these groups at 84.8% and 66.0%, respectively. Private and public coverage were unchanged among those who did not work, at 47.5% and 42.6%, respectively.
More on the insurance coverage changes among working-age adults can be found in a topically focused blog released today by the Census Bureau.
Notes
All changes are tested at the 90% confidence level.
All estimates come from the 2022 and 2023 Current Population Survey Annual Social and Economic Supplements, which provide data for years 2021 and 2022, respectively.
Uninsured estimates represent individuals with no health insurance coverage for the entire calendar year.
Estimates of health insurance coverage type represent individuals with that type of coverage at any point during the calendar year. Types of health insurance coverage are not mutually exclusive.
COVID-19 Public Health Emergency Impacts
Continuous Coverage Requirement
The continuous coverage requirement that prevented states from terminating individuals’ Medicaid coverage during the pandemic ended on March 31, 2023. The resumption of Medicaid eligibility redeterminations and renewals (and potential disenrollments), a process commonly referred to as the “unwinding,” began on April 1, 2023, and each state has a year to navigate a return to normal operations while also meeting reporting requirements set by CMS for publicly sharing coverage transitions and outcomes data during this time. While the health insurance estimates released by the US Census Bureau for 2022 precede the beginning of the unwinding process, the data will provide an essential baseline for understanding how health insurance coverage is distributed across the U.S. and among the states prior to the unwinding, as well as marker to measure the impacts of this seismic coverage transition as potentially millions of individuals, both adults and children, are poised to lose Medicaid and must either find another form of coverage (e.g., state-based marketplace or employer-sponsored insurance [ESI]), or risk becoming uninsured.
Several resources have been compiled by SHADAC to track the unwinding process in a variety of avenues, falling under several broader categories:
Guidance for States
- Using Surveys to Monitor Coverage Transitions During the Unwinding of the Medicaid Continuous Coverage Requirement
- Best Practices for Publicly Reporting State Unwinding Data
Health Insurance Coverage Data Tracking
- State-Based Marketplace Transition Data During the Unwinding
- State Dashboards to Monitor the Unwinding of the Medicaid Continuous Coverage Requirement
- Tracking Health Insurance Coverage During the Unwinding: Monthly Data from the Household Pulse Survey
Data Collection and Dissemination - Nonresponse Bias
While Census Bureau researchers have not cited any concerns with CPS ASEC data collection or release processes, an ongoing issue of persistently lower response rates and resultant nonresponse bias has been documented for the past few years, coinciding with the beginning of the COVID-19 pandemic. In March 2023 (the point in time that the CPS is administered), the response rate fell to its lowest point yet, at 68.9%, compared to a pre-pandemic rate of 82% (March 2019). This lower response rate particularly affects the CPS measures of income, and since 2020, the Census Bureau has been working to address the bias in higher reported earnings using new weighting methods to create adjusted income and poverty estimates. More detail on this methodology can be found in a companion blog released today by Census Bureau researchers.
Blog & News
Hest, Robert
Lanigan, Lindsey
Exploring Cost and Coverage Rates in Employer-Sponsored Insurance (Infographic)
September 5, 2023:Throughout the United States, a majority of Americans and their families receive health insurance coverage through their employer. In 2021, the number of people covered by this type of coverage—known as employer-sponsored insurance or ESI—exceeded 169 million. While a fuller picture of the coverage landscape will be available later this fall as agencies such the U.S. Census Bureau release more health insurance data, in this blog and infographic, SHADAC researchers use recently released data from the Medical Expenditure Panel Survey-Insurance Component (MEPS-IC) to analyze private-sector ESI and provide an initial snapshot of estimates for 2022 on a national level and within the states.
Key Findings (2022 vs. 2021)
 Employee Access to Coverage
- The offer of employer-sponsored insurance coverage was extended to a large majority of private-sector workers. In 2022, 85.6% of employees in the U.S. worked in establishments that offered health insurance coverage, a rate that was statistically unchanged from 2021 (85.7%).
Employee Coverage Costs
Premiums
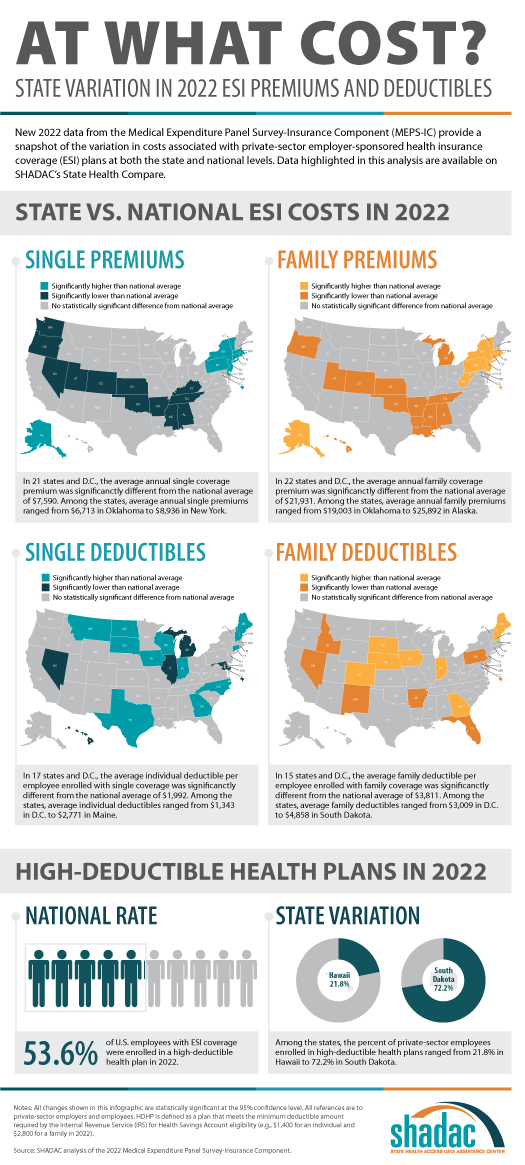
- The average annual premium for single coverage significantly increased to $7,590 in 2022, a $210 or 2.8% increase from 2021.
- Among the states, average annual single premiums ranged from $6,713 in Oklahoma to $8,936 in New York.
- For those enrolled in family coverage, average annual premiums also significantly increased. In this case, premiums increased to $21,931 in 2022, a $550 or 2.6% increase from 2021.
- Among the states, average annual family premiums ranged from $19,003 in Oklahoma to $25,892 in Alaska.
Deductibles
- For single coverage, the 2022 average individual deductible was $1,992, unchanged from 2021 ($2,004).
- Among the states, average individual deductibles ranged from $1,343 in D.C. to $2,771 in Maine.
- Among those enrolled in family coverage, the average deductible per employee enrolled was $3,811 in 2022. This was also unchanged from 2021 ($3,868).
- Among the states, average family deductibles ranged from $3,009 in D.C. to $4,858 in South Dakota.
High-Deductible Health Plans*
- In 2022, the share of employees enrolled in high-deductible health plans (HDHPs) decreased significantly in 2022 to 53.6% – a decrease of 2.1 percentage points from 2021.
- Among the states, the percent of private-sector employees enrolled in high-deductible health plans ranged from 21.8% in Hawaii to to 72.2% in South Dakota.
Key Takeaways
With so many Americans relying on an employer for health insurance coverage, measures of ESI coverage and cost remain important indicators of the financial and health burdens many individuals and families face. These measures will be of greater importance going forward as some current Medicaid enrollees may transition to employer coverage during the 2023-2024 unwinding of the Medicaid continuous coverage requirement. SHADAC is monitoring the unwinding process through a variety of avenues, including: federal surveys, state dashboards, and state-based marketplace data.
In 2022, as in previous years, premiums continued to rise, though premium increases were small compared to the relatively high rate of inflation in 2022. Average deductibles were unchanged from 2021, which represents a break from the long-running trend of increasing deductibles. Additionally, the share of private sector employees enrolled in high-deductible plans decreased by a small but statistically significant margin, which represented the first decrease since 2013. With regard to coverage, a large majority of workers were employed in establishments that offered health insurance coverage, and this was unchanged from 2021.
Notes and Sources
* High-deductible health plans (HDHP) are defined as plans that meet the minimum deductible amount required for Health Savings Account (HSA) eligibility ($1,400 for an individual and $2,800 for a family in 2022).
Data are from the 2022 Medical Expenditure Panel Survey–Insurance Component (MEPS-IC), produced by the Agency for Healthcare Research and Quality (AHRQ).
Health insurance coverage estimates through 2021 are available on SHADAC’s State Health Compare web tool at statehealthcompare.shadac.org, and estimates for 2022 will be added soon.
SHADAC Expertise
Federal Survey Data Release Schedule
American Community Survey (ACS)
An ongoing general household survey conducted by the U.S. Census Bureau provides annual estimates of health insurance coverage at the national, state, and sub-state geographies.
Released
September 14, 2023
• 2022 ACS 1-year data file
January 2023
• 2017-2021 5-Year Public Use Microdata Sample (PUMS) file
October 2022
• 2021 ACS 1-Year Public Use Microdata Sample (PUMS) file
September 2022
• 2021 ACS 1-year data file (i.e., on data.census.gov)
Other Resources
• An Assessment of the COVID-19 Pandemic’s Impact on the 2020 ACS 1-Year Data Analytic Paper
• Introduction to the American Community Survey Public Use Microdata Sample (PUMS) file
Current Population Survey (CPS)
A monthly household survey conducted by the U.S. Census Bureau for the Bureau of Labor Statistics. Data on income and health insurance coverage is collected in its Annual Social and Economic Supplement administered in February through April. Annual health insurance estimates are provided for the nation and states.
Released
September 12, 2023
• 2022 Income, Poverty and Health Insurance statistics from the Current Population Survey Annual Social and Economic Supplement (CPS ASEC)
September 2022
• 2021 Income, Poverty and Health Insurance statistics from the Current Population Survey Annual Social and Economic Supplement (CPS ASEC)
Medical Expenditure Panel Survey (MEPS)
MEPS is a two-component survey sponsored by the U.S. Department of Health and Human Services' Agency for Healthcare Research and Quality. The MEPS-Insurance Component (IC) is a survey of employers that provide data on employer-based health insurance. The MEPS-Household Component (HC) is a panel household survey that is supplemented with data from the respondents' medical providers.
Released
July 2023
• 2022 MEPS-IC Private Sector Tables - National Estimates
• 2022 MEPS-IC Private Sector Tables - State Estimates
• 2022 MEPS-IC Private Sector Tables -Metro Estimates
National Health Interview Survey (NHIS)
A continuous cross-sectional household interview survey conducted by the National Center for Health Statistics (NCHS) which is part of the Centers for Disease Control and Prevention (CDC). It provides information on the health of the U.S. population and includes questions about health insurance coverage, health care utilization and access, and health conditions and behaviors, in addition to demographic and socioeconomic characteristics.
Estimates for sub-annual time periods are released through the NHIS Early Release Program in September, November/December, and February/March each year.
Released
December 2023
• Key Health Indicators: Interactive Estimates from the January 2019 - June 2023 NHIS
June 2023
• 2022 NHIS Public Use Files
Behavioral Risk Factor Surveillance System (BRFSS)
A state-based survey sponsored by the Centers for Disease Control and Prevention that focuses on population health, risk factors, and health behaviors for the adult population.
Released
August 2023
• 2022 Annual Survey Data
Household Pulse Survey
A near-real-time experimental survey from the U.S. Census Bureau. Typically released on a monthly basis.
Note: Based on previous data release calendars.
Page last updated January 2024
Publication
SHADAC's 2020 Health Insurance Unit and Updated Defining Families Issue Brief
In 2012, SHADAC created and released the SHADAC “Health Insurance Unit,” or “HIU,” to aid researchers in reconciling the differences between the way that a “family” is defined in federal surveys (such as the U.S. Census Bureau’s American Community Survey [ACS] or Current Population Survey [CPS]) with the way a “family” is defined by most private and public insurance programs, specifically for the purposes of analyzing health insurance coverage. The SHADAC HIU has been updated over time and has now been updated again in response to changes to policy and program eligibility rules.
To support the use of the SHADAC HIU we have developed three products:
2020 Update of SHADAC’s Health Insurance Unit (July 2020): An issue brief that describes the SHADAC HIU, its purpose, the most recent update, and improvements to HIU data inputs made available by IPUMS.
*RECENTLY UPDATED* Defining Family for Studies of Health Insurance Coverage (July 2023): A brief that outlines the impacts of using the SHADAC HIU in analysis—specifically, analysis showing how the population distribution of family income changes using three different definitions of family: all members in the same household (Census definition), the definition used by the IPUMS (described below), and the SHADAC HIU (described in detail in a companion brief). Researchers can use this brief to assess whether the SHADAC HIU is suitable for their analysis and what the potential impacts of its use might be.
Stata Code (January 2021): Technical documentation of statistical code in STATA and SAS to help researchers to employ the SHADAC HIU in their own analysis using ACS microdata downloaded from IPUMS USA.
Archived documentation from previous versions of the SHADAC HIU include:
"Defining Family for Studies of Health Insurance Coverage" August 2021
"Using SHADAC Health Insurance Unit (HIU) and Federal Poverty Guideline (FPG) Microdata Variables" November 2013
"Defining “Family” for Studies of Health Insurance Coverage" March 2012
For questions about the SHADAC HIU or to receive technical assistance regarding its use, please feel free to contact SHADAC analysts at shadac@umn.edu
Blog & News
Lukanen, Elizabeth
Zylla, Emily
Best Practices for Publicly Reporting State Unwinding Data (Cross-Post)
June 30, 2023:
The following content is cross-posted from State Health & Value Strategies.
Authors: Elizabeth Lukanen, Emily Zylla, SHADAC
Original publication date: June 30, 2023.
The unwinding of the Medicaid continuous coverage requirement represents the largest nationwide coverage transition since the Affordable Care Act. With the restarting of eligibility redeterminations, millions of Medicaid enrollees are now at risk of losing their coverage and there is intense interest in monitoring the impact on coverage. To promote transparency, the Centers for Medicare & Medicaid Services (CMS) is requiring that states report the results of eligibility redeterminations and many states are making that data public. SHVS continues to monitor the states that are publicly reporting their unwinding data either in the form of data dashboards or static pdfs and the states posting copies of their required CMS Monthly Unwinding Data reports.
As advocates and researchers start to analyze unwinding data, it has become clear that it is difficult to compare different states for a variety of reasons. For example, states are initiating redeterminations and therefore disenrollments in different months and some states are staging redeterminations in a way that focuses on certain groups first, such as starting with people least likely to remain eligible. States are using a variety of different strategies to mitigate procedural terminations. States also use different terminology, definitions, population denominators, and timeframes on their reporting, which also makes it difficult to compare one state’s data to another.
In spite of data challenges, there are some best practices states can follow when reporting unwinding data.
- Release CMS Monthly Reports. While we typically don’t recommend releasing competing sources of data on the same topic, in this case, we recommend releasing CMS Monthly Reports alongside any state-specific data reporting to help satisfy calls from advocates and the media for comparable data across states. However, we recommend that states provide context about why the information may differ on state dashboards from CMS monthly reports. Kansas, for example, explains that data on their monthly unwinding reports is different from data on their dashboard because members move between reported categories.
- Timely release. Given the magnitude and scrutiny of unwinding coverage transitions, we recommend that states produce a data report that can be updated easily and frequently – at least monthly. We recommend prioritizing accuracy and timeliness over depth. And, if states are refreshing state unwinding data monthly, they should consider releasing it in tandem with the CMS Monthly Unwinding data reports.
- Prioritize key measures. Because timeliness of this data is so important, the report or dashboard needs to have enough data points to convey key information, but be limited enough to update quickly. In this case, we recommend focusing on measures that are already being reported (CMS Performance Indicators and indicators from the CMS Monthly Unwinding Data report). Key measures include:
- Renewals initiated
- Successful renewals
- Ex-parte/passive renewals
- Coverage terminations
- Procedural terminations
- Medicaid cases sent to the Marketplace
- Call center volume
- Number of terminations who reenroll in a specific period of time (e.g. 90 days)
- Publish disaggregated data. While required CMS data reporting includes very limited data disaggregation, there is a great interest in understanding who is being impacted by the unwinding. At a minimum, we recommend displaying data breakdowns by:
- Program type
- Age (children versus adults)
- Race
- Ethnicity
- Language
- Income
- Geography (ZIP code is best, but by county or any other level lower than statewide is helpful)
- Provide context and transparency. As noted above, there are many reasons that the data reported by different states might be difficult to compare. We strongly encourage states to use their reporting vehicle to contextualize and explain various measures. This includes:
- Document data revisions. We anticipate that states may be asked by CMS to make various adjustments retroactively to their data. States do not need to wait until data is final to post it publicly. They can address this by including revision dates when new data are posted. And wherever possible, maintain an archive of older data for comparability.
- Include both proportions and counts. Proportions are especially useful to help make comparisons across states on measures like procedural denials, but counts are critical for understanding the denominators being used and to get a sense for the magnitude of impacts within states.
- Include data labels, definitions, and context. Provide clear data labels, establish defined date ranges for data being displayed, add data refresh dates (as needed), describe population numerators and denominators if relevant (including exclusions such as pending cases). If the format allows, link to information that can help contextualize the information. This might include the state’s unwinding timeline, information about how redeterminations are being staged or any analysis or reaction to the results to date. For example, California posts their plan for prioritizing and distributing renewals on the same page as their unwinding data. Kentucky also has a webpage dedicated to unwinding that includes the state’s unwinding dashboard (the Kentucky Medicaid Renewals Data Snapshot), their required CMS unwinding reports and materials from monthly stakeholder sessions that provide a summary of the federal requirements, state goals and activities and their progress to-date.
Related SHVS Expert Perspectives:

