
Publication


Health Equity Measurement: Considerations for Selecting a Benchmark (SHVS Brief)
The following content is cross-posted from State Health & Value Strategies.
Authors: Emily Zylla, Andrea Stewart, and Elizabeth Lukanen, SHADAC
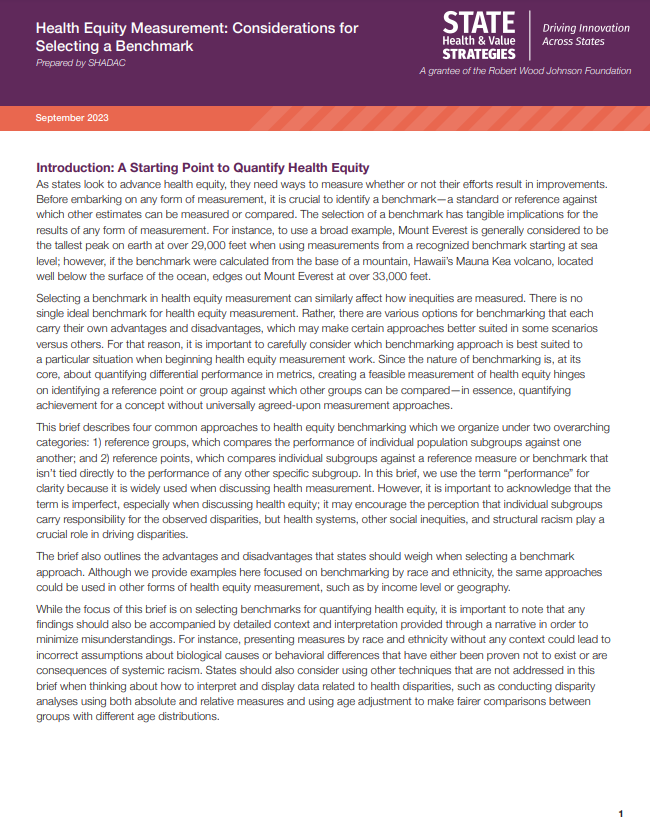
As states look to advance health equity, they need ways to measure whether their efforts result in improvements. Benchmarking can be used to identify health disparities and establish a standard for evaluating efforts to address health inequities.
This issue brief summarizes the advantages and disadvantages of four common approaches to health equity benchmarking:
1) Using the best-performing group as a reference
2) Using the most socially advantaged group as a reference
3) Comparing against a population average
4) Comparing against a set target or goal
Key Findings
- There is no single ideal benchmark for health equity measurement and it is important to weigh the advantages and disadvantages of each before selecting an approach.
- The rationale for selecting a benchmarking approach should be thoroughly explained and accompanied by detailed context and interpretation, acknowledging the role of societal inequality and structural racism in driving disparities to prevent the perception that individual subgroups carry responsibility for the observed disparities.
Conclusion
There is no universal “best” approach to selecting a benchmark for health equity measurement. Ultimately, careful and detailed documentation of benchmarking methodology and other choices made in health equity measurement, paired with a discussion of the root causes of inequities, connects the dots between disparate outcomes and the disparities in power and privilege in which they are rooted to maintain the focus on the goal of advancing health equity.
To read the brief in its entirety click here.
About the Author/Grantee:
State Health and Value Strategies (SHVS) assists states in their efforts to transform health and healthcare by providing targeted technical assistance to state officials and agencies. The program is a grantee of the Robert Wood Johnson Foundation, led by staff at Princeton University’s School of Public and International Affairs. The program connects states with experts and peers to undertake healthcare transformation initiatives. By engaging state officials, the program provides lessons learned, highlights successful strategies and brings together states with experts in the field. Learn more at www.shvs.org.
This issue brief was prepared by Emily Zylla, Andrea Stewart, and Elizabeth Lukanen. The State Health Access Data Assistance Center (SHADAC) is an independent, multi-disciplinary health policy research center housed in the School of Public Health at the University of Minnesota with a focus on state policy. SHADAC produces rigorous, policy-driven analyses and translates its complex research findings into actionable information for states. Learn more at www.shadac.org.

SHADAC Expertise
Federal Survey Data Release Schedule
American Community Survey (ACS)
An ongoing general household survey conducted by the U.S. Census Bureau provides annual estimates of health insurance coverage at the national, state, and sub-state geographies.
Released
September 14, 2023
• 2022 ACS 1-year data file
January 2023
• 2017-2021 5-Year Public Use Microdata Sample (PUMS) file
October 2022
• 2021 ACS 1-Year Public Use Microdata Sample (PUMS) file
September 2022
• 2021 ACS 1-year data file (i.e., on data.census.gov)
Other Resources
• An Assessment of the COVID-19 Pandemic’s Impact on the 2020 ACS 1-Year Data Analytic Paper
• Introduction to the American Community Survey Public Use Microdata Sample (PUMS) file
Current Population Survey (CPS)
A monthly household survey conducted by the U.S. Census Bureau for the Bureau of Labor Statistics. Data on income and health insurance coverage is collected in its Annual Social and Economic Supplement administered in February through April. Annual health insurance estimates are provided for the nation and states.
Released
September 12, 2023
• 2022 Income, Poverty and Health Insurance statistics from the Current Population Survey Annual Social and Economic Supplement (CPS ASEC)
September 2022
• 2021 Income, Poverty and Health Insurance statistics from the Current Population Survey Annual Social and Economic Supplement (CPS ASEC)
Medical Expenditure Panel Survey (MEPS)
MEPS is a two-component survey sponsored by the U.S. Department of Health and Human Services' Agency for Healthcare Research and Quality. The MEPS-Insurance Component (IC) is a survey of employers that provide data on employer-based health insurance. The MEPS-Household Component (HC) is a panel household survey that is supplemented with data from the respondents' medical providers.
Released
July 2023
• 2022 MEPS-IC Private Sector Tables - National Estimates
• 2022 MEPS-IC Private Sector Tables - State Estimates
• 2022 MEPS-IC Private Sector Tables -Metro Estimates
National Health Interview Survey (NHIS)
A continuous cross-sectional household interview survey conducted by the National Center for Health Statistics (NCHS) which is part of the Centers for Disease Control and Prevention (CDC). It provides information on the health of the U.S. population and includes questions about health insurance coverage, health care utilization and access, and health conditions and behaviors, in addition to demographic and socioeconomic characteristics.
Estimates for sub-annual time periods are released through the NHIS Early Release Program in September, November/December, and February/March each year.
Released
December 2023
• Key Health Indicators: Interactive Estimates from the January 2019 - June 2023 NHIS
June 2023
• 2022 NHIS Public Use Files
Behavioral Risk Factor Surveillance System (BRFSS)
A state-based survey sponsored by the Centers for Disease Control and Prevention that focuses on population health, risk factors, and health behaviors for the adult population.
Released
August 2023
• 2022 Annual Survey Data
Household Pulse Survey
A near-real-time experimental survey from the U.S. Census Bureau. Typically released on a monthly basis.
Note: Based on previous data release calendars.
Page last updated January 2024
Publication
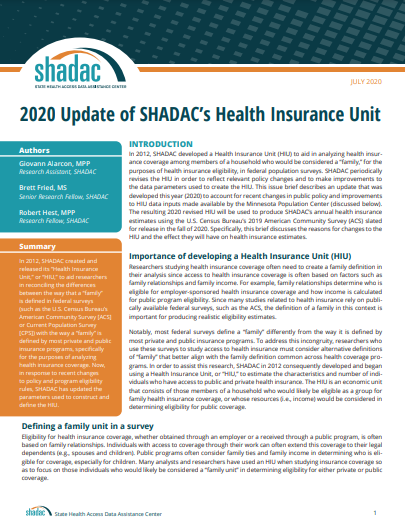
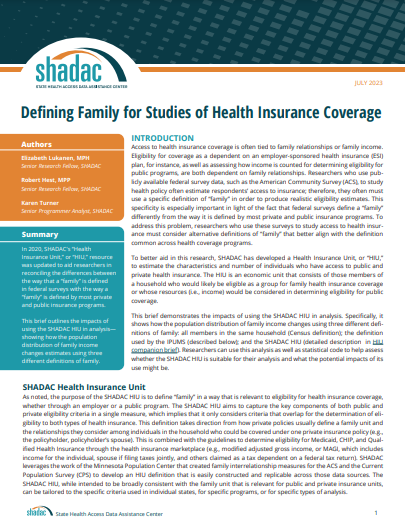
SHADAC's 2020 Health Insurance Unit and Updated Defining Families Issue Brief
In 2012, SHADAC created and released the SHADAC “Health Insurance Unit,” or “HIU,” to aid researchers in reconciling the differences between the way that a “family” is defined in federal surveys (such as the U.S. Census Bureau’s American Community Survey [ACS] or Current Population Survey [CPS]) with the way a “family” is defined by most private and public insurance programs, specifically for the purposes of analyzing health insurance coverage. The SHADAC HIU has been updated over time and has now been updated again in response to changes to policy and program eligibility rules.
To support the use of the SHADAC HIU we have developed three products:
2020 Update of SHADAC’s Health Insurance Unit (July 2020): An issue brief that describes the SHADAC HIU, its purpose, the most recent update, and improvements to HIU data inputs made available by IPUMS.
*RECENTLY UPDATED* Defining Family for Studies of Health Insurance Coverage (July 2023): A brief that outlines the impacts of using the SHADAC HIU in analysis—specifically, analysis showing how the population distribution of family income changes using three different definitions of family: all members in the same household (Census definition), the definition used by the IPUMS (described below), and the SHADAC HIU (described in detail in a companion brief). Researchers can use this brief to assess whether the SHADAC HIU is suitable for their analysis and what the potential impacts of its use might be.
Stata Code (January 2021): Technical documentation of statistical code in STATA and SAS to help researchers to employ the SHADAC HIU in their own analysis using ACS microdata downloaded from IPUMS USA.
Archived documentation from previous versions of the SHADAC HIU include:
"Defining Family for Studies of Health Insurance Coverage" August 2021
"Using SHADAC Health Insurance Unit (HIU) and Federal Poverty Guideline (FPG) Microdata Variables" November 2013
"Defining “Family” for Studies of Health Insurance Coverage" March 2012
For questions about the SHADAC HIU or to receive technical assistance regarding its use, please feel free to contact SHADAC analysts at shadac@umn.edu
Publication
Opportunities to Learn More About Serving Justice-Involved Individuals Through 1115 Demonstration Evaluations
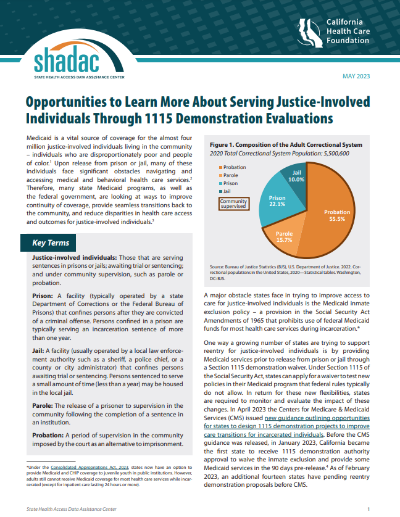
Medicaid is a vital source of coverage for the almost four million justice-involved individuals living in the community – individuals who are disproportionately poor and people of color. Upon release from prison or jail, many of these individuals face significant obstacles navigating and accessing medical and behavioral health care services. Therefore, many state Medicaid programs, as well as the federal government, are looking at ways to improve continuity of coverage, provide seamless transitions back to the community, and reduce disparities in health care access. A major obstacle states face in trying to improve access to care for justice-involved individuals is the Medicaid inmate exclusion policy – a provision in the Social Security Act Amendments of 1965 that prohibits use of federal Medicaid funds for most health care services during incarceration. One way a growing number of states are trying to support reentry for justice-involved individuals is by providing Medicaid services prior to release from prison or jail through a Section 1115 demonstration waiver. Under Section 1115 of the Social Security Act, states can apply for a waiver to test new policies in their Medicaid program that federal rules typically do not allow.
In April 2023, the Centers for Medicare & Medicaid Services (CMS) issued new guidance outlining opportunities for states to design 1115 demonstration projects to improve care transitions for incarcerated individuals. Before the CMS guidance was released in January 2023, California became the first state to receive 1115 demonstration authority approval to waive the inmate exclusion and provide some Medicaid services in the 90 days pre-release. As of February 2023, an additional fourteen states have pending reentry demonstration proposals before CMS.
|
This new issue brief from SHADAC researchers, funded by the California Health Care Foundation (CHCF), identifies the unique opportunities states should consider when designing evaluation plans specific to their justice-involved populations, provides an overview of justice-involved 1115 demonstration initiatives, and summarizes what is known from existing evaluations of these activities. The brief also identifies a set of opportunities to design robust and equity-focused 1115 demonstration evaluation plans specific to justice-involved populations. Given the complex dynamics, unique obstacles, and varied experiences justice-involved individuals face, a new, more equity-focused evaluation approach is needed. |
Key recommendations for designing a robust and accountable evaluation of justice-involved initiatives.
1. Center the voices of people with lived experience in the evaluation approach
2. Collect robust monitoring data in order to build evidence for a topic where existing knowledge is limited
3. Consider additional meaningful outcome measures outside typical health outcomes
4. Seek to understand the unique experiences of different populations in the data analysis plan in order to address equity
5. Prioritize cross-sector data linkage activities and start planning early
To complete this work, SHADAC researchers reviewed states’ 1115 waiver applications, related CMS guidance and public waiver documentation, relevant grey and peer-reviewed literature, and conducted interviews with 11 key informants with expertise in state Medicaid, federal policy, justice-involved health care, evaluation, and lived experience.
Related Reading:
Targeting Justice-Involved Populations through 1115 Medicaid Waiver Initiatives: State Implementation Experiences (SHADAC)
From Corrections to Community: Reentry Health Care (CHCF Project)
This work is supported by:

Blog & News

Considerations from SHADAC: Proposed Revisions to Federal Standards for Collecting Race/Ethnicity Data
March 23, 2023:
|
On January 26, 2023, the Interagency Technical Working Group on Race and Ethnicity Standards released an initial set of recommended revisions to the Office of Management and Budget’s (OMB) Statistical Policy Directive No. 15: Standards for Maintaining, Collecting, and Presenting Federal Data on Race and Ethnicity (SPD 15). SHADAC summarized the proposed revisions to the OMB standards in a recent State Health & Value Strategies Expert Perspective. The public was invited to provide comment on the proposed revisions, and below, we provide text from the feedback that SHADAC submitted to Dr. Karin Orvis, Chief Statistician of the United States, in response to these revisions. We encourage other interested parties to also submit their comments, especially those who can provide state-level perspectives such as state data analysts and policymakers. |
Response from SHADAC
The State Health Access Data Assistance Center (SHADAC) is a health policy research center within the University of Minnesota School of Public Health. We provide technical assistance (TA) to states in the areas of data use and analysis to support policy. The below comments are based on SHADAC’s specific experience supporting states as they address challenges related to the collection of data on race, ethnicity, language, disability, sexual orientation, and gender identity via the Medicaid application.
SHADAC was thrilled to see the revised OMB standards related to the collection of race and ethnicity. The proposed revisions align with available evidence, are consistent with the changes made by leading states, and most importantly, explicitly state that these standards should serve as a minimum baseline with a call to collect and provide more granular data. However, while these standards are specifically named as minimum reporting categories for data collection throughout the Federal Government, if adopted, they are likely to shape data collection and reporting across all sectors, including the states with whom we work that collect race/ethnicity data through the Medicaid application process.
State Medicaid programs have the flexibility to develop their own applications and race and ethnicity questions as long as they meet CMS-established reporting requirements (which follow current OMB guidance). Although many states follow the application model that CMS developed in 2013, our research has found 65 different variations in how these data are collected across all states and modes (e.g., paper, online). Once collected, this information is used in a wide variety of ways: to support state analysis and operation; in reporting to CMS; and to feed into the T-MSIS, which in turn is released as the research-ready T-MSIS data files used by researchers studying Medicaid program health outcomes, health equity, and administrative accountability.
Given the role OMB standards play in shaping state data collection approaches and the obvious impact and reach of these data, we respectfully submit our comments aimed at supporting the adoption of a revised set of standards.
Cross Program and Agency Alignment
Guidance needs to include detail on how any revisions will filter through data collection and reporting across all sectors that impact states/federal interactions. Will all federal agencies adopt the proposed new standards on the same timeline?
For example, all Food and Nutrition Services (FNS) state agencies are currently required to collect race and ethnicity according to prescribed specifications: race and ethnicity must be collected using a two-question format (ethnicity must be collected before race), and the minimum categories must align with OMB standards. Therefore, states with a combined Medicaid/SNAP application currently cannot offer a combined race/ethnicity question even though the most current evidence shows that is the preferred approach. States will want to know whether the adoption of the new proposed OMB standard allowing for a combined race/ethnicity question will supersede the existing FNS guidance on how to collect this information. Or will states that want to pursue a combined question on their combined Medicaid/SNAP application have to wait for updated FNS guidance to be released?
Similarly, existing guidance requires states to share data (including demographic data like race and ethnicity) with health plan carriers via a federally standardized 834 template. States cannot make changes to existing data fields on this form—any changes made currently result in enrollment transaction failures. If OMB standards are updated, how and when will changes be made to the 834 file form to align with these new changes?
Finally, the revisions have implications for state data reporting of race and ethnicity into the Transformed Medicaid Statistical Information System (T-MSIS). If approved, states will need guidance on how to transition to a single data element (combined race and ethnicity). They will need to understand how to streamline or roll-up more granular data and more write-in data and how to manage the likely increase in people who report more than one race.
Data Granularity
The revised guidance rightfully acknowledges the challenges associated with collecting more granular data. If the final guidance recommends the inclusion of an open text response option for each detailed category, states will need detailed, individual guidance on how best to manage those data. While most states prioritize granularity, they simply don’t have the staff time or, in some cases, the expertise to develop the thoughtful and detailed cleaning and coding procedures required to process a large volume of write-in data. In addition, many current IT systems don’t have the functionality to collect and store a large volume of write-in data.
One way to support this would be to develop or enhance an existing hierarchy that includes a long and diverse list of racial and ethnic categories, such as the Centers for Disease Control Race Category and Ethnicity Groupings. Another way to support the use and reporting of disaggregated data is to provide technical support and guidance around data use standards. This could include standards around recency, maximum “refusal to answer” thresholds, data missingness thresholds, and sample size thresholds that guide suppression of publication.
Technical Assistance
States need direct technical assistance (TA) to support the successful implementation of revised standards. This will need to go beyond documentation and guidance. To do this well, states should have access to experts who can provide practical, hands-on advice that is responsive to their specific needs. The type of assistance needed will vary. States with sophisticated analytic teams may seek advice on how to bridge race and ethnicity data collected under one method with data collected under a revised method. Other states may need more fundamental support to implement the expanded race/ethnicity option in a way that is the least disruptive to their current data collection structure.
We would also recommend that any TA effort include a forum for states to discuss implementation challenges with their peers and serve as a repository for promising practices. States will face different challenges but always appreciate having a forum to discuss problems and solutions with other state officials. In addition, there is limited research on best ways to collect data on race and ethnicity and even less on operational considerations for collecting this information in an administrative context like a Medicaid application. Technical assistance should encourage and support the evaluation of systems’ improvements and serve as a clearinghouse for sharing key findings.
To build trust with the enrollees from whom this data is being collected, states would also benefit from technical assistance or model training materials on the best ways to communicate why this data is being collected and how it is being used (e.g., TA on effective forms of community engagement, Navigator or assister training, or instructional language scripts for frontline workers.)
Funding
Questions that collect race and ethnicity data within the Medicaid application are embedded in many other complex and multifaceted questions about topics such as employment, income, household composition, etc. The systems that collect and house this information vary in their age, technical capacity, and purpose. Almost uniformly, they are complex and expensive to change, both in terms of data collection but also data transfer, reporting, and sharing. Ideally, states can access new dedicated funding or receive clear guidance on how existing federal money can be used to make necessary IT and systems changes.
The funding associated with this effort should also be flexible. It should support direct costs like system modifications but also priorities such as stakeholder engagement, instructional language development, and training—all of which are critical to successfully implementing the revised data collection guidance.
Urgency of Additional Guidance
While we are encouraged to see revised standards related to race and ethnicity data collection, we want to stress the urgency of revised guidance related to data collection on sexual orientation, gender identity, primary language, and disability. The current standards on sex are woefully inadequate, to the point of causing harm to people who identify as belonging to a sexual or gender minority population. Standards around disability and language are similarly lacking. Given the intersectionality of these concepts as they relate to identity, it’s important to make progress on updating standards for all areas, not just one. In addition, if states are to make significant investments to modify application wording as well as data systems and reporting structures to improve the collation of race and ethnicity, it makes sense to do this with the knowledge and understanding of timing for future changes regarding sexual orientation, gender identity, primary language, and disability. At the best, these timelines could be aligned, and at the least, states should have visibility to when those revisions are likely to be released.

