
Blog & News


State-Specific Surveys Encompassing Residents’ COVID-19 Experiences
Original blog posted on June 12, 2020:Updated on February 26, 2021
Introduction and Purpose
One of the ways that states are responding to the novel coronavirus epidemic is to gather timely information from residents on their personal experiences and opinions regarding the pandemic. Such real-time information helps states effectively plan for current and impending impacts of this unprecedented public health crisis. The crisis has had significant impacts, including loss of employment and income, disruptions in employer-sponsored insurance coverage, and increased need for testing and treatment of COVID-19. State COVID-19 surveys can supplement and improve upon national data collection by providing needed information at the regional, state, and local levels. In addition, state polls and surveys can be tailored to address each state’s experience with the coronavirus and its priorities.
This blog from the State Health Access Data Assistance Center (SHADAC) provides a summary of state efforts to capture information on the coronavirus pandemic through state and local surveys fielded between March 2020 and January 2021. We include information on topics covered within the surveys as well as some results, in certain cases where they are available. Additionally, we have put together a clickable state-level map that provides links to the data collection instruments and results we identified in our search. Since our last update in October, we have identified 25 new surveys and 17 updated surveys. We encourage you to explore the survey information we collected by clicking on one of the blue highlighted states on the map below.
Note: The majority of the survey sources saved here include both survey questions and topline results. In some instances, we were not able to find information from the survey source, and instead included news articles referencing the results and methodology of the survey. Updates to previously identified surveys are noted.
Methods
SHADAC researchers conducted a targeted scan of state data collection efforts, namely surveys and polls, conducted by state agencies and other state and local stakeholders (e.g., universities, foundations, etc.). Sponsors and commissioners of these surveys include state universities, state and local health departments, health policy groups, and partnerships between universities and the media. We searched for surveys that included questions on the following:
- attitudes and beliefs about health-related issues of the pandemic;
- opinions about the state response to the pandemic;
- impact of COVID-19 on health and health care for individuals and families;
- impact of COVID-19 on loss of employment, loss of income, and disruptions in employer-sponsored health insurance; and
- knowledge and use of health and social safety net services.
The purpose of this scan was to provide an inventory of state-focused primary data collection efforts as well as to identify areas of commonality between these efforts. Search terms used in the most recent scan included the state name, “COVID-19” (and variations thereof), and “survey.” We focused primarily on surveys related to individuals’ access to needed health care, opinions on public health response, and disruptions in health insurance coverage. We excluded opinion polls conducted by market research firms and the media to gauge public opinion on administration of the crisis. Surveys of school districts and businesses were considered outside of the scope of our scan, as well.
Results
States represented: We conducted a scan across all 50 states and the District of Columbia (D.C.). As of January 2021, we found 41 states (an additional six states since our last update) with population-based surveys on health topics related to the coronavirus. Of those states, the number of surveys per state ranged from one to thirteen, though most states did not have more than four surveys. We identified four new surveys for a total of thirteen surveys in California that matched our criteria, each with slightly different focus areas. For example, we previously identified a survey sponsored by the California Health Care Foundation (CHCF) that was primarily interested in health care access and affordability. This update includes another CHCF survey focused on the experiences of low-income adult residents since the beginning of the pandemic, and asks specifically about racial discrimination. Another survey from the University of California—Berkley focused on issues related to specific vulnerable communities like farmworkers and people of color. We also included the larger California Health Interview Survey, which asks questions about COVID-19 treatment and impact as well as health insurance coverage.
Target population: Of the 113 total surveys identified across 41 states, most of these targeted specific populations such as working-age adults, parents of school-age children, or students. Nine surveys targeted larger localities (e.g., Los Angeles County, the Atlanta Metropolitan Area, the Detroit Metropolitan Area, etc.), and three other surveys targeted residents of multiple states with results stratified by state residence. These multi-state surveys represented specified segments of the country; for instance, the Great Lakes Poll from Baldwin Wallace University represented opinions primarily in the Midwest.
The majority of surveys focused on adults (age 18-64 and 65+), and nine surveys focused specifically on parents and caregivers or families; for example, one survey conducted by the New York Department of Education collected responses from both parents and children regarding comfort level in returning to school. All surveys included sections to collect demographic information on survey respondents (e.g., age, sex, and race/ethnicity), and most results were stratified by some of these characteristics.
Topics: Surveys included questions on the following subjects (among others): lifestyle changes resulting from the pandemic; contact with or knowledge of persons with confirmed cases; safety measures taken such as wearing a mask, physically distancing, and avoiding public places; perception of threat posed by the virus; ability to obtain medications, mental health care, and physical health care; ability to pay bills; mental health challenges such as increased stress and increased worry resulting from the pandemic; resources needed; returning to school; and opinion on an administration’s or entity’s handling of the crisis. Another common topic across the new surveys identified was public willingness to get the COVID-19 vaccine. Eighteen new surveys and 11 survey updates included questions and/or results about perspectives on COVID-19 vaccination hesitancy.
Timeframe: Some surveys or polls captured point-in-time information on public attitudes toward COVID-19. Other surveys are being conducted periodically, using multiple waves to establish baseline attitudes and points of comparison. For example, the City University of New York School of Public Health has conducted weekly, biweekly, and then monthly interval surveys since mid-March 2020 to closely capture respondents’ evolving opinions.
Survey results: While some surveys were still only in the field during our first iteration of survey information collection, many had already (and have since continued to) produced results. Reported results usually included overarching takeaways from the data, as well as topline information and crosstabs for survey questions. Many questions were broken down by demographic characteristics in order to take a closer look at nuance in public opinion.
States are continuing to gather interesting findings from their surveys; newly identified surveys tended to include information on subpopulations of interest and explored COVID-19 vaccine hesitancy. For example, a survey conducted by the Oregon Health Authority, in conjunction with Lara Media Services and DHM Research, oversampled people of color and employed innovative outreach methods to survey additional members of Oregon’s Latino community. Select survey results for Oregonians compared to those for Oregon’s Latino community included a higher likelihood among the Latino community to use and follow personal protective behaviors, but a lower likelihood to quarantine if they experience symptoms or have direct contact with someone with COVID-19. A top reason for lack of quarantine provided by the Latino community surveyed was the “need to work” since it’s their “only source of income.” In terms of the likelihood of getting the COVID-19 vaccine, state survey results revealed some similar insights. For instance, a statewide poll by the University of Texas and the Texas Tribune found that 42% of respondents would get the vaccine; when data were disaggregated by race and ethnicity, survey results showed that 44% of White, 30% of Black, and 47% of Hispanic respondents reported that they would get the vaccine. Another poll from the Hartford Courant and Sacred Heart University found that 44% of respondents would get the vaccine. When stratified by race, 48% of White, 28% of Black, and 41% of Hispanic respondents reported that they would get the vaccine. The Louisiana Public Health Institute’s Statewide COVID-19 survey presented data by coverage type and found that 60% of those who had health insurance reported that they would definitely/probably get the vaccine while only 43% of those who were uninsured reported that they would definitely/probably get the vaccine.
If you are aware of a survey that is missing from this resource, please refer them to our email at shadac@umn.edu.
Blog & News
COVID-19 Vaccination Rates: State-level and Subpopulation Evidence from the Household Pulse Survey (Update: Jan 20 to Feb 1)
February 11th, 2021:Newly available COVID-19 vaccines promise to help protect individual Americans against infection and eventually provide population-level herd immunity. However, while the pace of COVID-19 vaccinations has picked up somewhat in recent weeks, the overall rollout thus far has remained somewhat slow and inconsistent. The initial groups prioritized for vaccination were health care workers on the front lines of the pandemic and nursing facility residents, many of whom are especially vulnerable to COVID-19 infection and severe outcomes.
While these groups continue to hold priority in vaccination slots, in response to reports of vaccines lingering unused and criticism from the public that limitations on vaccinations have too far slowed progress toward herd immunity many states have also recently begun expanding vaccine access to other (still high-priority) segments of the general population such as older adults, K-12 and child care workers, and those with high-risk medical conditions. However, there are concerns that these prioritization decisions and the existing mechanisms of the vaccine rollout—in addition to evidence that lower-income individuals, people of color, and individuals without strong connections to the health care system are less likely to get vaccinated—could worsen existing pandemic-related health inequities.
The available data have not assuaged these concerns, and show patterns of lower vaccination rates among people with lower incomes and levels of education, and marginalized racial and ethnic groups. The U.S. Census Bureau recently released updated data on take-up of COVID-19 vaccines from the most recent wave of its Household Pulse Survey (HPS), collected January 20-February 1, 2021.1 The HPS is an ongoing, weekly tracking survey designed to measure impacts of the COVID-19 pandemic. These data provide an updated snapshot of COVID-19 vaccination rates and are the only data source to do so at the state level by subpopulation. This blog post presents top-level findings from these new data, focusing on rates of vaccination (one or more doses) among U.S. adults (age 18 and older) living in households and comparing to results from the previous wave of the HPS, collected January 6-18.2
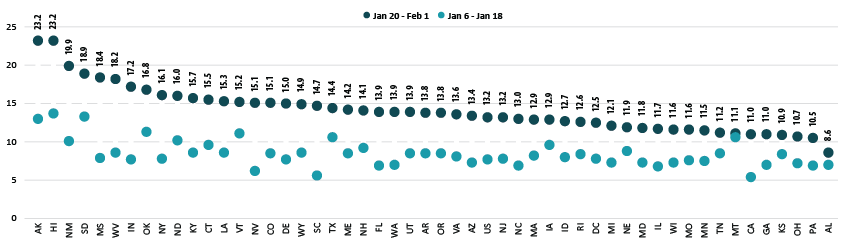
Roughly 13 percent of adults received a vaccination, but this varied by state
According to the new HPS data, 13.2% of U.S. adults had received one or more COVID-19 vaccinations during this two week period in January through February, though this varied by state from a low of 8.6% in Alabama to a high of 23.2% in Hawaii and Alaska. More than one in six adults had received a vaccine in eight states: Alaska, Hawaii, Indiana, Mississippi, New Mexico, Oklahoma, South Dakota, and West Virginia.
Vaccination rates increased substantially across nearly all states
Nationally, adult vaccination rates were up from the previous wave of the HPS, increasing from 7.7% in January 6-18 to 13.2% in January 20-February 1. Most states also experienced increases in their vaccination rates, though again the size of these increases varied across the states, from an increase of just 0.5 percentage points (PP) in Montana to an increase of 10.5 PP in Mississippi. Vaccination rates more than doubled in eight states: California, Florida, Indiana, Mississippi, Nevada, New York, South Carolina, and West Virginia.
Percent of Adults Who Had Received a COVID-19 Vaccine
Disparities in vaccination rates remain, though some have narrowed
COVID vaccination rates continued to vary to a great degree by demographic and socioeconomic factors, though disparities narrowed slightly from previous weeks.
This narrowing could be due to the expansion of priority groups to include a broader share of the population over this period; however, progress has remained limited in getting vaccines to certain groups such as low-income and Hispanic adults, for instance, and new vaccination strategies may be needed to reach the hardest-to-reach groups such as these.
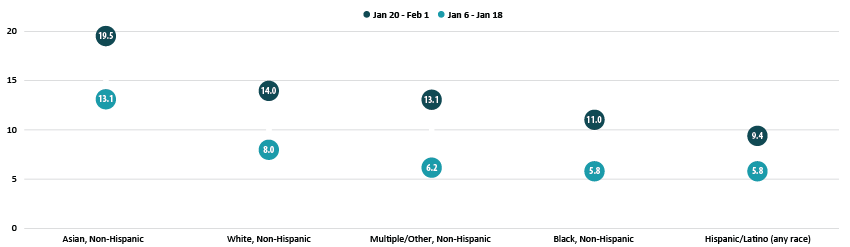
By race and ethnicity, non-Hispanic Asian and non-Hispanic White adults continued to have above-average vaccination rates at 19.5% and 14.0%, respectively. Vaccination rates among non-Hispanic adults identifying with multiple races or “some other” race increased relative to the average, rising to 13.1%, nearly in line with the national average of 13.2%. Rates among non-Hispanic Black adults (11.0%) and Hispanic/Latino adults of any race (9.4%) remained below the national average.
Percent of Adults Who Had Received a COVID-19 Vaccine by Race/Ethnicity
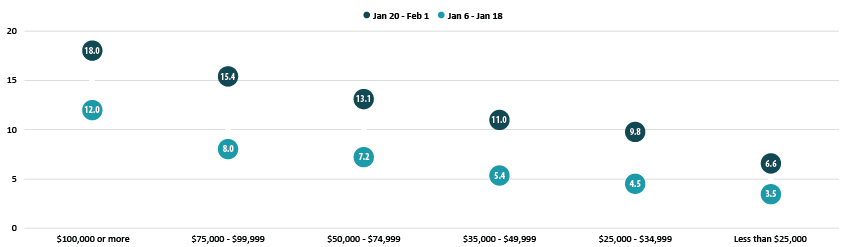
Disparities in vaccination rates by income narrowed somewhat, though those with the highest incomes continued to be much more likely to have received a vaccine compared with those with lower levels of income. Of adults with incomes of $100,000 or more, 18.0% had received a vaccination compared to just 6.6% of those with incomes less than $25,000. This pattern was broadly consistent across the states, and in nearly all states, adults with incomes of $100,000 or greater were more likely to have received a vaccine than the state overall.
Percent of Adults who Received a COVID-19 Vaccine by Income
Disparities by level of education did not appreciably narrow, with adults holding a bachelor’s degree or higher having the highest vaccination rate at 20.2% and adults without a high school diploma having the lowest vaccination rates at 6.2%. These rates remained stable in relation to the national average compared with earlier in the month, and similar disparities were common across nearly all states.
At least 1 in 5 older adults received a COVID vaccine as the U.S. and many states made large progress in vaccinating older adults
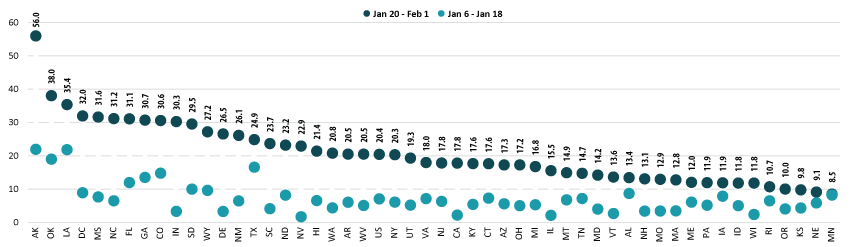
Nationally, 20.4% of older adults (age 65 and older) had received at least one dose of the COVID-19 vaccine, which was more than seven percentage-points higher than among all adults (13.2%). Vaccination rates for older adults range from 8.5% in Minnesota to 56.0% in Alaska. Older adult vaccination rates were below 10% in three states (Kansas, Nebraska, and Minnesota) and above 30% in nine states (Alaska, Colorado, Florida, Georgia, Indiana, Louisiana, Mississippi, North Carolina, and Oklahoma) and the District of Columbia (D.C.).
The U.S. and nearly all states made large progress in vaccinating older adults compared with earlier in the month when older adults were no more likely to have received a vaccine than adults overall. This change was likely a reflection of many states’ recent expansion of vaccine prioritization for the general older-adult population and is heartening, considering that older adults are more likely to develop severe COVID-19 cases or die from the disease as compared to the general population.
Most states saw large increases in rates of vaccination among older adults, though from a relatively low baseline. Compared to earlier in January, 43 states and D.C. more than doubled their 65+ vaccination rates, with 26 of those at least tripling their rates. Only Minnesota failed to make substantial progress, increasing its older-adult vaccination rate to just 8.5% from 8.2% earlier in January, an increase of less than a percentage point.
Percent of Adults Age 65+ Who Had Received a COVID-19 Vaccine
Notes about the Household Pulse Survey Data
The estimated rates presented in this post were calculated from the count estimates published by the Census Bureau. Though these counts are accompanied by standard errors, standard errors are not able to be accurately calculated for rate estimates. Therefore, we are not able to determine if the differences we found in our analysis are statistically significant or if the estimates themselves are statistically reliable. Estimates and differences should be assumed to have large confidence intervals around them—especially for subpopulations at the state level—and caution should be taken when drawing strong conclusions from this analysis. However, the fact that patterns of inequities in other vaccination rates are mirrored by these early indications of COVID-19 vaccination inequities demonstrates reason for concern.
Though produced by the U.S. Census Bureau, the HPS is considered an “experimental” survey and does not necessarily meet the Census’s high standards for data quality and statistical reliability. For example, the survey has relatively low response rates (7.5% for January 20-February 1), and sampled individuals are contacted via email and text message, asking them to complete an internet-based survey. These issues in particular could be potential sources of bias but come with the tradeoffs of increased speed and flexibility in data collection as well as lower costs. A future post will investigate differences between COVID vaccination rates estimated from survey data (such as the HPS) and administrative sources. The estimates presented in this post are based on responses from 80,567 adults. More information about the data and methods for the Household Pulse Survey can be found in a previous SHADAC blog post.
Related Reading
COVID-19 Vaccination Rates: New State-level and Subpopulation Evidence from the Household Pulse Survey (Jan 6 to Jan 18) (SHADAC Blog)
Anticipating COVID-19 Vaccination Challenges through Flu Vaccination Patterns (SHADAC Brief)
New Brief Examines Flu Vaccine Patterns as a Proxy for COVID – Anticipating and Addressing Coronavirus Vaccination Campaign Challenges at the National and State Level (SHADAC Blog)
Ensuring Equity: State Strategies for Monitoring COVID-19 Vaccination Rates by Race and Other Priority Populations (Expert Perspective for State Health & Value Strategies)
SHADAC Webinar - Anticipating COVID-19 Vaccination Challenges through Flu Vaccination Patterns (February 4th) (SHADAC Webinar)
Blog & News

Two New Changes to the Child Vaccinations Measure on SHADAC’s State Health Compare
December 10, 2020: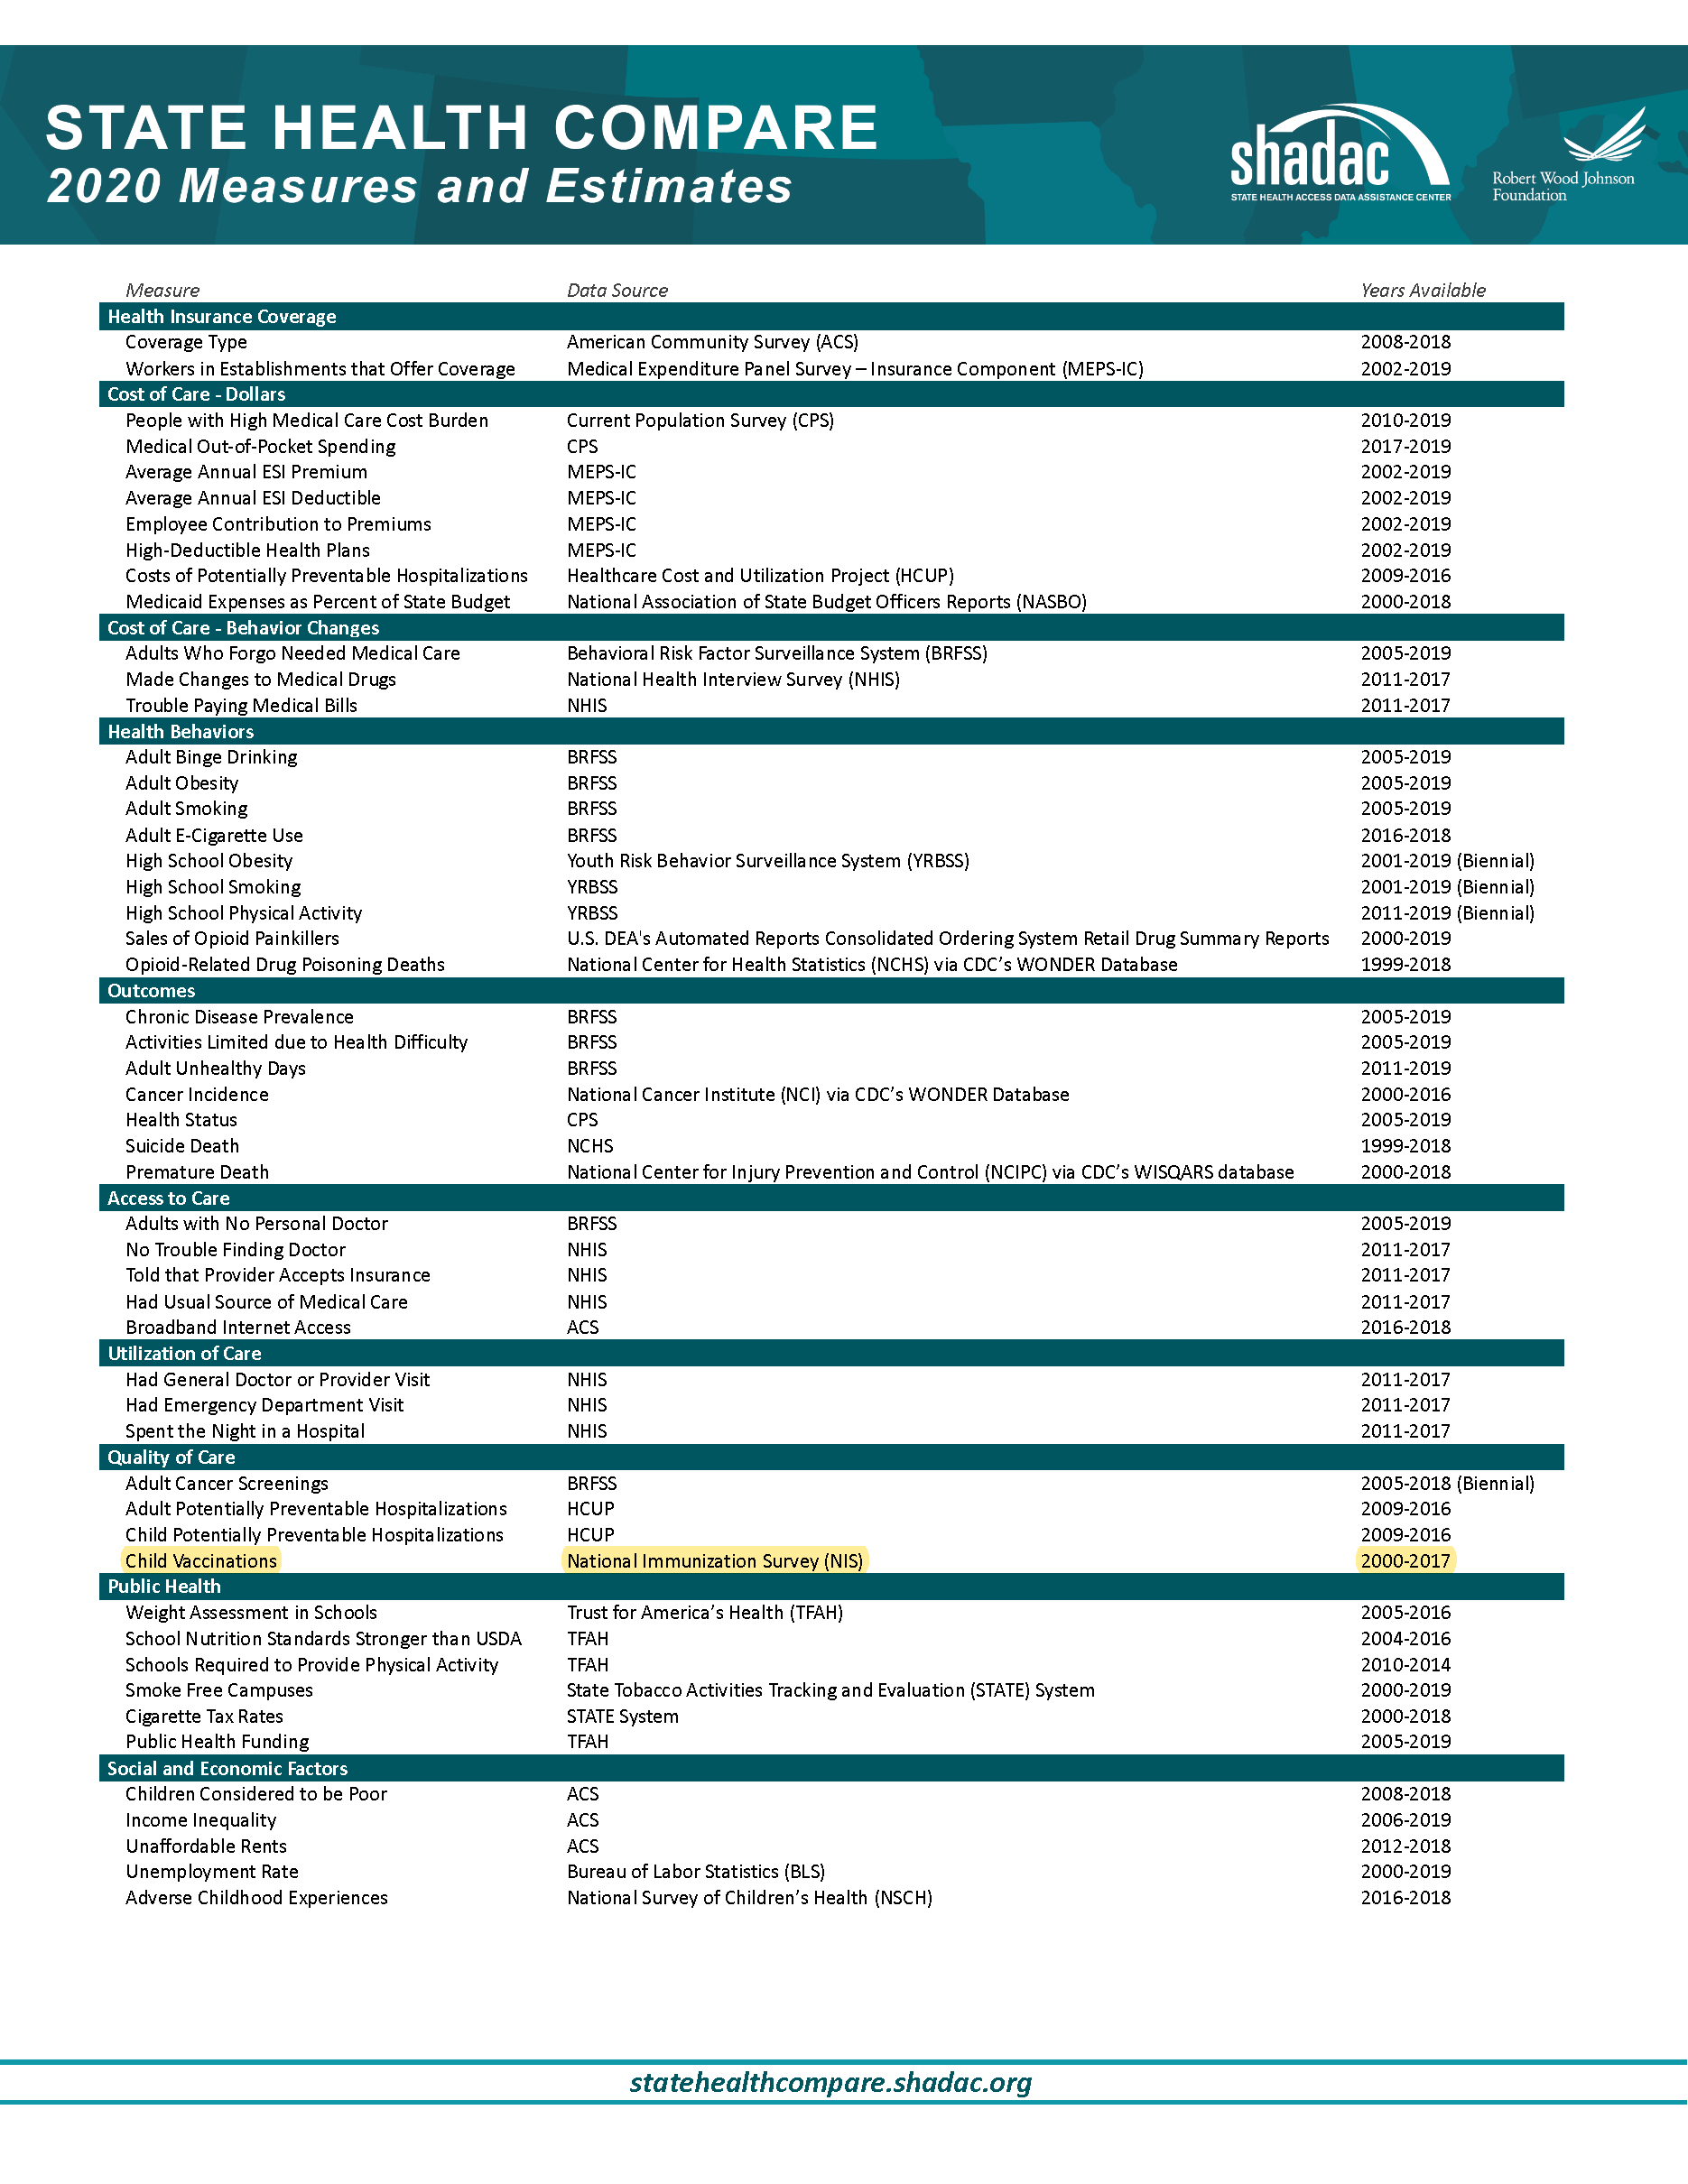 SHADAC is making two modifications to its State Health Compare (SHC) Child Vaccinations measure in response to changes in how the data source for this measure (the National Immunization Survey-Child [NIS]) reports estimates. The NIS recently transitioned to reporting estimates by child birth year (e.g., the percent of children born in 2015 who had received the recommended vaccines). Previously, the estimates had been reported by survey year (e.g., the percent of children surveyed in 2015 who received the recommended vaccines). Announcement of this change was included in a recent CDC Morbidity and Mortality Weekly Report where the authors noted that “the transition to reporting by birth year rather than by survey year more directly assesses recent changes in vaccination coverage and provides more interpretable estimates and more accurate comparisons to evaluate immunization information systems.”[1]
As a consequence, SHADAC is now reporting its Child Vaccinations measure by child birth year (from 2011-2016) rather than by survey year. SHADAC has also altered the measure definition to be the “percent of children age 24 months who had received all recommended vaccines,” changed from the “percent of children age 19-35 months who had received all recommended vaccines.” This change is consistent with the new way these estimates are reported from the NIS, and with the Centers for Disease Control’s (CDC) recommended vaccine schedule. Previous estimates from survey years 2000-2017 will no longer be available on State Health Compare but continue to be available through CDC’s ChildVaxView and from SHADAC upon request.
As before, Child Vaccinations measures the rate of receipt of recommended vaccinations, which is defined as getting the recommended doses of the 7-vaccine series.[2] The CDC’s child and adolescent vaccination schedule recommends children to have received these vaccines by the age of 18 months. SHC’s Child Vaccinations measure reports the rate of receipt at 24 months of age.
Visit SHADAC's State Health Compare to further explore the new Child Vaccinations measure.
[1] Hill, H.A., Singleton, J.A., Yankey, D., Elam-Evans, L.D., Pingali, S.C., & Kang, Y. Vaccination coverage by age 24 months among children born in 2015 and 2016—National Immunization Survey-Child, United States, 2016-2018. MMWR, 68(41), 913-918.
[2] The combined 7-vaccine series consists of 4 or more doses of either the diphtheria, tetanus toxoids, and pertussis vaccine (DTP), the diphtheria and tetanus toxoids vaccine (DT), or the diphtheria, tetanus toxoids, and acellular pertussis vaccine (DTaP); 3 or more doses of any poliovirus vaccine; 1 or more doses of a measles containing vaccine (MCV); 3 or more doses or 4 or more doses of Haemophilus influenzae type b vaccine (Hib) depending on Hib vaccine product type (full series Hib); 3 or more doses of hepatitis B vaccine; 1 or more doses of varicella vaccine; and 4 or more doses of pneumococcal conjugate vaccine (PCV).
Blog & News
November 10th Webinar - "Overdose Crisis in Transition: Changing Trends in a Widening Drug Death Epidemic"
November 24, 2020:Mr. Planalp was joined by SHADAC Research Fellow Robert Hest, who explained how to access and use the data on opioid-related overdose deaths and sales of opioid painkillers through SHADAC’s State Health Compare website. Slides from the presentation, as well as a list of further SHADAC resources regarding the opioid crisis can be found at the bottom of this page.
Speakers
 Colin Planalp, MPA
SHADAC Senior Research Fellow
 Robert Hest, MPP
SHADAC Research Fellow
Event Resources
The Opioid Epidemic (SHADAC Resource Page)
Overdose Crisis in Transition: Changing National and State Trends in a Widening Drug Death Epidemic (Briefs)
50-State Analysis of Drug Overdose Trends: The Evolving Opioid Crisis Across the States (Infographics)
After drop in 2018, newer data indicate a resurgence in drug overdose deaths
Blog & News
October 21st Webinar - Rising Suicide Rates: Examining Trends and Variations through State-level Data
October 26, 2020:
Over the past two decades, the rise in suicide death rates has continued along an accelerating climb. According to new vital statistics data from the Centers for Disease Control and Prevention (CDC), the United States suicide rate reached another historic high of 14.2 per 100,000 people in 2018, up from 14.0 in the previous year.
This increase in suicide deaths has not followed a consistent trend; rather, growth has accelerated more recently. From 2000 to 2009 the suicide death rate grew by 13 percent, but from 2009 to 2018 the rate grew by 21 percent. While these trends predate the COVID-19 pandemic, early evidence has indicated this crisis is taking a significant toll on mental health, and these data therefore represent an important baseline from which the effects of the pandemic will be measured.
During the webinar, SHADAC Research Fellow Carrie Au-Yeung used national and state-level data on suicide deaths to examine this growing public health issue, highlighting concerning trends and variations in suicide deaths by geographic locations such as regions, states, and metropolitan areas, as well as by specific subpopulation groups such as age, sex, and race/ethnicity.
Ms. Au-Yeung was also joined by SHADAC Research Fellow Robert Hest, who explained how to access and use the data on suicide deaths through SHADAC’s State Health Compare website. Senior Research Fellow Colin Planalp also joined the webinar for a question and discussion session following the presentation.
 Related Resources
Suicide Rates on the Rise: Examining Continuing Trends and Variation across the Nation and in the States from 2000 to 2018 (Briefs)
U.S. Suicide Death Rate Reached Record High in 2018: SHADAC Briefs Examine the Numbers among Subgroups and States
State Health Compare Data Offer Baseline for Measuring Pandemic's Impact on Suicide, Drug Overdose Death Rates
National Suicide Prevention Lifeline: 1-800-273-8255
If you’re thinking about suicide, are worried about a friend or loved one, or would like emotional support, the Lifeline network is available 24/7 across the United States. For more suicide prevention resources, visit https://suicidepreventionlifeline.org/

