
Blog & News
Elliot Walsh
Lukanen, Elizabeth


AHIP Presentation 2024: Improving Health Equity Through Better Demographic Data Collection in Medicaid
April 01, 2024:On March 12, 2024, SHADAC Deputy Director Elizabeth Lukanen presented at the AHIP Medicare, Medicaid, Duals & Commercial Markets Forum as a part of the “Improving Health Equity Through Better Data Collection” session series. Elizabeth's presentation focused specifically on demographic data collection in Medicaid.
The conference itself focused on the pressing policy priorities, emerging issues, and regulatory updates for Medicare, Medicaid, Duals, and the commercial market. Topics ranged from panel discussions on filling the gaps in the behavioral health care workforce to presentations on advancing Medicaid Long-Term Services and Supports (LTSS) to the latest information on best practices to collect sexual orientation and gender identity (SOGI) data.
During her session series, Elizabeth shared the stage with other amazing names in public health, including Samantha Artiga, Director for Racial Equity and Health Policy Program at KFF, and Dr. Alex S. Keuroghlian, Associate Professor of Psychiatry at Harvard Medical School and Director of Education & Training at Fenway Health. The session was moderated by Dr. LaShawn McIver, Senior Vice President & Chief Health Equity Officer at AHIP.
Elizabeth’s presentation centered around how better demographic data collection in Medicaid could work towards advancing health equity. She starts by reviewing reasons why data for certain demographics may be of poor quality or missing altogether. She then goes on to discuss issues with demographic data collection for certain populations, like minority racial/ethnic groups, LGBTQ+ individuals, and those with disabilities, and how that can lead to not only data gaps, but also to overall care and access inequities.
Highlighting three states’ equity initiatives, Elizabeth explores how we might work towards improving data collection and utilizing that data to understand inequities and differences between populations served by Medicaid.
“Good data starts with trust,” Lukanen says. If we want to improve demographic data collection, “[we need to] make demographic data collection a priority.”
Make it a priority today – start by reading through the full presentation here or by clicking the image below.
You can also learn more about data collection and advancing health equity with some of the following SHADAC resources:
- Health Equity Measurement: Considerations for Selecting a Benchmark (SHVS Brief)
Blog & News

Research Assistant
Unemployment Rate Trends of the Past 5 Years: Pre-, Mid-, and Post-Pandemic
April 01, 2024:In early 2020, the COVID-19 pandemic ended the United States’ decade-long era of economic expansion. Many businesses across industries halted or closed operations, resulting in record-high temporary and permanent job losses – events that have been reflected in unemployment rate trends.
Primarily, unemployment affects people’s economic stability and well-being, but it goes beyond that. Unemployment affects individuals’ access to stable housing, food security, and health insurance coverage and care. Unemployment has also been linked to negative health consequences, with unemployed individuals often reporting feelings of depression and anxiety, and suffering from stress-related illness such as high blood pressure, stroke, heart attack, heart disease, and arthritis more often compared to employed counterparts
Knowing that unemployment affects health and health care access, we wanted to understand how such a seismic event as the pandemic affected unemployment rates. We also wanted to determine what progress has been made in recovery post-pandemic. To do this, SHADAC used our State Health Compare tool’s unemployment measure, looking at data pre- (2018-2019), mid- (2020), and post-pandemic (2021-2022). Keep reading to learn more about our process and key findings.
Unemployment Rate Trends: Overall Rate Rose Sharply During Pandemic
Before the pandemic began, the United States was experiencing what the Bureau of Labor Statistics (BLS) called, “the second longest [period of] economic expansion on record,” with the unemployment rate reaching a 49-year low. Overall, the pre-pandemic national unemployment rates in 2018 and 2019 were 3.9% and 3.7%, respectively. In 2020, what we have termed as during / mid-pandemic, the unemployment rate rose sharply to 8.1%. As time went on, though, unemployment rates began to noticeably decrease, measuring at 5.3% in 2021 and dipping below 2019’s low to 3.6% in 2022.
It is no surprise that national unemployment was at its highest mid-pandemic in 2020 as a result of business closures (both temporary and permanent). However, some heartening news comes from the 2022 data showing a national unemployment rate sitting the lowest it had been in the past five years, and several other key labor market measures also returning to their pre-pandemic levels.
While encouraging, when looking at unemployment rates pre-, mid-, and post-pandemic, it is worthwhile to go beyond the seemingly straightforward, positive picture at the national level in order to understand how different geographic and demographic populations varied in unemployment rates. For our analysis, we looked at unemployment rate by state and by race/ethnicity.
Examining Unemployment Rate Trends by State
The following tables show the five states with the lowest and the highest unemployment rates each year from 2018 to 2022.
| Lowest | |||||||||
|---|---|---|---|---|---|---|---|---|---|
| 2018 | 2019 | 2020 | 2021 | 2022 | |||||
| Hawaii | 2.4% | North Dakota | 2.4% | Nebraska | 4.2% | Nebraska | 2.5% | North Dakota | 2.1% |
| Iowa | 2.5% | Vermont | 2.4% | South Dakota | 4.6% | Utah | 2.7% | South Dakota | 2.1% |
| New Hampshire | 2.5% | New Hampshire | 2.5% | Utah | 4.7% | South Dakota | 3.1% | Nebraska | 2.3% |
| North Dakota | 2.6% | Utah | 2.6% | North Dakota | 5.1% | Kansas | 3.2% | Utah | 2.3% |
| Vermont | 2.7% | Hawaii | 2.7% | Iowa | 5.3% | Alabama | 3.4% | Missouri | 2.5% |
| Highest | |||||||||
|---|---|---|---|---|---|---|---|---|---|
| 2018 | 2019 | 2020 | 2021 | 2022 | |||||
| Louisiana | 4.9% | New Mexico | 4.9% | Michigan | 9.9% | Dist. of Columbia | 6.6% | Pennsylvania | 4.4% |
| New Mexico | 4.9% | West Virginia | 4.9% | New York | 10.0% | New Mexico | 6.8% | Delaware | 4.5% |
| West Virginia | 5.3% | Mississippi | 5.4% | California | 10.1% | New York | 6.9% | Illinois | 4.6% |
| Dist. of Columbia | 5.6% | Dist. of Columbia | 5.5% | Hawaii | 11.6% | Nevada | 7.2% | Dist. of Columbia | 4.7% |
| Alaska | 6.6% | Alaska | 6.1% | Nevada | 12.8% | California | 7.3% | Nevada | 5.4% |
Certain unemployment rate trends have remained consistent in the last two years of the post-pandemic period, which could shed light on individual states’ economic recovery post-pandemic. For example, Nebraska and South Dakota have been among the five states with the lowest unemployment rates mid- & post-pandemic, suggesting less economic fallout from the pandemic. On the other hand, Nevada has ranked in the five states with the highest unemployment rates post-pandemic (2021 and 2022), suggesting perhaps a slower economic recovery due to COVID-19.
Case Study of Nevada: Misleading Overall Data
While a state’s overall unemployment rate may tell one story, a further breakdown into individual racial/ethnic subgroups may tell another, as we can see with Nevada.
Nevada’s total unemployment rate for 2021 was 7.2%, which was among the five states with the highest rate of unemployment for that year. However, the 2021 unemployment rate for White individuals in Nevada measured at 6.6% – lower than the overall state-level rate. In stark contrast, the 2021 unemployment rate for African American/Black individuals in Nevada measured at 15.3% – more than double the rates of White individuals in Nevada and the state’s overall unemployment rate.
Examining Unemployment Rate Trends by Race/Ethnicity
As observed in Nevada, a breakdown of unemployment rates by race/ethnicity gives insight to the disparities experienced by certain racial/ethnic subgroups. African American/Black, Hispanic, and Native American* individuals were more likely to suffer job loss compared to White workers during the pandemic. Adverse health outcomes and difficulty accessing healthcare are associated with longer periods of unemployment, which Black, Hispanic, and Native American workers endured more than White workers. Thus, it is important to consider the breakdown of race/ethnicity in relation to unemployment, especially when analyzing mid- and post-pandemic data.
While population-level unemployment rates may seem relatively low post-pandemic, a breakdown by race/ethnicity can reveal inequities and more detailed information regarding unemployment in the United States. The following chart shows the year-by-year total breakdown of unemployment by race/ethnicity, as well as the national rate for reference.
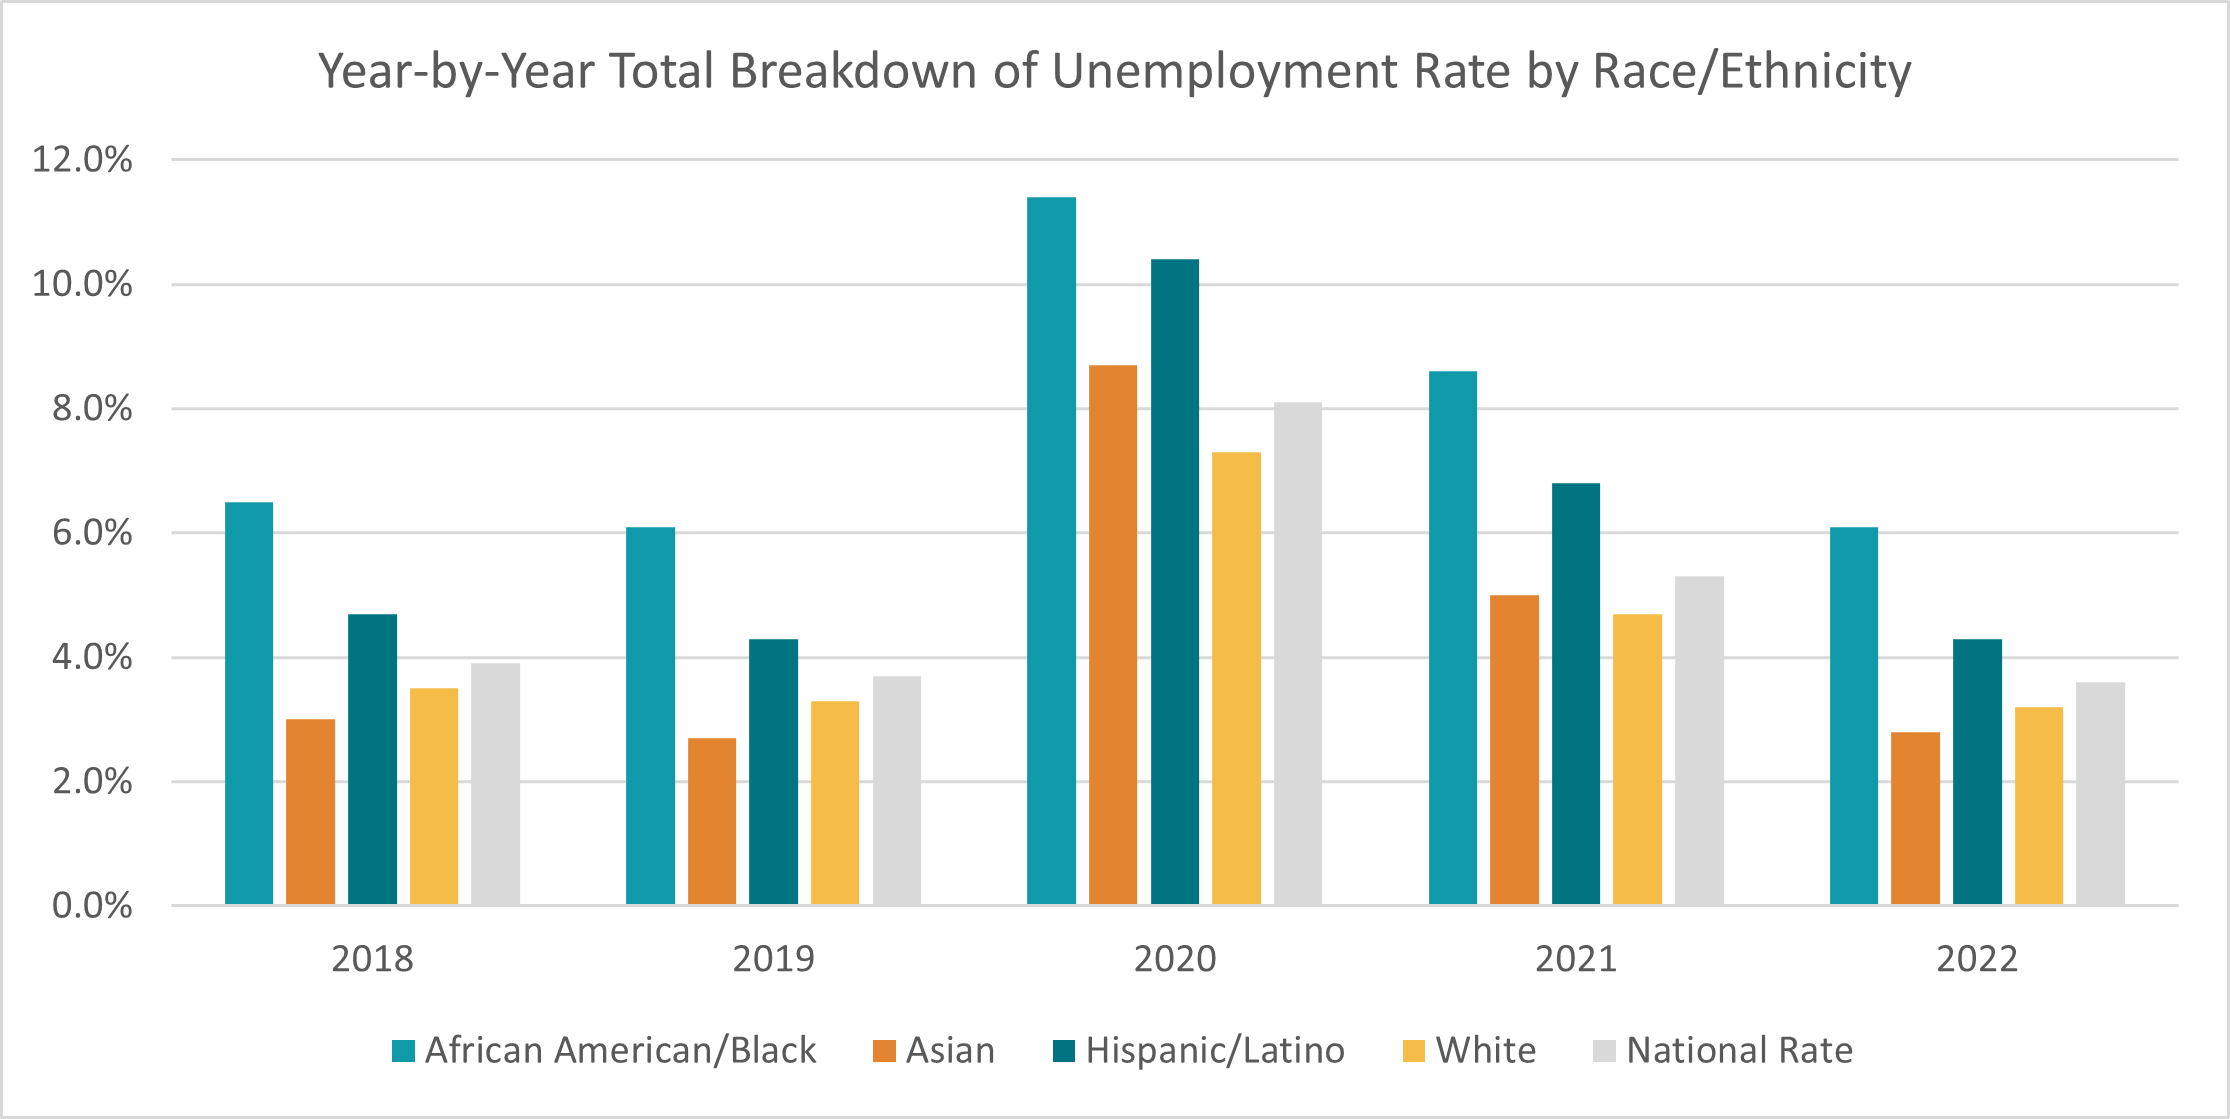
All four racial/ethnic groups follow the nationally observed unemployment trend: mid-pandemic (2020) rates are the highest, and, by 2022, unemployment had returned to pre-pandemic (2018 and 2019) levels.
However, deeper analyses of these five-year trends reveal disparities for certain racial/ethnic subgroups. For example, White individuals are the only racial/ethnic group to have their lowest national unemployment rate in the last five years be post-pandemic (3.2% in 2022). Compare that to African American/Black adults and Hispanic/Latino adults who, in the same year of 2022, have had higher unemployment rates (6.1% and 4.3%, respectively) than the national U.S. rate (3.6%). White and Asian adults have had lower unemployment than the U.S. rate for the last five years, except in 2020 where the unemployment rate for Asian adults was 8.7% compared to the U.S. rate of 8.1%.
Conclusion
Due to the implications that unemployment has on health and health care, it is important to consider the disparities in rates among different racial/ethnic groups. Even in states where unemployment may seem to be trending down, this rate could be misleading when not accounting for race/ethnicity.
Overall, national unemployment has returned to pre-pandemic rates, and the same trend has been observed across racial/ethnic groups. However, unemployment rates for African American/Black and Hispanic/Latino individuals are still consistently higher than the U.S. rate, revealing the need for targeted attention toward addressing unemployment rates for these populations.
To learn more about this and other related subjects, check out the following products on our site:
- Six Measures on SHADAC’s State Health Compare Now Updated to Include Pandemic-era Data for Health Behaviors and Outcomes
- Revised Childhood Vaccinations Measure on State Health Compare Shows Vaccination Rates Vary by State, Race/Ethnicity, and Insurance Coverage
- The Opioid Crisis in the Pandemic Era
You can also explore these and many other data measures with our State Health Compare tool here.
*State Health Compare does not currently have available data for Native American individuals, due to low response rate. However, SHADAC is hopeful this data gap will be addressed in the future in order to conduct equitable analyses.
Publication
Sexual Orientation and Gender Identity Data: New and Updated Information on Federal Guidance and Medicaid Data Collection Practices (SHVS Brief)
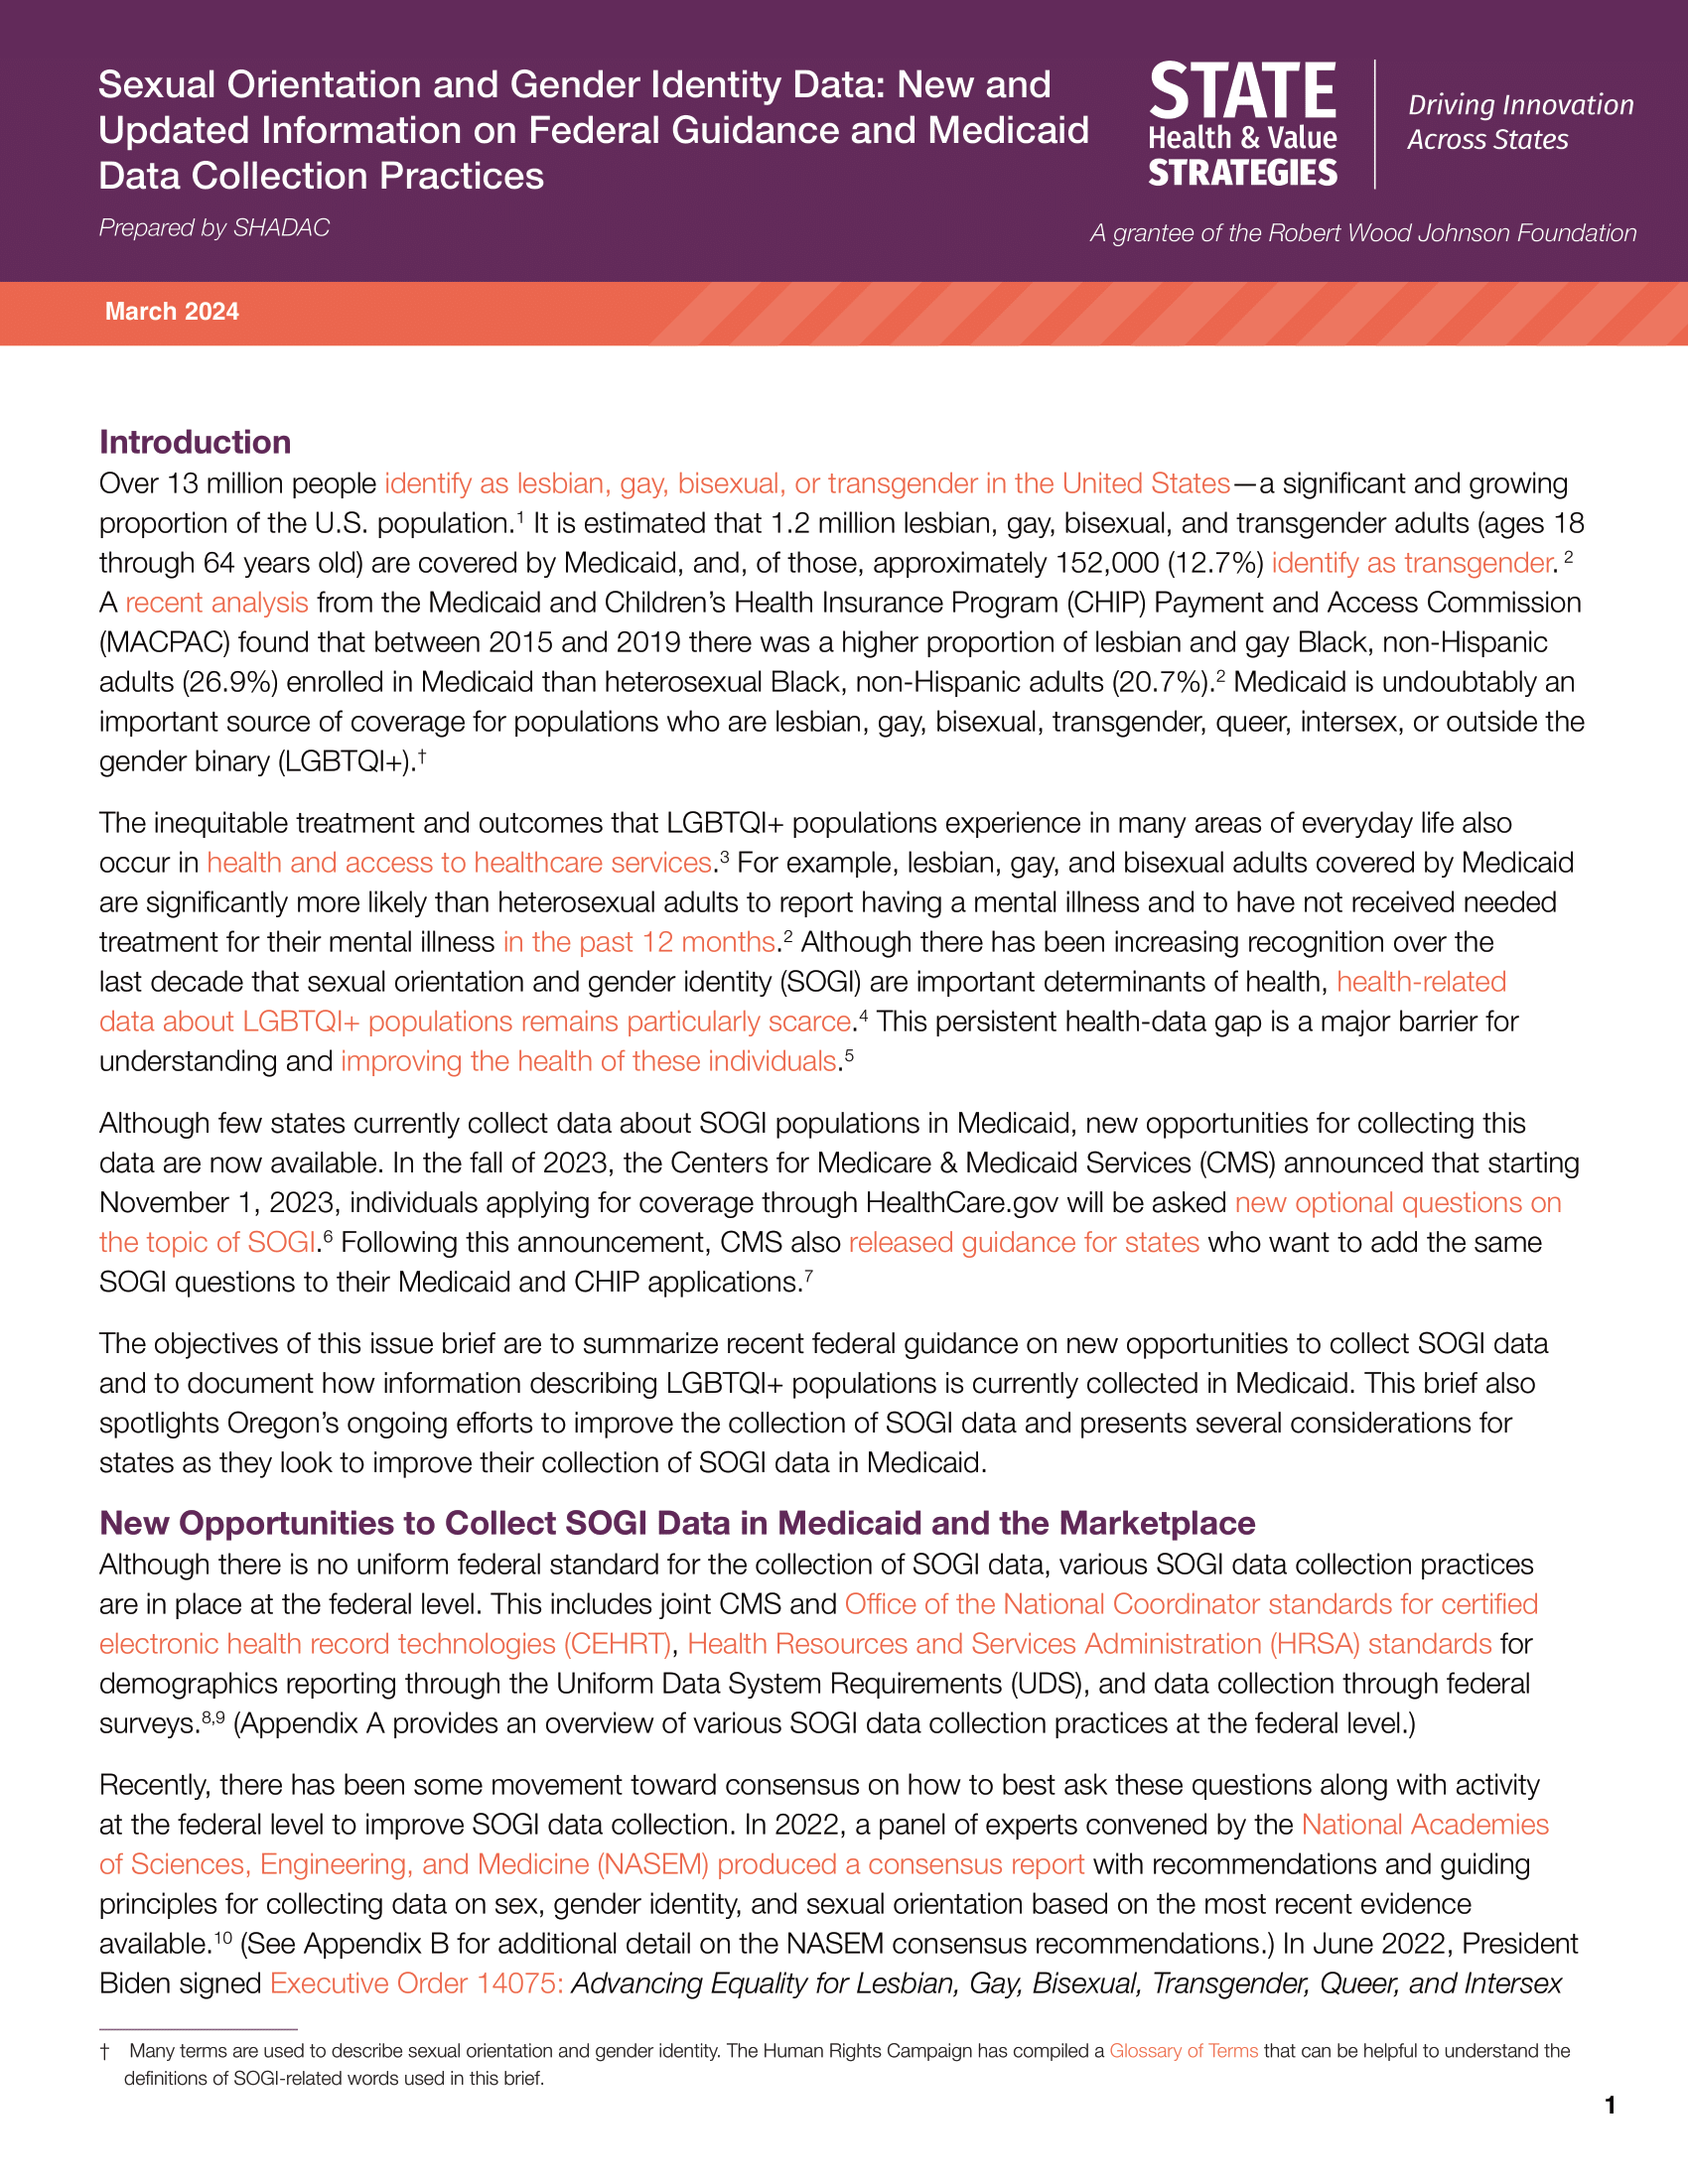
In the United States, over 13 million people identify as lesbian, gay, bisexual, or transgender (LGBT).1 Further, approximately 1.2 million LGBT adults (ages 18 - 64) are covered by Medicaid, and, of those, it is estimated that 152,000 (12.7%) identify as transgender.2
- a summary of the current landscape of SOGI data collection in Medicaid through an examination of all 50 states’ and Washington, D.C.’s paper Medicaid applications along with 44 states’ online Medicaid applications
- a spotlight on Oregon’s efforts to develop SOGI data standards
- a discussion of considerations for states wanting to implement these new SOGI questions into their Medicaid application(s)
Read the brief in full here.
About the SHVS:
[1] The Williams Institute at UCLA School of Law. (2019, December 16). LGBT FAQs - Williams Institute. Williams Institute. https://williamsinstitute.law.ucla.edu/quick-facts/lgbt-faqs/
[2] Medicaid and CHIP Payment Access Commission (MACPAC). (June 2022). Access in Brief: Experiences of Lesbian, Gay, Bisexual, and Transgender Medicaid Beneficiaries with Accessing Medical and Behavioral Health Care. https://www.macpac.gov/wp-content/uploads/2022/06/Access-in-Brief-Experiences-in-Lesbian-Gay-Bisexual-and-Transgender-Medicaid-Beneficiaries-with-Accessing-Medical-and-Behavioral-Health-Care.pdf
[3] Bosworth, A., Turrini, G., Pyda, S., Strickland, K., Chappel, A., De Lew, N., Sommers, B.D.. (June 2021). Health Insurance Coverage and Access to Care for LGBTQ+ Individuals: Current Trends and Key Challenges. https://aspe.hhs.gov/sites/default/files/2021-07/lgbt-health-ib.pdf
[4] U.S. Government. Executive Office of the President. “Advancing Equality for Lesbian, Gay, Bisexual, Transgender, Queer, and Intersex Individuals”. 87 Fed Reg 37,189-37,195. (June 22, 2022). https://www.govinfo.gov/app/details/FR-2022-06-21/2022-13391
[5] Centers for Medicare & Medicaid Services (2023). New Sexual Orientation and Gender Identity (SOGI) Questions on the Marketplace Application. https://www.cms.gov/files/document/sogi-questions-marketplace-application.pdf
[6] Center for Medicaid and CHIP Services (November 9, 2023). Guidance on Adding Sexual Orientation and Gender Identity Questions to State Medicaid and CHIP Applications for Health Coverage. https://www.medicaid.gov/sites/default/files/2023-11/cib11092023.pdfPublication
State Medicaid Member Experience Qualitative Data Scan
As part of the ongoing work in Phase 2 of the Medicaid Equity Monitoring Tool project, SHADAC researchers have been working to understand what available data sources and measures currently exist that could be useful in populating a potential Medicaid Equity Monitoring Tool.
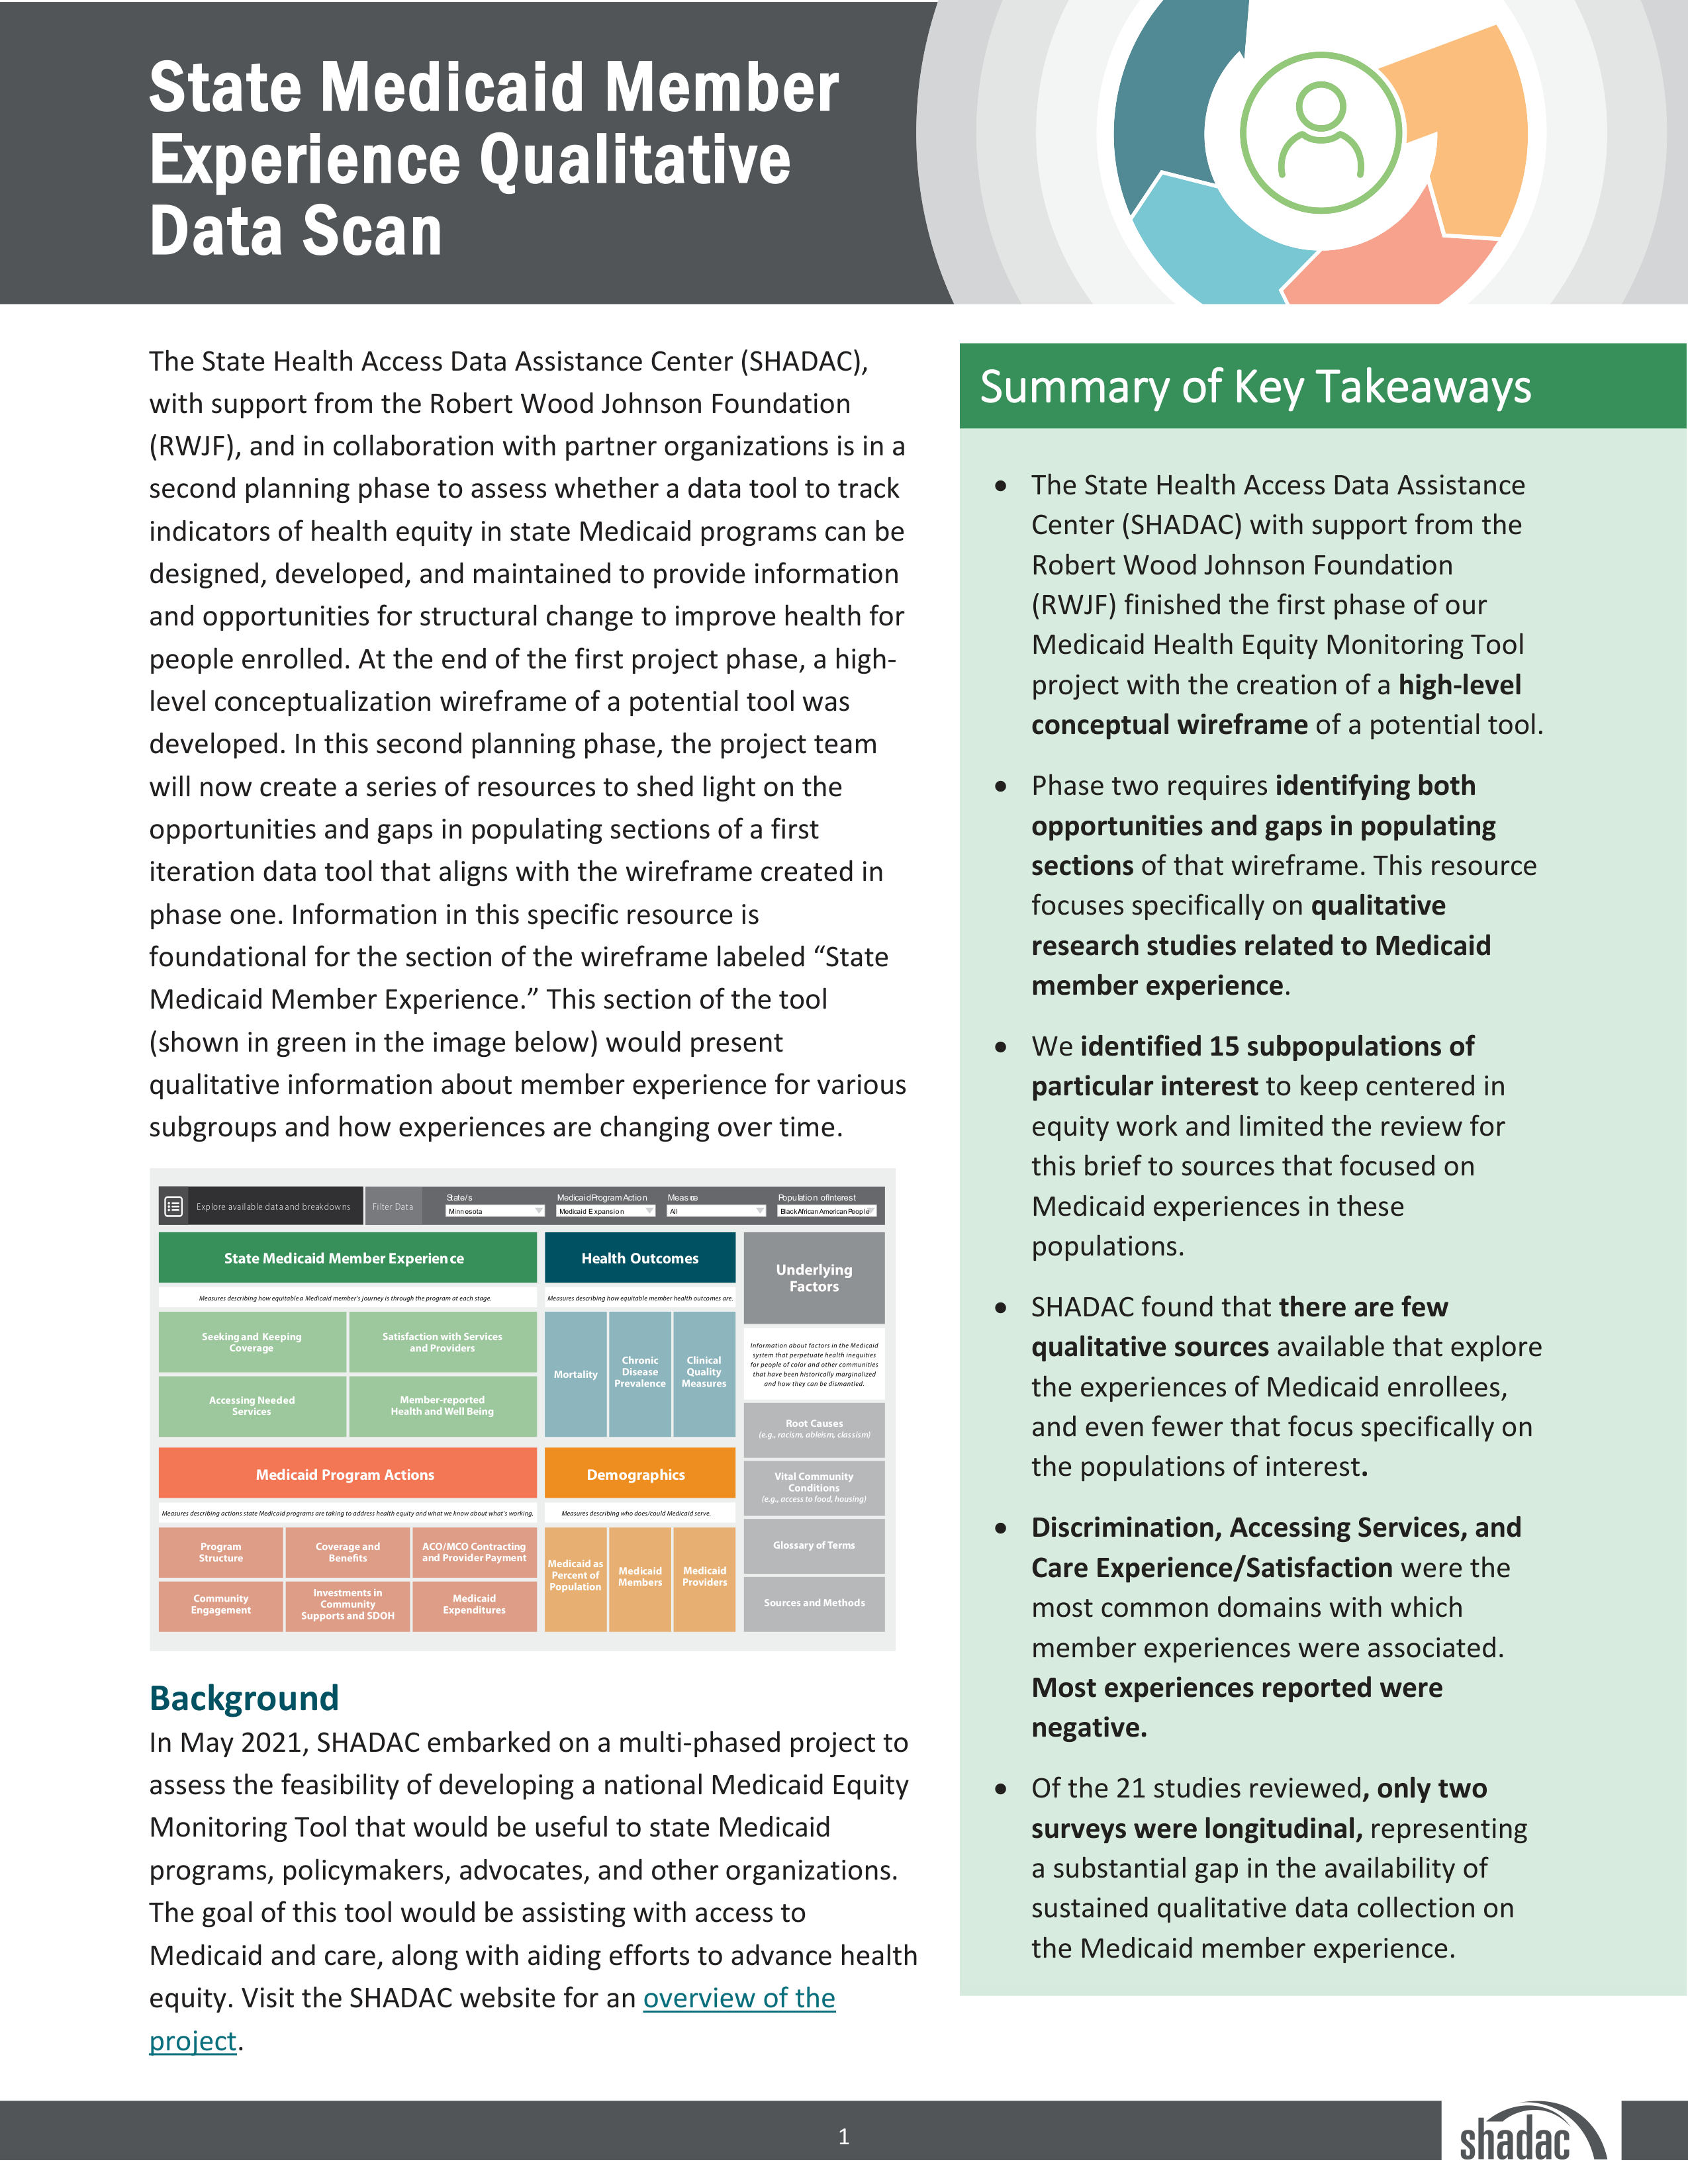
In Phase 1, the project team conceptualized a high-level wireframe, displaying what such a tool could look like, and how measures could be included and categorized. Currently, five general categories have been proposed - State Medicaid Member Experience, Health Outcomes, Medicaid Program Actions, Demographics, and Underlying Factors - further stratified into various domains, under which individual measures could be housed.
In the case of State Medicaid Member Experience, the category of focus for SHADAC’s initial data scan, four domains have been proposed:
- Accessing Needed Services
- Member-Reported Health and Well Being
- Satisfaction with Services and Providers
- Seeking and Keeping Coverage
In starting the initial data scan process, SHADAC has already faced a number of critical decision points – first and foremost, where to begin.
With five main categories and a multiplicity of potential domains under each, there were numerous points of entry into a process we hoped would help to gain a better understanding of the potential measures currently available (as well as a process to identity gaps in such data collection) to populate a tool.
After deciding to start with the Medicaid Member Experience category, a secondary decision split the data scan process into two parts, quantitative and qualitative.1 A resource documenting the quantitative data scan's process, findings, and further recommendations was published in January 2024. This new resource examines the qualitative aspects of Member Experience through identification of related research studies.
Top-level findings reveal that there are few sources documenting qualitative data collection methods regarding the experiences of Medicaid enrollees – our scan found just 21 – even fewer that focus specifically on our project’s 15 identified subpopulations of interest, and even fewer studies conducted over extended periods of time (2).
In addition to a summation of the scan results, the resource also contains an appendix table that crosswalks each source to all relevant measurement domains (e.g., Accessing Needed Services, Member-reported Health and Well Being, Satisfaction with Services and Providers, Seeking and Keeping Coverage, and Discrimination), provides relevant quotes from either Medicaid members themselves or their representatives, and includes population demographics such as race/ethnicity, disability status, and geographic location, among others.
Click on the image above to access the full report, or access it at this link.
[1] For more on the decision-making process regarding the initial data scan, please see the State Medicaid Member Experience Quantitative Data Scan page.
Blog & News

New Data on Health Insurance Coverage by Race/Ethnicity Added to State Health Compare
February 13, 2024:State Health Access Data Assistance Center (SHADAC) has added two new racial/ethnic population groups to our measures of health insurance coverage available on State Health Compare.
Using micro-data from the American Community Survey (ACS), we were able to add health insurance coverage measures for American Indian/Alaska Native (AIAN) and Native Hawaiian Pacific Islander (NHPI) populations. Specifically, SHADAC has added insurance coverage data for AIAN and NHPI populations at both the national and state level (when sample size permits) from the years 2008-2022. Estimates for these groups are also available by age and poverty status.
This update now allows users to download estimates of insurance coverage for all of the minimum race categories for data collection outlined by the Office of Management and Budget (OMB), which are: American Indian or Alaska Native (AIAN), Asian, Black or African American, Native Hawaiian or Other Pacific Islander (NHPI), and White.
| Uninsured adults (19-64) in the US, 2021-2022 | ||||||
|---|---|---|---|---|---|---|
| Race/ethnicity | Age | 2021 | 2022 | Difference | * | |
| AIAN | 19-64 | 24.5% | 22.2% | -2.4 | * | |
| African-American / Black | 19-64 | 13.4% | 12.1% | -1.3 | * | |
| Asian | 19-64 | 7.2% | 6.7% | -0.5 | * | |
| Hispanic / Latino | 19-64 | 24.4% | 22.8% | -1.5 | * | |
| NHPI | 19-64 | 12.1% | 13.6% | 1.5 | ||
| Other / Multiple Races | 19-64 | 11.2% | 10.5% | -0.7 | * | |
| White | 19-64 | 8.2% | 7.4% | -0.7 | * | |
| All | 19-64 | 12.0% | 11.2% | -0.9 | * | |
| * Significant difference between years. Source: SHADAC analysis of the 2021-2022 American Community Survey. |
||||||
In this analysis, we used this newly available data from State Health Compare to examine differences in uninsurance from 2021 to 2022 by race/ethnicity for adults ages 19-64. Over this period, the overall uninsured rate for non-elderly adults dropped nearly a percentage point, reaching 11.2%. The largest drop in uninsurance was seen among AIAN adults, lowering by 2.4 percentage points. Hispanic and Black adults also saw improvements in coverage of greater than one percentage point (1.5 and 1.3 percentage points, respectively). More modest gains in coverage were reported by adults who were White, Asian, and Other/Multiple races.
Significant decreases were seen consistently across populations by race/ethnicity except for the NHPI adult population, which did not see this same decrease in uninsurance. While estimates were limited by sample size and changes were not significant, uninsurance rates for this group increased from 12.1% to 13.6%. These concerning rates of uninsured NHPI adults contrasted with the overall trend of decreased uninsurance rates and thus warrant further observation.
While encouraging to see a trend of decreasing uninsurance amongst non-elderly adults, disparities in insurance coverage between racial/ethnic groups are persistent. For example, in 2022, more than one in five adults were uninsured among both the Hispanic/Latino and AIAN populations. Uninsurance was also high for NHPI and Black adults, at 13.6% and 12.1%, respectively. The substantial differences in coverage between racial/ethnic populations illustrate the ongoing priority of improving health equity, including health care access. We plan to continue monitoring insurance coverage in light of ongoing post-pandemic policy changes. Providing more granular estimates by race/ethnicity will support efforts to understand and reduce disparities in health care access.

