
Blog & News
Blewett, Lynn A.
Natalie Mac Arthur


SHADAC Researchers Co-Author Maternal and Child Health Journal Article on Medical Home Contributions to Child Health Outcomes
December 9, 2022:
SHADAC researchers Natalie Mac Arthur and Lynn Blewett recently published a journal article in Maternal and Child Health Journal that examines the medical home model—a widely accepted model of team-based primary care—and its unique contributions to child health outcomes.
Their analysis drew on data from the 2016-2017 National Survey of Children’s Health (NSCH) to assess five key medical home components–usual source of care, personal doctor/nurse, family-centered care, referral access, and coordinated care–and their associations with child outcomes. Health outcomes included emergency department (ED) visits, unmet health care needs, preventive medical visits, preventive dental visits, health status, and oral health status.
Key Findings
- Results showed that children who were not white, living in non-English households, with less family income or education, or who were uninsured had lower rates of access to a medical home and its components.
- A medical home was associated with beneficial child outcomes for all six of the outcomes and the family-centered care component was associated with better results in five outcomes.
- ED visits were less likely for children who received care coordination.
These findings highlight the role of key components of the medical home model and the importance of access to family-centered health care that provides needed coordination for children of all backgrounds. Health care reforms should consider disparities in access to a medical home and specific components and the contributions of each component to provide quality primary care for all children. Understanding the role of medical home components contributes to the refinement of the model and can inform health care policy efforts to improve health equity for all children.
Read the full article in the Maternal and Child Health journal.
Blog & News

SHADAC in AJPH: Insurance-Based Discrimination Reports and Access to Care Among Non-Elderly U.S. Adults, 2011-2019
December 8, 2022:This journal article was originally published in the American Journal of Public Health (AJPH).
Authors: Kathleen Thiede Call, PhD, Giovann Alarcon-Espinoza, PhD, MPP, Natalie Schwer Mac Arthur, PhD, MAc, and Rhonda Jones-Webb, DrPH
 SHADAC researchers and external co-authors recently published an article in the American Journal of Public Health (AJPH) that examines rates of insurance-based discrimination for nonelderly adults with private, public, or no insurance between 2011 and 2019, a period marked by passage and implementation of the Affordable Care Act (ACA) and threats to it.
Using 2011–2019 data from the biennial Minnesota Health Access Survey, the study found that about 4,000 adults aged 18 to 64 report insurance-based discrimination experiences. Using logistic regressions, the authors examined associations between insurance-based discrimination and (1) sociodemographic factors and (2) indicators of access.
Key Findings
- On average, approximately 10% of nonelderly adults reported insurance-based discrimination, although there was a statistically significant increase from 7.7% in 2015 to 11.0% in 2017.
- Reports of insurance-based discrimination remained remarkably stable within each coverage type between 2011 and 2019:
- Uninsured adults ranged between 24.7% to 28.1%
- Adults with public coverage ranged between 18.4% to 24.0%
- Adults with private coverage ranged between 3.0% to 5.4%
- Compared with adults with private insurance (4% on average), insurance-based discrimination was 5 or 6 times higher for adults with public insurance (21% on average) and about 7 times higher for adults with no insurance (27% on average).
- There was little association between insurance-based discrimination and having a usual source of care. However, insurance-based discrimination persistently interfered with confidence in getting needed care and reports of forgone care.
These findings indicate that policy changes from 2011 to 2019 affected access to health insurance, but high rates of insurance-based discrimination among adults with public insurance or no insurance were impervious to such changes. Stable rates of insurance-based discrimination during a time of increased access to health insurance via the ACA suggest deeper structural roots of healthcare inequities.
Read the full American Journal of Public Health article to learn more about the study methods and findings. A copy of this AJPH article is also available upon request.
Blog & News

BRFSS Estimates Show Potential Break in Series for Usual Source of Care: New Data on State Health Compare
October 20, 2022:A change to the 2021 BRFSS’ “personal doctor” question has led to large changes in the share of respondents reporting having no personal doctor
The Center for Disease Control’s (CDC) Behavioral Risk Factor Surveillance System (BRFSS) is a long-running, telephone-based state survey designed to monitor trends in adults’ health-related risk behaviors, chronic health conditions, and use of preventive services. SHADAC uses the BRFSS to produce state-level estimates of a number of different measures of health care access and affordability, health behaviors, and outcomes. These measures are posted on State Health Compare and are available by subgroup and over time.
Among these measures is Adults with No Personal Doctor, which quantifies the share of adults who report having no personal doctor. SHADAC tracks this measure because adults with a personal doctor are thought to have better access to care than those with no personal doctor.
The 2021 estimates of those reporting no personal doctor shifted dramatically and across nearly every measured subgroup and state. Notably, these large shifts in estimates corresponded with a change in how the BRFSS asks respondents if they have a personal doctor.
|
Because of this change in methodology and the large, uniform shift in resulting data across various subgroups, we believe the 2021 BRFSS represents a break in series for estimates of “no personal doctor” (and related measures) and do not recommend comparing 2021 estimates to those from prior years. |
This blog post describes changes to the “personal doctor” question and presents evidence of the impact this change had on estimates across the states and relevant subpopulations.
Changes to the “personal doctor” question structure
The table below compares the text of the “personal doctor” question asked in the BRFSS between 2000 and 2020 and the text of the question asked in the 2021 BRFSS. The main difference is that in 2021, the question broadens the concept of “personal doctor” by suggesting respondents consider groups of doctors when identifying whether they have a personal doctor. Specifically, the 2021 question specifically prompts the respondent if there is “one person or a group of doctors” (emphasis added) providing care whereas the question asked through 2020 only asks if there is more than one person who they think of as a personal doctor if the respondent has already indicated they don’t have one person they think of as their personal doctor.
|
2000-2020 BRFSS |
2021 BRFSS |
| "Do you have one person you think of as your personal doctor or health care provider? [If No, read: Is there more than one, or is there no person who you think of as your personal doctor or health care provider?]" 1 Yes, only one 2 More than one 3 No 7 Don't know / not sure 9 Refused |
"Do you have one person or a group of doctors that you think of as your personal health care provider?" 1 Yes, only one 2 More than one 3 No 7 Don't know / not sure 9 Refused |
Fewer people say they have “no personal doctor” using the 2021 question than in previous years
The primary result of this questionnaire change is that fewer people report having “no personal doctor” or other health care provider under the 2021 question compared with the question asked through 2020. This effect is nearly universal among many groups and across nearly every state. This type of change is uncommon and typically results from an update to the survey or its methods rather than from a true change in the population.
As shown below, the 2021 rate of 16.7% was far outside the range of estimates observed since 2011,1 which have been as high as 23.8% in 2013 and as low as 21.5% in 2015.
Percent reporting "no personal doctor" in the 2021 BRFSS was the lowest it has been in 10 years
The figures below present estimates of the share of the adult population who report having no personal doctor, comparing estimates from the 2020 and 2021 BRFSS. As shown in the figure on the left, the total percent of adults reporting no personal doctor was 6.4 percentage points (PP) lower in the 2021 survey (16.7%) compared to the 2020 survey (23.1%). Similar differences were observed across all measured groups (except for uninsured adults), with PP differences ranging from 2.5 PP among adults age 65 or older to 10.0 PP among adults age 25 to 34. As shown in the figure on the right, this was also true across the states, with a smaller share of adults reporting “no personal doctor” in the 2021 BRFSS compared to the 2020 survey in all but Delaware and Oregon. The difference ranged from 2.9 PP in Massachusetts to 13.4 PP in North Dakota.
Percent reporting "no personal doctor" dropped among most groups and nearly all states in the 2021 BRFSS
Further, these results hold when controlling for multiple factors in a multivariate analysis. In a variety of models, all controlling for the factors shown in the previous figures, respondents to the 2021 BRFSS were significantly less likely to report having no personal doctor than respondents to the 2020 BRFSS, with effects ranging from 4.1 PP (Model B) to 4.9 PP (Model C).
Multivariate analysis of rates of “no personal doctor” in 2021 BRFSS vs. 2020 BRFSS
|
|
Model A | Model B | Model C | Model D |
| 2021 coefficient | -0.043 | -0.041 | -0.049 | -0.046 |
| SE | 0.0072 | 0.0074 | 0.0020 | 0.0019 |
| t-score | -55.88 | -55.83 | -25.00 | -23.57 |
| p | <0.000 | <0.000 | <0.000 | <0.000 |
| Model type | OLS, robust SEs | OLS, robust SEs | Survey-weighted OLS | Survey-weighted OLS |
| State fixed effects | No | Yes | No | Yes |
Visit State Health Compare to explore this measure further!
1 The BRFSS implemented cell phone sampling and an advanced weighting method in 2011. For this reason, estimates from before 2011 are not comparable to those from 2011 and later.
Blog & News

SHADAC Advocates a Data-based Approach to Advancing Medicaid and CHIP Access Monitoring Plan (Response to CMS Request for Information)
April 29, 2021:On February 17, 2022, the Centers for Medicare & Medicaid Services (CMS) released a request for information (RFI) regarding access to coverage and care in Medicaid and the Children’s Health Insurance Program (CHIP).
SHADAC researchers focused our response on Objective 4: Question 1, which asked researchers to consider how CMS might develop a stronger Medicaid and CHIP access monitoring approach through data reporting and analysis, and is copied for reference below.
Portions of SHADAC’s response were also included as part of a larger commentary on each of the RFI’s five total objectives submitted to CMS by President and CEO Richard Besser, MD, of the Robert Wood Johnson Foundation (RWJF) on April 18, 2022.
|
Centers for Medicare & Medicaid Services (CMS) – Request for Information (2022) Objective 4: CMS has data available to measure, monitor, and support improvement efforts related to access to services (i.e., potential access; realized access; and beneficiary experience with care across states, delivery systems, and populations). CMS is interested in feedback about what new data sources, existing data sources (including Transformed Medicaid Statistical Information System [T-MSIS], Medicaid and CHIP Core Sets, and home and community based services (HCBS) measure set), and additional analyses could be used to meaningfully monitor and encourage equitable access within Medicaid and CHIP programs. 1. What should CMS consider when developing an access monitoring approach that is as similar as possible across Medicaid and CHIP delivery systems (e.g., fee-for-service and managed care programs) and programs (e.g., HCBS programs and dual eligibility in Medicaid and Medicare) and across services/benefits? Would including additional levels of data reporting and analyses (e.g., by delivery system or by managed care plan, etc.) make access monitoring more effective? What type of information from CMS would be useful in helping states identify and prioritize resources to address access issues for their beneficiaries? What are the most significant gaps where CMS can provide technical or other types of assistance to support states in standardized monitoring and reporting across delivery systems in areas related to access? |
Response from SHADAC
Thank you for the opportunity to help inform the development of an improved Medicaid and CHIP access monitoring plan. These comments are based on SHADAC’s experience providing data and evaluation technical assistance (TA) to states, which has given us a unique view into the day-to-day challenges and barriers that states encounter related to these issues. These comments mirror recent testimony to the Medicaid and CHIP Payment Access Commission (MACPAC) provided by SHADAC’s Deputy Director.
We present five points for your consideration, each of which are guided by the same principle, which is: That any monitoring plan should seek to minimize burden on state agencies.
First, consider an iterative approach that starts with a limited number of measures and expands over time. This will require difficult tradeoffs regarding priorities, but these tradeoffs will be worth it if the first iteration is achievable for a wide range of states. As the plan develops and more complicated measurement concepts are added, it should engage leading states by including them in additional measure selection and incentivizing them to participate in pilots that test the collection and analysis of data – sharing concrete implementation lessons with other states.
Second, support states in efforts to improve existing data with a focus on the ability to disaggregate. There are existing data streams to draw on (as documented by Urban Institute in 2017 and discussed at a recent MACPAC meeting), and while none are perfect, a successful plan should first focus on improving those. One tangible way to improve states’ existing data is to support data disaggregation efforts. There is a renewed focus and energy to promote equity within Medicaid and calls from stakeholders to see data about important groups of interest. This includes an interest in better data by race, ethnicity, sexual orientation, gender identity, disability, and geography. Improving existing data streams to better support disaggregation is a good investment and one that will meet multiple demands.
For example, the Transformed Medicaid Statistical Information System (T-MSIS) will likely play a role in monitoring service use, but there are concerns regarding the existing quality and completeness of the race and ethnicity data. We have worked with several states who are trying to improve the collection of race and ethnicity data in Medicaid—modifying question wording and expanding response options to better represent the populations they serve, making technical changes to better capture the data, and modifying instructional language and scripts for enrollment assisters to make them stronger partners in data collection. And, most importantly, they are doing this with community input. But they continue to face challenges in this work. For example, current OMB standards for demographics are dated and do not align with the most current research. Additionally, rules for collecting race and ethnicity data are not uniform across federal programs. A new access monitoring effort could serve as further impetus for federal agencies to revise the guidance on race and ethnicity and for states to take action to improve existing data collection to address this critical data gap.
Third, states need both direct funding and hands-on technical assistance to support this work. We appreciate CMS’s understanding that states will need assistance to implement the access monitoring framework. However, based on our work with states, we think this needs to go beyond documentation and uniform measure specifications. To do this well, states should have access to experts who can provide practical, hands-on advice that is responsive to their specific needs. The type of assistance needed will vary and needs to be flexible, from states who are further along in their process and may seek help troubleshooting a particular coding challenge to other states whose request might require more fundamental support, such as walking through the requirements to assess staff and training needs, setting priorities, and help developing contract amendments or RFPs. We would also recommend that any TA effort include a forum for states to discuss implementation challenges with their peers.
The funding provided to states for this effort should also be flexible. It should support direct costs like system modifications, but also things like stakeholder engagement, which is critical to the iteration and improvement of the monitoring plan, and related data collection, but will also allow the results of this monitoring to be shared in a meaningful way.
Fourth, some areas of Medicaid access monitoring are best addressed through federal data collection. We believe that the access monitoring effort would benefit from periodic fielding of a 50-state Medicaid Consumer Assessment of Healthcare Providers and Systems (CAHPS) survey aimed at both children and adults and administered by the federal government. The federal government has a long and successful track record of fielding high-quality surveys that produce estimates for all 50 states, including a one-time National Medicaid Adult CAHPS survey.
While this undertaking would be resource intensive, it seems to us to be the most efficient way to collect comparable information on important facets of access, like enrollee experience, and a starting point for comparing individuals enrolled in fee-for-service versus managed care.
Finally, it is critical to treat states as a full partner in this process, including the communication of results. It goes without saying that states should be consulted in the development of the monitoring plan, but they should also be consulted when the data are being released, preferably beforehand. Ideally, they should have access to analytic files so that they can do their own data runs and share customized findings with stakeholders. Finally, once the data are collected, there should be a commitment that the data be published or released in some format in a timely manner.
Blog & News

Covid-19 Vaccine Hesitancy in the U.S. has Reached a Plateau: Evidence from the Household Pulse Survey
April 1, 2022:Previous analysis produced by SHADAC using data from the Household Pulse Survey (HPS) showed promising evidence of a reduction in COVID-19 vaccine hesitancy during the first three months of 2021. However, though this report highlighted an overall decline in hesitancy, it also showed disparities in the level of hesitancy between demographic and socioeconomic groups. In an effort to continually illuminate barriers to vaccine receipt, this blog provides an updated look at vaccine hesitancy among U.S. adults (age 18 and older) using HPS data from January through October 2021.
|
The Household Pulse Survey is an ongoing weekly tracking survey designed to measure the impact of the COVID-19 pandemic. These data provide multiple snapshots of COVID-19 vaccine hesitancy and are the only data source to do so at the state level over time. Click on any graphic throughout this blog to view it in full-screen mode. |
The HPS allows respondents to identify multiple reasons for not receiving all vaccine doses.
For the survey period of January 6-July 5 the reasons listed on the survey form included:
| 1) Concerned about possible side effects 2) Plan to wait and see if it is safe and may get it later 3) Think other people need it more than I do right now 4) Don't know if a vaccine will work |
5) Don't trust the vaccine
6) Don't trust the government
7) Don't believe I need a vaccine
8) Don't like vaccines
|
9) Concerned about the cost of a COVID-19 vaccine 10) My doctor has not recommended it 11) Other reason |
For the survey period of July -October 11 the reasons listed on the survey form changed to include:
| 1) Concerned about possible side effects 2) Plan to wait and see if it is safe and may get it later 3) Don't know if a vaccine will protect me 4) Don't trust the vaccine |
5) Don't trust the government
6) Don't believe I need a vaccine
7) Don't think COVID-19 is that big of a threat
8) My doctor has not recommended it
|
9) Concerned about the cost of a COVID-19 vaccine 10) Hard for me to get a vaccine 11) Experienced side effects from 1st dose of vaccine 12) Believe one dose is enough to protect me |
Because the reasons for not receiving a vaccine changed between these two periods, they will be reported separately in our analysis.i
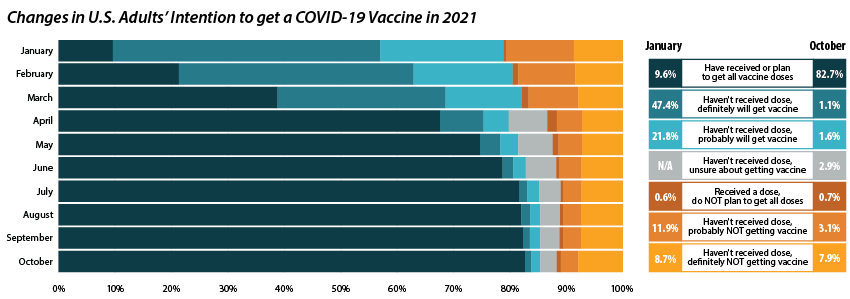
Share of adults who received or plan to receive all COVID-19 vaccine doses plateaued at the end of 2021.
From July through October 2021, the percent of people who have received or plan to receive all COVID-19 doses plateaued at around 80.0 percent.ii,iii This was after an initial jump from 9.6 percent in January to 67.6 percent in April. The initial increase drew mainly from the “Definitely planning to receive a vaccine” and “Probably going to receive a vaccine” groups. The percent of people who “Received a dose, but do not plan to receive all doses,” “Haven’t received a dose and are unsure about getting a vaccine,” “Haven’t received a dose and are probably not getting a vaccine,” and “Haven’t received a dose and definitely are not getting a vaccine” has also remained stable over the same period. Collectively, these four groups, which we define as being “hesitant,” dropped from a rate of 21.1 percent in January to 14.8 percent in July, where it’s remained since.
Vaccine Hesitancy varied by state, but nearly all states saw a reduction.
Nationally, 14.6 percent of adults reported being hesitant about the COVID-19 vaccine in October 2021. This varied across states, from a high of 28.9 percent in Wyoming to a low of 5.4 percent in the District of Columbia (D.C.).
The national rate of adult vaccine hesitancy decreased from 14.8 percent in July to 14.6 percent in October—a 0.2 percentage-point (PP) decrease. This overall decrease, though not significantly large, was reflected in 26 states plus D.C., which also saw promising reductions in vaccine hesitancy. Twenty-four states did not show reductions in hesitancy over that time period.
Concerns over possible side effects remains the top reason reported for vaccine hesitancy.
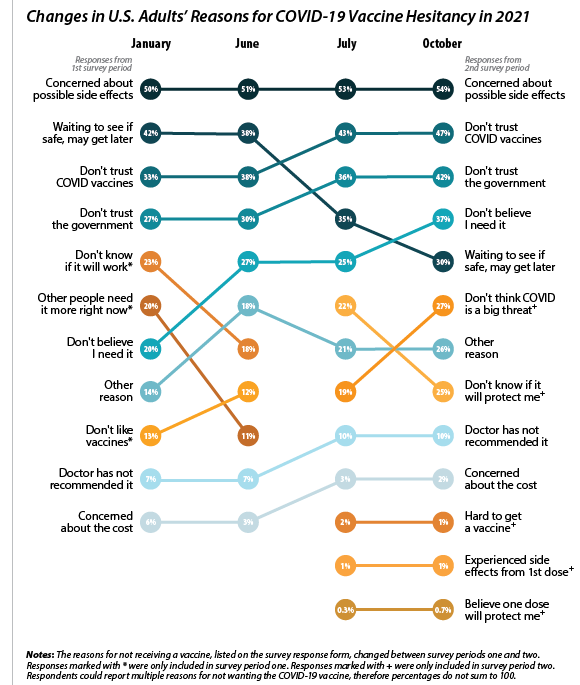 Of the 21.1 percent of people who reported hesitancy in January, nearly half (48.3 percent) cited “Concerns over possible side effects” as a reason.iv This continued to be the most reported reason for hesitancy, with 53.8 percent who were hesitant in October citing it as a reason. The percent of people reporting “Plan to wait and see if it is safe” declined over the 10-month period, from 42.1 percent in January to 30.4 percent in October, and dropped from the second to the fourth most reported reason behind “Don’t trust COVID-19 vaccine” and “Don’t trust the government.” This shift in reasoning behind vaccine hesitancy highlights a major barrier to vaccination goals, as establishing trust is a potentially more difficult and imprecise process than quelling fears of side effects.
When examining survey responses from January and October 2021, our analysis found that both the number of reasons for hesitancy (2.5 per person and 2.9 per person, respectively) and the most common reason for hesitancy (“concerns over possible side effects”) remained statistically unchanged between the two survey periods. Our analysis also found that the rankings of the reasons for hesitancy held within subpopulations by region, race/ethnicity, and income, as highlighted in the following sections.
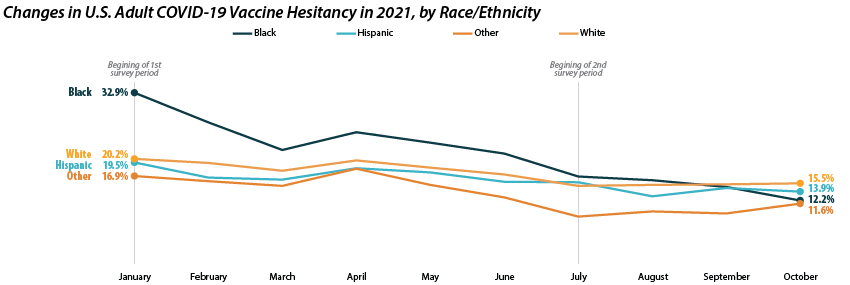
Disparities in vaccine hesitancy improved over time, though many remain.
As with our previous analysis of the HPS, both overall hesitancy and disparities in vaccine hesitancy between demographic and socioeconomic groups has improved, though unevenly. The most notable reduction comes among Black adults, who registered a high of 32.9 percent in January and dropped down to 12.2 percent in October. This decline in vaccine hesitancy essentially closed the gap between Black adults and other racial/ethnical groups. Unfortunately, the rate of decline seems to have reached a plateau among certain demographics. For example, among White adults the hesitancy rate stabilized at around 15.0 percent between July and October.
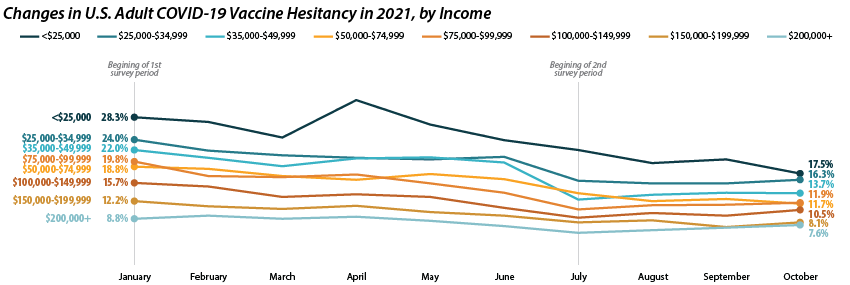
Similar patterns appear when looking within and across income level. Those making less than $25,000 reported the highest level of hesitancy in January at 28.3 percent, but have shown a marked reduction down to 17.5 percent in October. This has significantly closed the gap in hesitancy between this group and those at higher income levels. However, once again, changes within subgroups appear to have reached a stable level of hesitancy. Among those making $50,000-$74,999 this appears to be around 12.0 percent, while for those making $150,000 or more, this appears to be around 7.0 percent.
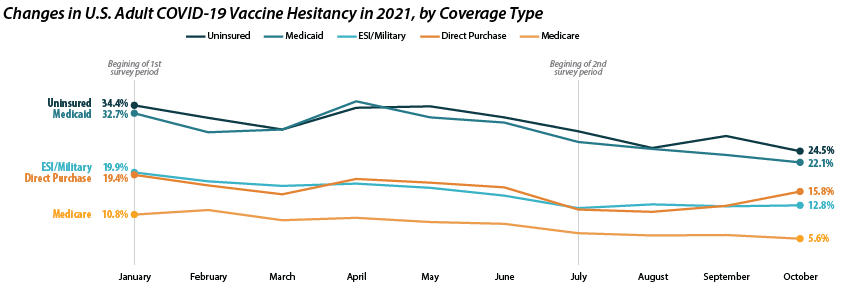
Patterns of reduced vaccine hesitancy followed by rate leveling continued to be true among groups with fewer connections to the health care system, as proxied by insurance status. Hesitancy rates have fallen generally across all insurance statuses; however, the uninsured and those with Medicaid coverage continue to have the highest rates of hesitancy, at 24.5 percent and 22.1 percent in October as compared to those with ESI/Military, Direct Purchase, or Medicare coverage.
Note: All changes and differences in this post are statistically significant at the 95% confidence level unless otherwise noted.
Related Reading
SHADAC Blog: Vaccine Hesitancy Decreased During the First Three Months of the Year: New Evidence from the Household Pulse Survey
SHADAC Blog Series: Measuring Coronavirus Impacts with the Census Bureau's New Household Pulse Survey: Utilizing the Data and Understanding the Methodology
i U.S. Census Bureau. (2021, November 3). 2021 Household Pulse Survey User Notes [Phase 3.2]. https://www2.census.gov/programs-surveys/demo/technical-documentation/hhp/Phase3-2_2021_Household_Pulse_Survey_User_Notes_11032021.pdf
ii This only includes primary series doses and excludes booster doses.
iii This percentage is higher than administratively reported COVID-19 vaccine receipt. The differences are due to both the inclusion of those who “Plan to receive all vaccine doses” and the known discrepancies between administrative and survey data.
iv The HPS allows those who are “Probably going to receive a vaccine” to report reasons for hesitancy; however, this group is not included in our definition of “hesitant.”

