
Blog & News


Brief: Strategies to Increase Access to Medications for Opioid Use Disorder during the COVID-19 Pandemic and Beyond
October 25, 2021: Impacts of the COVID-19 pandemic have been demonstrably far-ranging, including changes to substance use-related behaviors.1 Evidence indicates that opioid use disorders (OUDs), overdoses, and overdose deaths grew as a result of COVID-19-related isolation and economic anxiety, and mortality data indicate that opioid overdose deaths, in particular, reached record levels in 2020.
SHADAC researchers Carrie Au-Yeung and Lynn Blewett, along with Hennepin Healthcare researcher Tyler Winkelman, authored a new Milbank Foundation policy brief that examines the federal and state policies changes put in place to improve access to medications for opioid use disorder (MOUD) during the COVID-19 pandemic, during which time MOUD became especially challenging to access because MOUD patients are typically required to have as many as six in-person clinic visits a week. The authors conclude with federal and state policy recommendations based on their analysis.
What is MOUD?
MOUD – sometimes referred to as medication-assisted treatment, or MAT – is the use of medications (methadone, buprenorphine, and naltrexone) to treat OUD, reduce opioid use, and lower the risk of overdose mortality. MOUD is frequently coupled with counseling and behavioral therapies and is the standard of care for OUD.
What policy solutions were put into place to make MOUD more accessible during COVID-19?
A number of policy solutions were put into place at the federal and state level in order to reduce the number of in-person clinic visits required for MOUD and to make MOUD more accessible in general. These solutions involved service delivery rules, prescribing rules, dispensing and refill rules, drug-testing requirements, counseling requirements, Medicaid prior authorization rules, and Medicaid coverage of telehealth.
For example, at the state level:
- Telehealth visits were allowed to replace in-person MOUD visits around prescriptions, assessments, and counseling.
- Some states loosened restrictions on dispensing and refill rules for MOUD and also allowed opioid treatment programs (OTPs) to deliver medications to quarantined or otherwise homebound patients.
- Some states gave more latitude to practitioners to use their own clinical judgment regarding toxicology screening and drug testing, and relaxed state-level counseling requirements or suspending them altogether.
- Individual states temporarily suspended certain Medicaid prior authorization requirements for MOUD, extended prior authorizations through the end of the COVID-19 emergency period, and/or expedited prior authorizations through documentation flexibility.
- All 50 states and the District of Columbia (D.C.) modified Medicaid policies regarding telehealth to allow for more virtual visits: some upped payment rates for telehealth visits to match in-person visits, others extended policies to cover a wider array of providers, and others expanded “telehealth” to cover audio-only (telephonic) visits.
At the federal level, policy solutions included:
- In-person examination requirements for buprenorphine initiation were removed while for methadone, initiation must be in person, but subsequent visits can occur via telemedicine.
- In April 2021, the US Department of Health and Human Services altered prescribing rules to exempt eligible physicians and practitioners from federal training requirements to obtain a waiver to prescribe buprenorphine small numbers of patients (i.e., fewer than 30).
- Dispensing and refill rules, such as the standard take-home schedule for methadone, was relaxed by the Substance Abuse and Mental Health Services Administration (SAMHSA).
- The American Society for Addiction Medicine suggested pausing, limiting, or using alternative protocols for drug-testing requirements in certain areas to combat community spread of COVID-19.
Recommendation
The need to expand access to MOUD will not end with the COVID-19 emergency, as the number of individuals who need treatment far exceeds the capacity of MOUD providers and facilities. Some of the policy changes that have made MOUD more accessible during the pandemic have already been made permanent at the state level (e.g., expanding the definition of “telehealth” in Medicaid). The continuation of other changes, however, will require ongoing support from state and national policymakers.
The authors recommend continued efforts around three regulatory strategies in particular:
- National and state policymakers should encourage the continuation of federal policies allowing buprenorphine initiation via telemedicine and the removal of state-level restrictions that go beyond federal requirements.
- National and state policymakers should also promote the continuation of federal policies allowing OTPs to dispense more doses of methadone and the removal of any additional state-level methadone dispensing restrictions that exist.
- Policymakers should work to prohibit Medicaid prior authorization requirements for MOUD and to make permanent any temporary suspensions of prior authorization requirements for these medications that were implemented during the COVID-19 emergency.
The authors note that, though there are other policy avenues for expanding access to MOUD, these three areas are particularly relevant for reducing logistical barriers to treatment. Moreover, evidence and testimony from providers and patients indicates that these mechanisms have been safe and effective during the COVID-19 pandemic and that continuing them beyond the pandemic period is warranted.
1 Planalp, C. (2021, July 15). Drug overdose deaths grew by almost 30 percent in 2020. SHADAC blog. https://www.shadac.org/news/drug-overdose-deaths-grew-almost-30-percent-2020
Planalp, C. (2021, June 14). Pandemic drinking may exacerbate upward-trending alcohol deaths. SHADAC blog. https://www.shadac.org/news/pandemic-drinking
Blog & News

Explore Physician Acceptance of New Medicaid Patients through Two New Measures on SHADAC’s State Health Compare and in a New MACPAC Factsheet
August 5, 2021:Authors: Robert Hest and Julia Ngep
In order for the more than 80 million Medicaid beneficiaries to access needed care in a timely manner, there must be a sufficient number of health care providers to serve these patients. There has long been concern that providers are less likely to accept Medicaid patients than patients with other types of health insurance coverage. Because Medicaid policies—and providers’ responses to those policies—differ substantially across states, state-level data is critical for monitoring the providers’ decisions to accept Medicaid patients and for understanding the factors that influence those decisions.
Using data from the 2011-2017 National Electronic Health Records Survey (NEHRS),1 SHADAC performed an analysis to examine and compare physician acceptance of new Medicaid patients at the state level and by physician and practice characteristics. This analysis was performed under contract with the Medicaid and CHIP Payment and Access Commission (MACPAC) and is presented in two new measures on SHADAC’s State Health Compare web tool as well as in a new MACPAC factsheet.
State Health Compare Measures
 Physicians who accept new patients
Physicians who accept new patients measures the percent of physicians who accept new patients by type of coverage: private, Medicare, and Medicaid. Data years were pooled where single-year estimates were not possible and are available for 2011-2013 and 2014-2017.
In 2014-2017, state-level physician acceptance of Medicaid patients ranged from 42.2 percent in New Jersey to 99.4 percent in North Dakota, acceptance of Medicare patients ranged from 77.1 percent in Georgia to 98.3 percent in North Dakota, and acceptance of private patients ranged from 80.3 percent in the District of Columbia (D.C.) to 100.0 percent in Nebraska.
Physicians who accept new Medicaid patients
Physicians who accept new Medicaid patients measures the percent of physicians who accept new Medicaid patients by the following physician/practice characteristics:
- Setting (private solo/group versus total) available for pooled data years 2011-2012 and 2014-2017;
- The share of Medicaid existing patients (above versus below national average) available for pooled data years 2011 & 2013 and 2014-2017;
- And the ratio of mid-level providers (above versus below national average) available for pooled data years 2014-2017.
At the national level in the most recent time period: physicians in private solo/group practices were less likely to accept new Medicaid patients compared to all physicians (70.4% versus 74.0%); physicians with an above-average share of existing Medicaid patients were more likely to accept new Medicaid patients compared to all physicians (87.4% versus 63.8%); and physicians with an above-average ratio of mid-level providers were more likely to accept new Medicaid patients compared with all physicians (80.5% versus 73.7%).
New MACPAC Factsheet
 Physician Acceptance of New Medicaid Patients: Findings from the National Electronic Health Records Survey
This new MACPAC factsheet analyzes physician acceptance of new Medicaid patients at the national and state levels. As Medicaid programs vary by each state and there is little information on physician participation in Medicaid at the state level, this analysis provides an important update of previous MACPAC work analyzing physician acceptance at the national level and prior literature analyzing state-level physician acceptance, last updated for data year 2013.
The analysis found significant differences in rates of physician acceptance of new patients by coverage type, with physicians being more likely to accept private and Medicare patients compared with Medicaid patients. Acceptance of Medicaid patients varied significantly by state and by various patient, physician, and practice characteristics. These include source of patient coverage (Medicaid, Medicare, and private), physician specialty, practice setting, existing Medicaid caseload, and presence of mid-level providers. The analysis found that nationally, rates of physician acceptance were stable over time and increased significantly in a handful of states, with no states experiencing significant decreases in rates of acceptance.
1 Data for 2016 was not released by National Center for Health Statistics (NCHS), which conducts the NEHRS. Data were unavailable by setting in data year 2013; data were unavailable by share of existing Medicaid patients for data year 2012; and data were unavailable by ratio of mid-level providers for data years 2011-2013.
Blog & News

Tracking Broadband Access to Monitor Access to Care
August 4, 2021:The dramatic growth of telehealth during the COVID-19 pandemic has highlighted the crucial role of broadband access in ensuring that people can obtain healthcare services. Broadband has allowed individuals to leverage telehealth technology to receive care from providers in ways that minimize the risk of COVID-19 transmission while eliminating certain access barriers regarding transportation and/or travel time. However, individuals who lack access to broadband services can face healthcare inequities as they are unable to utilize virtual services. Although COVID-19 vaccination rates are on the rise across the United States, the resurgence of cases due to the Delta variant of COVID-19 may lead to more required virtual visits. In addition, virtual access to care will remain important for individuals who live in rural areas, have transportation or mobility limitations, or otherwise would have difficulty visiting a care provider in person, even after the pandemic subsides.
Broadband Access Across the Country
Despite the important role of broadband access in obtaining virtual healthcare services, not everyone lives in a household that has broadband. Estimates from a SHADAC analysis of the American Community Survey (ACS) Public Use Microdata Sample (PUMS) files indicate that in 2019, 86.3 percent of families nationwide had access to broadband in their households.1 Among the states, household broadband access ranged from a high of 91.2 percent in Washington to a low of 76.9 percent in Mississippi.1 Higher rates of broadband access are clustered in states on the West Coast and the Northeast shore. States that have more rural populations tend to have lower access to broadband, with a concentration of limited access in the Southeast.1
Percent of households with a broadband internet subscription, 2019
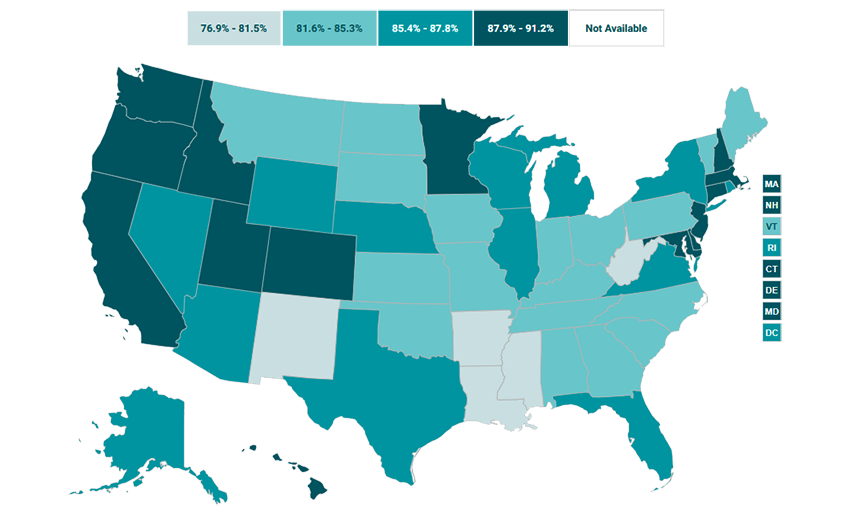
Source: SHADAC analysis of the 2019 American Community Survey (ACS) Public Use Microdata Sample (PUMS) files.
Broadband Access in Minnesota: Above Average, with Plans to Expand
In Minnesota, 87.9 percent of households had access to broadband in their homes in 2019, placing the state higher than the national average and with the 14th highest access to broadband across the states.1 However, the nearly 12 percent of Minnesota households that do not have broadband access also tend to face other factors that can reduce access to healthcare, like living in less dense counties, which tend to have fewer medical providers and require patients to travel farther to access medical facilities.2 In order to improve healthcare accessibility in these areas, Minnesota legislators have agreed to invest an additional $70 million in broadband coverage expansion through the Border-to-Border grant program.3 This program assists with infrastructure installation costs that broadband providers may experience when offering services to an area that has been historically unserved or underserved.3 While this grant program is not expected to expand broadband services to every household in Minnesota, it is one of the largest investments in broadband access in the state since 2014.3
Conclusion
Broadband internet has been vital for accessing healthcare during the COVID-19 pandemic. However, not every family in the U.S. has access to broadband, and this lack of access is distributed unevenly among the states. Less than 80 percent of households in Mississippi and New Mexico (76.9 percent and 78.9 percent, respectively) have broadband access while over 90% of households in Utah, Colorado, and Washington (90.5 percent, 91.1 percent, and 91.2 percent, respectively) have access to broadband internet.1 As telehealth continues to play a role in getting needed services to individuals who face barriers to obtaining care in person, it is important to monitor broadband access as an indicator of access to care.
About the Data
The data cited here can be accessed through SHADAC’s online data tool, State Health Compare, using the measure “Percent of households with a broadband internet subscription” for the years 2016-2019. The estimates come from SHADAC’s analysis of the American Community Survey (ACS) Public Use Microdata Sample (PUMS).
1 Percent of households with a broadband internet subscription. State Health Compare, SHADAC, University of Minnesota website. http://statehealthcompare.shadac.org/map/232/percent-of-households-with-a-broadband-internet-subscription-by-total#a/27/266. Accessed July 21, 2021.
2 Estimated availability of wireline broadband service by county in the state of Minnesota—Areas served by at least 25 Mbps download/3 Mbps upload. Connected Nation. https://mn.gov/deed/assets/county-bb-service-availability_tcm1045-255846.pdf. Published April 2021. Accessed July 21, 2021.
3 Orenstein W. Minnesota lawmakers agree to spend $70 million on improving broadband access across the state. MinnPost. June 1, 2021. https://www.minnpost.com/greater-minnesota/2021/06/minnesota-lawmakers-agree-to-spend-70-million-on-improving-broadband-access-across-the-state/. Accessed July 21, 2021.
Blog & News

COVID-19 Vaccination Rates: State-level and Subpopulation Evidence from the Household Pulse Survey
July 19, 2021:Update 6: June 9 to June 21
The COVID-19 vaccines promise to help protect individual Americans against infection and eventually provide population-level herd immunity. After several months of rolling out the various one and two-shot COVID-19 vaccines, which have included hiccups from the Johnson & Johnson vaccine, vaccination rates continue to increase at a slow but steady pace. Although the country fell short of meeting the current administration’s goal of vaccinating 70% of the adult population by July 4 (as measured by official administrative data reported to the Centers for Disease Control [CDC]), several states have achieved this goal.
Over the past several months, all states have increased COVID-19 vaccine rollout by expanding vaccine access to the general adult population and children over 12. However, there are still concerns on prioritization decisions and the existing mechanisms of the vaccine rollout—in addition to evidence that lower-income individuals, people of color, and individuals without strong connections to the health care system are less likely to get vaccinated—which have created challenges in equitable distribution of the COVID-19 vaccine and could worsen existing pandemic-related health inequities.
The available data have not assuaged these concerns, and show patterns of lower vaccination rates among people with lower levels of education, no health insurance coverage, and marginalized racial and ethnic groups. The U.S. Census Bureau recently released updated data on take-up of COVID-19 vaccines from its Household Pulse Survey (HPS), collected June 9-21, 2021. The HPS is an ongoing, biweekly tracking survey designed to measure impacts of the COVID-19 pandemic. These data provide an updated snapshot of COVID-19 vaccination rates and are the only data source to do so at the state level by subpopulation.
This blog post presents top-level findings from these new data, focusing on rates of vaccination (one or more doses) among U.S. adults (age 18 and older) living in households and comparing to results from the last half of March, the most recent time period of comparison from this ongoing blog series.
These data represent the latest release from Phase 3.1 of the HPS, which has a biweekly data collection and dissemination approach. The Census Bureau has indicated that it plans to continue administering the survey through December 2021.
Nationally, over three-fourths of adults had received a vaccination, but this varied by state
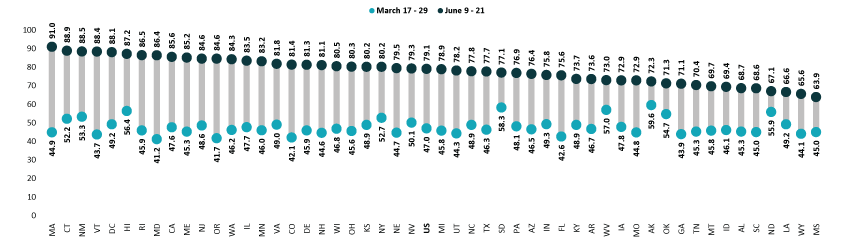
According to the new HPS data, 79.1% of U.S. adults had received one or more COVID-19 vaccinations towards the end of June1, though this varied by state from a low of 63.9% in Mississippi to a high of 91.0% in Massachusetts. At least four in five adults had received a vaccine in 22 states and the District of Columbia.
Vaccination rates increased considerably across all states; states with lower rates catching up
Nationally, adult vaccination rates substantially increased from the last half of March, rising from 47.0% during March 17-29, 2021, to 79.1% during June 9-21, 2021. Many states experienced large increases in their vaccination rates. The size of these increases varied from an 11.2 percentage-point (PP) increase in North Dakota to a 46.1 PP increase in Massachusetts. Five states saw increases of 40.0 PP or larger: Maryland, Massachusetts, Oregon, Rhode Island, and Vermont.
Percent of Adults Who Had Received a COVID-19 Vaccine, 2021
Disparities in vaccination rates improved, but slowly and unevenly
Although there have been ongoing strategies to achieve health equity in COVID-19 vaccine rollouts, vaccination rates continued to vary to a great degree by demographic and socioeconomic factors. Gaps in vaccination compared to the national average narrowed slightly for most groups, though some saw larger improvements. As with previous iterations in this blog series, vaccination rates were lower for certain subpopulations such as Black adults, adults who identified as “Some other race/Multiple races,” adults without a high school education, and adults without health insurance coverage. More resources, attention, or new strategies may be needed to close the gaps for these hardest-to-reach groups.
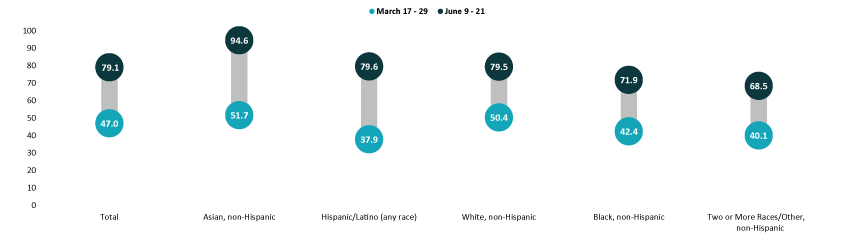
Asian and White adults continued to have above-average vaccination rates at 94.6% and 79.5%, respectively. Rates among Black adults (71.9%) and adults identifying with “Two or more” (Multiple) or “Some other” race (68.5%) continued to be below the national average. Rates among Hispanic/Latino adults improved, and are now above the national average at 79.6%. Hispanic/Latino adults also saw the largest improvement relative to the national average, going from almost 20 percent below the national average in late March (37.9% vs. 47.0%) to nearly one percent above the national average in June (79.6% vs. 79.1%).
Percent of Adults Who Had Received a COVID-19 Vaccine by Race/Ethnicity, 2021
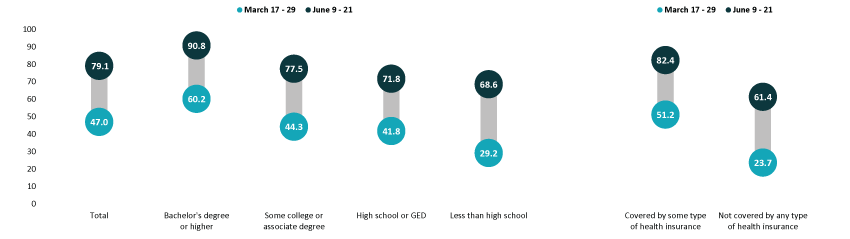
Disparities by education level remained, with adults holding a bachelor’s degree or higher continuing to have the highest vaccination rate at 90.8%, and adults without a high school diploma having the lowest vaccination rate at 68.6%. Despite having the lowest vaccination rate, adults without a high school diploma had the largest relative improvement to the national average, going from 38 percent below the national average in March (29.2% vs. 47.0%) to 13 percent below the national average in June (68.6% vs. 79.1%). Vaccination rates among adults with a high school degree or equivalent and adults with some college or an associate’s degree also improved somewhat relative to the national average.
Adults with health insurance coverage had an above-average vaccination rate at 82.4%, while uninsured adults had a below-average vaccination rate at 61.4%. Regardless of having a rate substantially below the average, the rate among those not covered by any type of health insurance had a notable improvement relative to the national average, going from 50 percent below the national average in March (23.7% vs. 47.0%) to 22 percent below the national average in June (61.4% vs. 79.1%).
Percent of Adults Who Had Received a COVID-19 Vaccine by Education and Health Insurance Status, 2021
Notes about the Household Pulse Survey Data
The estimated rates presented in this post were pulled from the HPS COVID-19 Vaccination Tracker published by the Census Bureau. Though these counts are accompanied by standard errors, standard errors are not able to be accurately calculated for rate estimates. Therefore, we are not able to determine if the differences we found in our analysis are statistically significant or if the estimates themselves are statistically reliable. Estimates and differences for subpopulations at the state level should be assumed to have large confidence intervals around them and caution should be taken when drawing strong conclusions from this analysis. However, the fact that these indications of COVID-19 inequities mirror patterns of other vaccinations inequities demonstrate reason for concern.
Though produced by the U.S. Census Bureau, the HPS is considered an “experimental” survey and does not necessarily meet the Census Bureau’s high standards for data quality and statistical reliability. For example, the survey has relatively low response rates (6.4% for June 9-21), and sampled individuals are contacted via email and text message, asking them to complete an internet-based survey. These issues in particular could be potential sources of bias, but come with the tradeoffs of increased speed and flexibility in data collection as well as lower costs. A future post will investigate differences between COVID-19 vaccination rates estimated from survey data (such as the HPS) and administrative sources. The estimates presented this post are based on responses from 68,067 adults. More information about the data and methods for the Household Pulse Survey can be found in a previous SHADAC blog post.
Previous Blogs in the Series
COVID-19 Vaccination Rates: State-level and Subpopulation Analysis of the Household Pulse Survey (Update 5: March 17 to March 29) (SHADAC Blog)
COVID-19 Vaccination Rates: State-level and Subpopulation Analysis of the Household Pulse Survey (Update 4: March 3 to March 15) (SHADAC Blog)
COVID-19 Vaccination Rates: State-level and Subpopulation Evidence from the Household Pulse Survey (Update 3: Feb 17 to March 1) (SHADAC Blog)
COVID-19 Vaccination Rates: State-level and Subpopulation Evidence from the Household Pulse Survey (Update 2: Feb 3 to Feb 15) (SHADAC Blog)
COVID-19 Vaccination Rates: State-level and Subpopulation Evidence from the Household Pulse Survey (Update: Jan 10 to Feb 1) (SHADAC Blog)
COVID-19 Vaccination Rates: New State-level and Subpopulation Evidence from the Household Pulse Survey (Jan 6 to Jan 18) (SHADAC Blog)
Related Reading
Vaccine Hesitancy Decreased During the First Three Months of the Year: New Evidence from the Household Pulse Survey (SHADAC Blog)
State-level Flu Vaccination Rates among Key Population Subgroups (50-state profiles) (SHADAC Infographics)
50-State Infographics: A State-level Look at Flu Vaccination Rates among Key Population Subgroups (SHADAC Blog)
Anticipating COVID-19 Vaccination Challenges through Flu Vaccination Patterns (SHADAC Brief)
New Brief Examines Flu Vaccine Patterns as a Proxy for COVID – Anticipating and Addressing Coronavirus Vaccination Campaign Challenges at the National and State Level (SHADAC Blog)
Ensuring Equity: State Strategies for Monitoring COVID-19 Vaccination Rates by Race and Other Priority Populations (Expert Perspective for State Health & Value Strategies)
SHADAC Webinar - Anticipating COVID-19 Vaccination Challenges through Flu Vaccination Patterns (February 4th) (SHADAC Webinar)
1 Note that it is not unusual for there to be appreciable differences between survey-based estimates and those derived from administrative data, as there are here between the vaccination rates observed in the HPS and those seen in CDC administrative vaccination data. There could be several reasons for these differences, including differences in the population universe (i.e., household-residing adults vs. total adult population), differences in the measured time period, the inaccuracies between self-reported vs. administratively collected data, and differences in the representativeness of survey vs. administrative data. Although administrative data are often thought to be more accurate than survey-based estimates, survey data such as the HPS have the advantage of providing more granular detail about the demographic and socioeconomic characteristics of populations of interest that are often unavailable or incomplete in administrative data.
Blog & News

Vaccinating children may be key to reaching COVID-19 herd immunity
March 29, 2021:Few states could hit 80% vaccination rate until children are eligible
As more people become vaccinated against COVID-19, it’s understandable that many want to return to “normal.” Recognizing that desire, the U.S. Centers for Disease Control and Prevention (CDC) recently published guidance on activities people can engage in after being fully vaccinated; for instance, those who are fully vaccinated may socialize indoors, without a mask, with other fully vaccinated people.1
However, as the U.S. still works toward a goal of “herd immunity,” in which a sufficient share of the population has been vaccinated to stem the spread of the virus, the CDC also recommends that everyone—including fully vaccinated individuals—continue to take precautions. For example, people should continue to wear masks and social distance in public, avoid large gatherings, and postpone travel plans until enough people are vaccinated.
While the herd immunity threshold to halt community spread of COVID-19 is yet unknown, experts such as Dr. Anthony Fauci, director of the National Institute of Allergy and Infectious Disease, estimate the rate is somewhere between 70-90 percent of the population. The development and authorization of multiple vaccines raises hope for achieving herd immunity, but reaching that goal will be neither fast nor easy.
One major challenge on the path toward herd immunity is that current vaccines are primarily or entirely limited to adults. However, children make up a substantial share of the U.S. population—roughly 22 percent for the country overall, and ranging by state from a low of 18 percent in Vermont to a high of 29 percent in Utah.
State-level population data illustrate the impracticality of reaching herd immunity thresholds until COVID immunization is also broadly available for children. For instance, assuming a 70 percent threshold for COVID, which falls on the lower end of what experts predict, herd immunity would be challenging for most states and almost impossible for others.
Estimated Percentage of State Adult Populations Needed to Reach Total Population Herd Immunity
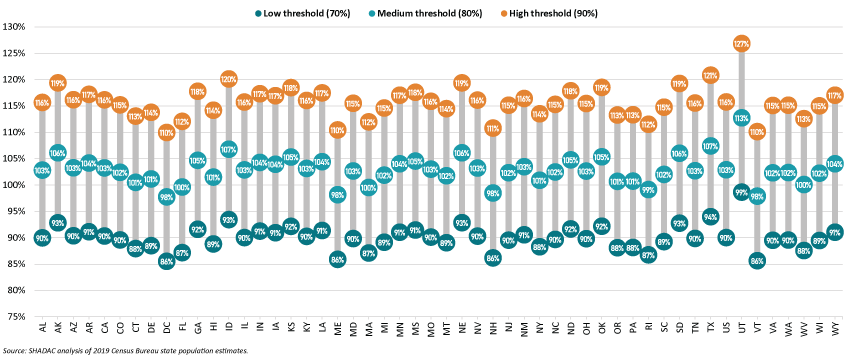
To reach 70 percent of the overall state population by immunizing only adults, Vermont would have to vaccinate 86 percent of the state’s adult population, while Utah would have to vaccinate 99 percent of its adult population. Achieving those goals would necessitate concerted efforts to overcome historic disparities in distribution of vaccines, as well as nascent inequities in the distribution of COVID vaccines, as SHADAC has documented in other analyses.2,3,4
As herd immunity targets increase—from 70 percent to 80 percent to 90 percent—reaching herd immunity through only adults ultimately becomes mathematically impossible for all states due to their sizeable numbers of children, who are largely ineligible for vaccination as of yet.
Eventually, as COVID vaccine trials are completed and the immunizations are approved for children, herd immunity will become a tangible and achievable landmark. The U.S. has decades of experience in successfully immunizing its population against communicable diseases. For example, recent estimates from the CDC show that more than 90 percent of eligible children have received vaccines against chickenpox; hepatitis B; polio; and measles, mumps and rubella.5
But until COVID vaccines have been deeply distributed among both adults and children, it will likely remain important for people to take continued public health precautions such as social distancing and wearing face masks to slow the spread of the virus, as recommended by the CDC.
Related Reading
Measuring Coronavirus Impacts with the Census Bureau's New Household Pulse Survey: Utilizing the Data and Understanding the Methodology (SHADAC Blog Series)
State-level Flu Vaccination Rates among Key Population Subgroups (50-state profiles) (SHADAC Infographics)
50-State Infographics: A State-level Look at Flu Vaccination Rates among Key Population Subgroups (SHADAC Blog)
Anticipating COVID-19 Vaccination Challenges through Flu Vaccination Patterns (SHADAC Brief)
Ensuring Equity: State Strategies for Monitoring COVID-19 Vaccination Rates by Race and Other Priority Populations (Expert Perspective for State Health & Value Strategies)
1 Centers for Disease Control and Prevention (CDC). (2021, March 8). Interim Public Health Recommendations for Fully Vaccinated People. https://www.cdc.gov/coronavirus/2019-ncov/vaccines/fully-vaccinated.html
2 Planalp, C. & Hest, R. (2021). Anticipating COVID-19 Vaccination Challenges through Flu Vaccination Patterns. State Health Access Data Assistance Center (SHADAC). https://www.shadac.org/publications/anticipating-covid-19-vaccination-challenges-through-flu-vaccination-patterns
3 State Health Access Data Assistance Center (SHADAC). (2021). State-level Flu Vaccination Rates among Key Population Subgroups (50-state profiles). https://www.shadac.org/publications/state-level-flu-vaccination-rates-among-key-population-subgroups-50-state-profiles
4 State Health Access Data Assistance Center (SHADAC). (2021). Measuring Coronavirus Impacts with the Census Bureau's New Household Pulse Survey: Utilizing the Data and Understanding the Methodology. https://www.shadac.org/Household-Pulse-SurveyMethods
5 National Center for Health Statistics (NCHS). (2021, March 1). Immunization. Centers for Disease Control and Prevention (CDC). https://www.cdc.gov/nchs/fastats/immunize.htm

