Blog & News


A State-level Measure of Drug Affordability on State Health Compare: Made Changes to Medical Drugs Because of Cost
February 25, 2019:Americans spend more on prescription medications per capita than residents of any other nation due to higher U.S. drug prices. In 2016, prescription drugs accounted for an estimated 14.1 percent of total national health care costs, or $471 billion. [1],[2] The high prices of prescription drugs have captured current national attention, with both the Trump Administration and congressional lawmakers proposing a number of solutions to the issue.
State Health Compare: Americans Are Making Changes to Their Medical Drugs Due to Cost
|
SHADAC’s State Health Compare measure “Made Changes to Medical Drugs” is produced using the National Health Interview Survey (NHIS), for which State Health Compare is the only source of state-level estimates, providing a unique way to see how the cost of prescriptions and other medical drugs affects Americans’ ability to afford these medications across and within states. |
According to estimates from SHADAC’s State Health Compare, many Americans are making changes to their medical drugs in response to rising drug prices. In 2016, 28.0% of non-elderly adults (ages 19-64) said that due to cost they asked their doctor for cheaper medications, delayed refills, took less medication than prescribed, skipped doses, used alternative therapies, and/or bought medications out of the country.
The percentage of the U.S. population that made changes to drugs due to cost has been relatively stable over time at the national level, but there are substantial differences by state and significant disparities exist between age groups and types of insurance coverage.
MADE CHANGES TO MEDICAL DRUGS: HIGHLIGHTED ESTIMATES
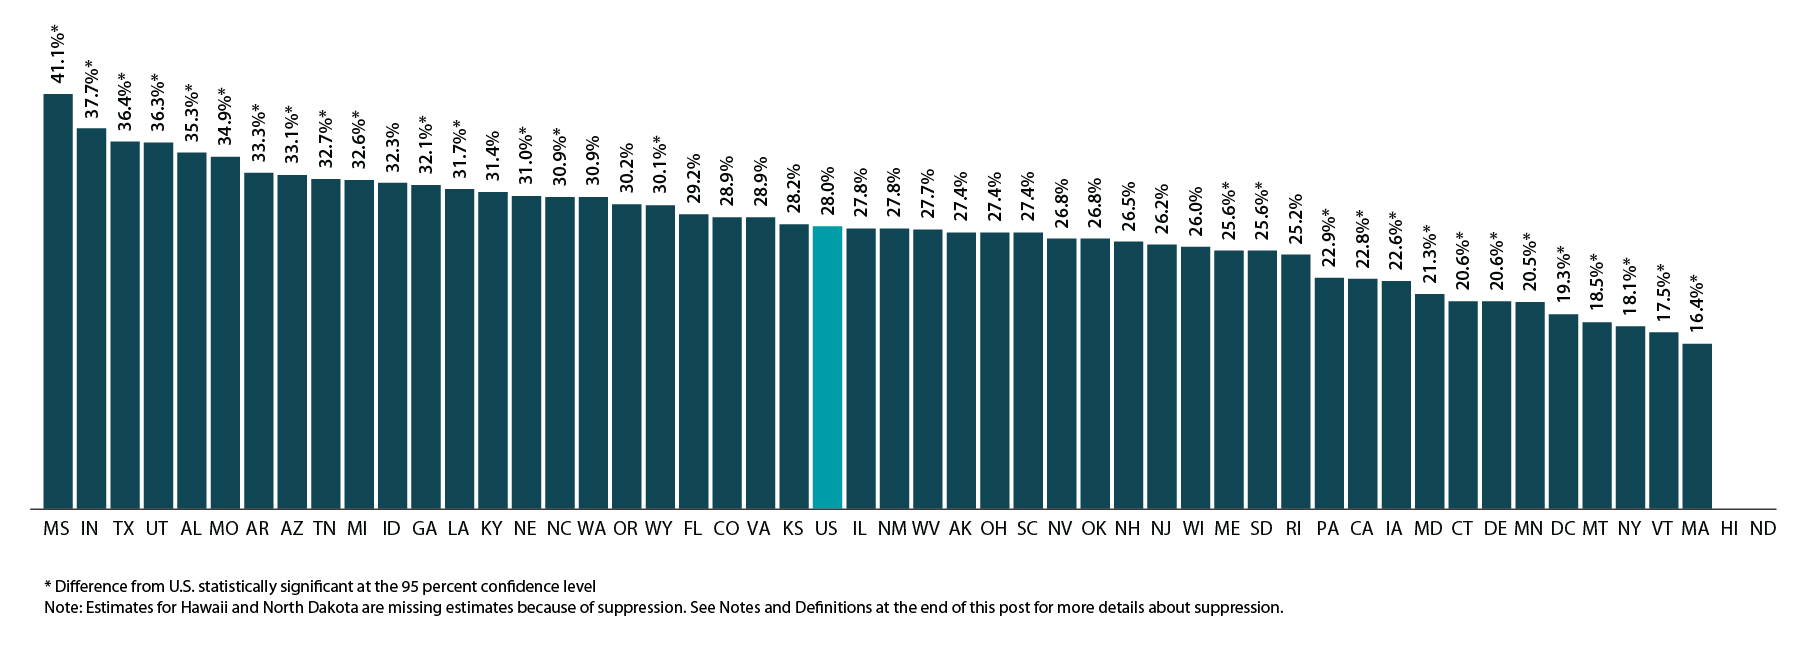
There are significant differences by state in cost-related drug changes
As shown in the figure below, there is substantial state variation in the percent of non-elderly adults who report making changes to medical drugs due to cost, ranging from 16.4% in Massachusetts to 41.1% in Mississippi, a gap of 24.7 percentage points.
Percent of Non-elderly Adults Who Made Changes to Medical Drugs Because of Cost by State, 2016
Elderly adults were less likely to make changes to drugs due to cost
At the national level, elderly adults (age 65 and older) were less likely to report having made changes to their medical drugs due to cost relative to non-elderly adults (ages 18 to 64) at 22.7% vs. 28.0%, respectively. This difference may be related to the near-universal coverage of elderly adults through the Medicare program (though Medicare has limited drug coverage) compared to the relatively high rates of uninsurance among the non-elderly adult population. The discrepancy could also be due to differences in the resources that individuals in these two age groups have available to pay for drugs.
At the state level, there are large, statistically significant differences between elderly and non-elderly adults in the percentage of each group that made changes to medical drugs due to cost, as shown in the figure below. These differences range from a high of 13.1 percentage points in New Mexico (27.8% for those ages 19-64 vs. 14.7% for those ages 65+) to a low of 1.2 percentage points in Louisiana (31.7% for those ages 19-64 vs. 30.5% for those ages 65+) and Washington (30.9% for those ages 19-64 vs. 29.7% for those ages 65+).
Percent Who Made Changes to Medical Drugs Because of Cost by State and Age, 2016

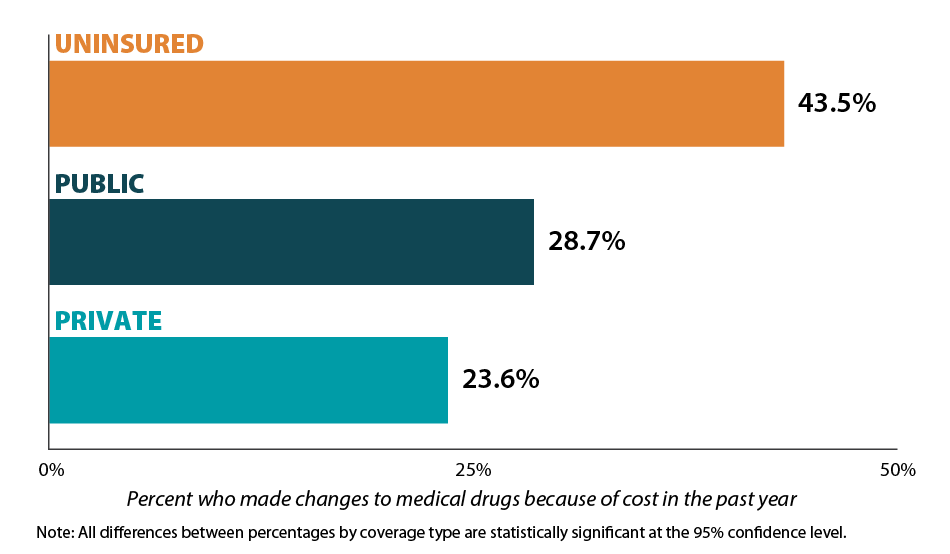
Those with health insurance are less likely to have made changes to drugs due to cost
Individuals with health insurance coverage were less likely to have made changes to medical drugs due to cost compared with uninsured individuals in 2016. At the national level, the share of the population that reported making changes to medical drugs due to cost was 23.6% for non-elderly adults with private coverage, 28.7% for non-elderly adults with public coverage, and 43.5% for non-elderly adults with no coverage. This represents a gap of 19.9 percentage points between private coverage and no coverage.[3]
Percent Who Made Changes to Medical Drugs Because of Cost by Coverage Type, 2016
Notes and Definitions
Made Changes to Medical Drugs is defined as the rate of individuals who made changes to medical drugs because of cost during the past twelve months by age for the civilian non-institutionalized population. This includes asking the doctor for cheaper medications, delaying refills, taking less medication than prescribed, skipping dosages, using alternative therapies, and/or buying medications out of the country.
The source of the estimates is SHADAC analysis of NHIS data, National Center for Health Statistics (NCHS). The NHIS sample is drawn from the Integrated Health Interview Survey (IHIS, MN Population Center and SHADAC). Data were analyzed at the University of Minnesota's Census Research Data Center because state identifiers were needed to produce results and these variables were restricted.
Estimates were created using the NHIS survey weights, which are calibrated to the total U.S. Civilian non-institutionalized population for estimates broken down by age, and to the civilian non-institutionalized population age 18 to 64 for estimates broken down by coverage type.
Though SHADAC goes to great effort to produce as many state-level estimates as possible for our measures, due to sample size restrictions many state estimates of this measure are suppressed when broken down by coverage type. Namely, estimates are suppressed if the number of sample cases was too small or the estimate had a relative standard error greater than 30 percent. Among those with private coverage, 46 state estimates are available; among those with public coverage, 7 state estimates are available; and among the uninsured, 2 state estimates are available.
Other State Health Compare estimates that use data from the NHIS
Made Changes to Medical Drugs is one of eight State Health Compare measures that SHADAC produces using data from the NHIS listed below. State Health Compare is the only source for state-level estimates of these measures.
- Made Changes to Medical Drugs
- Trouble Paying Medical Bills
- No Trouble Finding Doctor
- Told that Provider Accepts Insurance
- Had Usual Source of Medical Care
- Had General Doctor or Provider Visit
- Had Emergency Department Visit
- Spent the Night in a Hospital
[1] Roehing, C. May 2018. Projections of the Prescription Drug Share of National Health Expenditures Including Non-Retail. Altarum Report. Available at: https://altarum.org/sites/default/files/uploaded-publication-files/Projections_of_the_Prescription_Drug_Share_of_National_Health_Expenditures_June_2018.pdf
Blog & News
MACStats from MACPAC: 2018 Medicaid and CHIP Data Book Now Available
February 1, 2019: The Medicaid and CHIP Payment and Access Commission (MACPAC) recently released the 2018 version of its Medicaid and CHIP Data Book. This data book is a collection of federal and state statistics regarding the Medicaid and CHIP programs that are compiled by MACPAC from multiple data sources on key topic areas including Medicaid and CHIP eligibility, enrollment, and expenditures, as well as beneficiary health, service use, and access to care. An excellent resource, the data book draws on a wide variety of data sources including Medicaid administrative data (e.g., CMS-64 data, MSIS data, Medicaid Managed Care enrollment reports, etc.) as well as federal survey data in order to compile policy relevant, but difficult to access, information about the Medicaid and CHIP programs into one comprehensive tool.
SHADAC is excited to be among the contractors that contributed to this product, providing MACPAC with estimates from the National Health Insurance Survey (NHIS) and the Medical Expenditure Panel Survey (MEPS) that highlight individual enrollment, primary source of insurance coverage, and service use and access to care with breakdowns available by age, demographics, and health characteristics. SHADAC produced these estimates using data for years 2016 and 2017, which are the latest available respectively for each survey.
For additional information on data methods and sources used in the data book, see MACPAC’s Technical Guide to MACStats, which provides supplementary information to help readers interpret the exhibits in the MACStats tables and figures as well as to understand the data sources and methods used.
Blog & News
Register Now: February 6th Webinar - Exploring Disparities Using SHADAC's State Health Compare
January 28, 2019:Exploring Disparities Using New and Updated Measures on SHADAC’s State Health Compare: State-Level Highlights for Unaffordable Rents, Unhealthy Days, and More
Date: February 6, 2019
Time: 1:00 p.m. – 2:00 p.m. Central
Register now.

Join us on Wednesday, February 6th at 1:00 PM Central for a webinar introducing two new measures of health outcomes and social determinants of health on SHADAC’s State Health Compare—Unhealthy Days and Unaffordable Rents. This presentation, hosted by SHADAC researchers Brett Fried and Robert Hest, will examine these new measures and highlight how the estimates can be used to explore disparities between states and among sub-populations.
 The webinar will also provide a virtual tour of some of the more than 40 state-level measures currently available on State Health Compare, highlighting recently updated data in particular. Mr. Fried and Mr. Hest will demonstrate how users can employ State Health Compare to easily create compelling maps, charts, and graphs, as well as download the raw estimates to perform deeper analyses and statistical testing.
SHADAC researchers will answer questions from attendees after the presentation.
Adult Unhealthy Days: A New Measure on State Health Compare
SHADAC Blog
Housing Affordability Matters: Measuring and Addressing the Burden of Unaffordable Rents
SHADAC Blog
Examining Unaffordable Rents as a Social Determinant of Health
SHADAC Publication - Infographics
Significance Testing Using State Health Compare
SHADAC Brief
Blog & News
Now Available on State Health Compare: Updated Measures on Public Health, Health Outcomes, and Access, Cost, and Utilization of Care
December 12, 2018:SHADAC has updated eight data measures with the latest available estimates on our State Health Compare site. The updated measures include:
This measure indicates an individual state’s share of public health funding for the previous fiscal year. Data is available from 2005-2017, excepting in 2006 when data is not available.
This measure highlights the percent of people who made changes to their medical drugs due to cost in the past year. Breakdowns by age and coverage type are available for each state from 2011-2016.
This measure shows the percent of people who did not have trouble finding a doctor in the past year. The measure can be broken down by age and coverage type, and is now available from 2011 through 2016.
This measure captures the percent of persons who reported that their provider did accept their insurance type in the past year. The measure is available for 2011-2016 and can be broken down by age and coverage type as well.
Available for years 2011-2016, this measure counts the percent of people who had a usual source of medical care other than the emergency department (i.e., doctor’s office, clinic, health center, etc.) in the past year. Breakdowns by age and coverage type are also available.
This measure indicates the percent of adults who reported having a general doctor or provider visit in the past year. This measure can be broken down by age coverage type, and is available for all states from 2011 through 2016.
This measure, indicates the rates of individuals who reported a visit to the emergency department during the past twelve months for any reason and can be broken down by age and coverage type. Estimates are available from 2011-2016.
This measure denotes the rate of individuals who reported spending the night in a hospital at least once over the past year and can be broken down by age and coverage type. The measure is available from 2011-2016 for all states.
Explore these updated estimates on State Health Compare.
Data Sources
The State Health Compare estimates for public health funding come from Trust for America’s Health (TFAH) and all other measures regarding adults who made changes to medical drugs, had no trouble finding a doctor, are told that their provider accepts their insurance, had a usual source of medical care, had a general doctor or provider visit, had an emergency department visit, or spent the night in a hospital over the past year come from the National Health Interview Survey (NHIS).
Blog & News
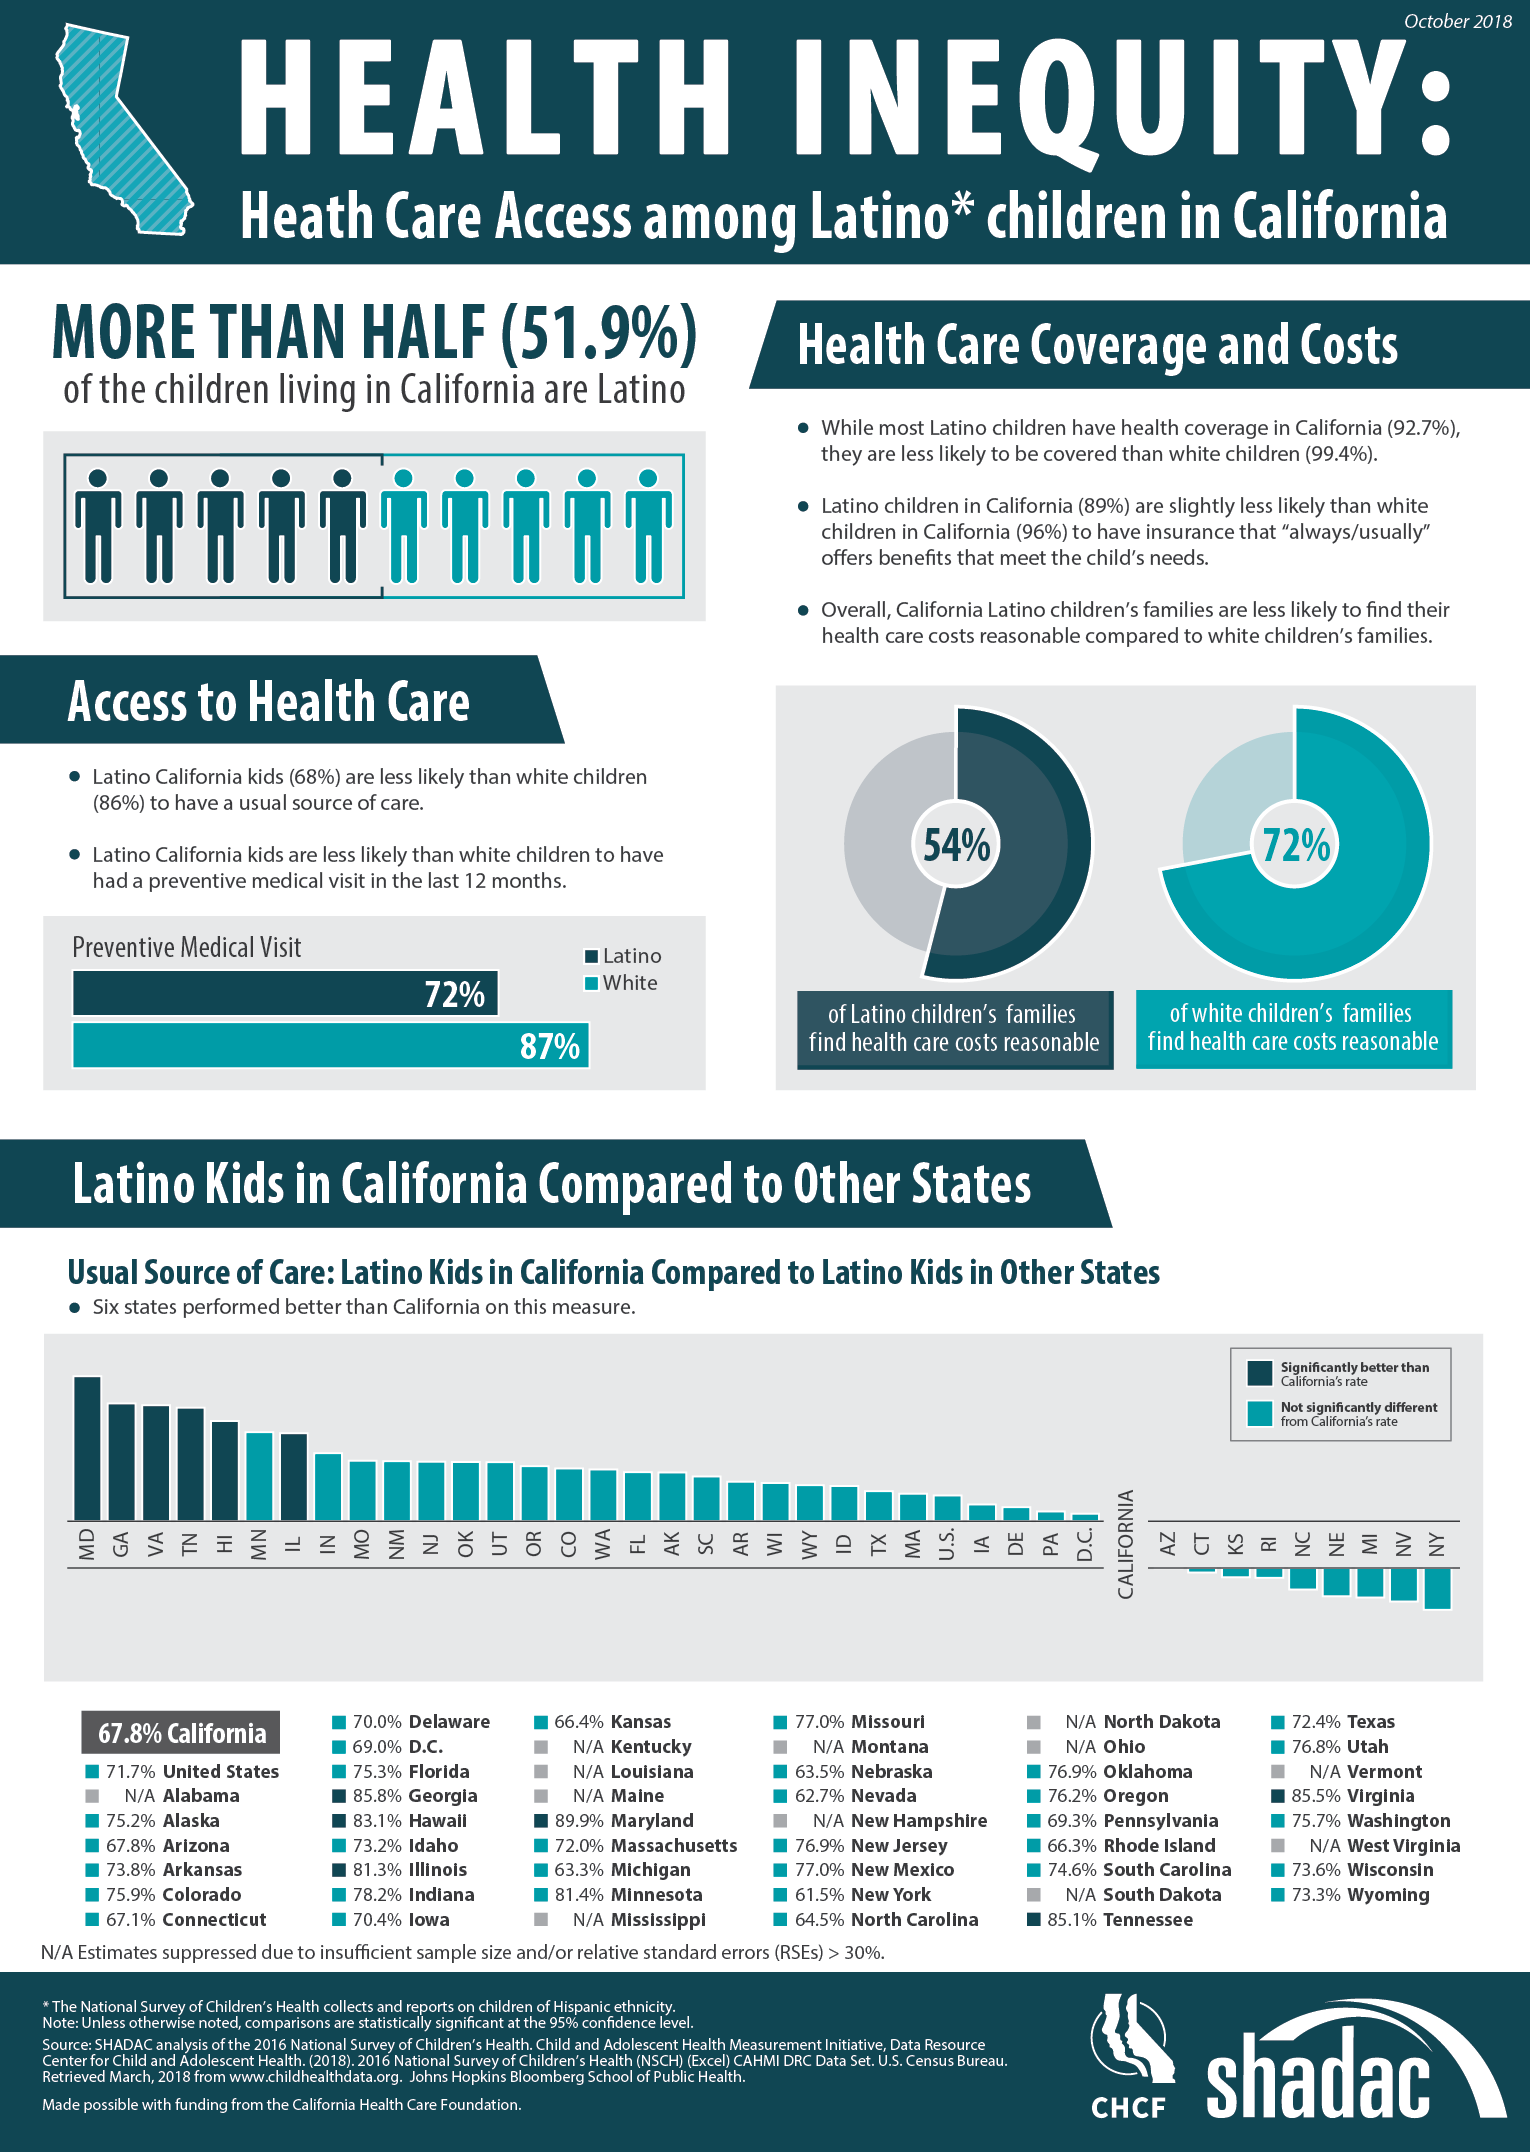
Latino Children in California Face Inequitable Access to Care (Infographic)
October 31, 2018:According to the 2016 National Survey of Children’s Health (NSCH), Latino children in California face lower access to health care than their white counterparts across multiple access indicators.
Despite representing more than half of children living in the state, Latino children are less likely than white children to: have health insurance coverage, have insurance benefits that meet their needs, find their health care costs reasonable, have a usual source of care, and have had a preventive medical visit in the last twelve months. The infographic presented here illustrates the 2016 NSCH estimates for these measures for both Latino and white children and also compares California’s performance to other states on the percentage of Latino children who have a usual source of care.
About the Data
The National Survey of Children’s Health is an annual survey funded and directed by the Health Resources and Services Administration (HRSA) Maternal and Child Health Bureau (MCHB). Learn more about the NSCH at www.childhealthdata.org.