
Include Social and Economic Factors
Blog & News


Examining Gender-Based Discrimination in Health Care Access by Gender Identity in Minnesota
December 9, 2022:Authors: Jeremy Duval, Natalie Mac Arthur, Kathleen Call
DefinitionsCisgender/cis: A person whose gender identity corresponds with their sex assigned at birth. Transgender/trans: A person whose gender identity differs from their sex assigned at birth. Non-binary: An umbrella term for a person whose gender identity is not binary (male or female). |
Introduction
Many barriers exist to creating an equitable health care experience for LGBTQ+ individuals. One critical barrier is gender-based discrimination from providers within health care systems. The biennial 2021 Minnesota Health Access Survey (MNHA) asked respondents how often their gender, sexual orientation, gender identity, or gender expression causes health care providers to treat them unfairly. We compared rates of gender-based discrimination and health care access in the Minnesota adult population and examined differences in access to care among cisgender (cis) and gender minorities who report gender-based discrimination (see Definition Box). We explored the impact of gender-based discrimination on health care access by comparing access rates among people who did and did not experience discrimination for cis men, cis women, transgender and non-binary populations in Minnesota.
Results
The majority (58.9%) of transgender (trans) and non-binary respondents reported experiencing gender-based discrimination from health care providers in 2021—a stark contrast from the statewide average of 6.0% (Figure 1). Cis women also reported gender-based discrimination (7.7%) above the population average, while cis men were less likely to experience this form of discrimination (2.9%). Gender-based discrimination was especially high for both non-binary (63.9%) and trans (48.8%) respondents. Due to sample size limitations, these populations were combined in the remainder of our analyses.
Figure 1. Unfair treatment from health care providers based on gender in Minnesota
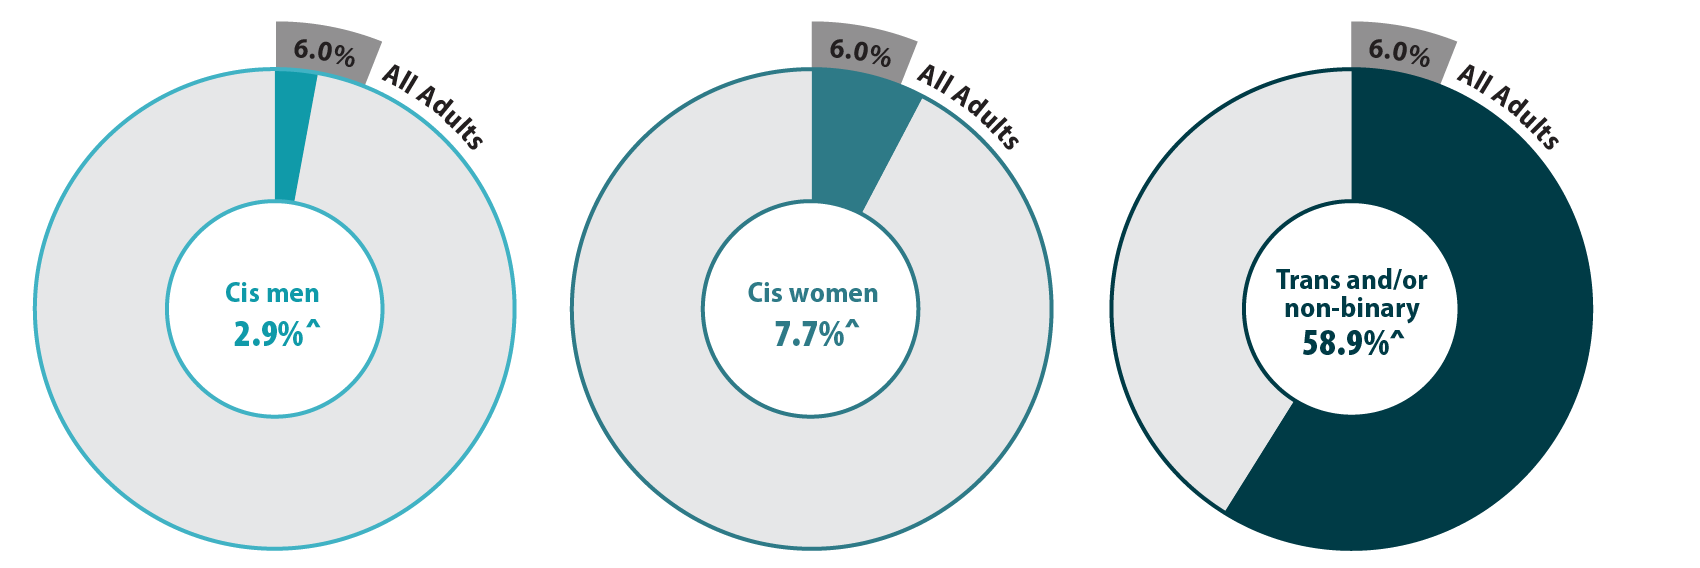
^ Rate significantly different from All Adults at the 95% confidence level.
Source: SHADAC analysis of the 2021 Minnesota Health Access Survey.
We also found differences in health care access among trans and non-binary people compared with the adult Minnesota population, particularly for confidence in getting care and forgoing needed care due to cost (Figure 2). We found that trans and non-binary respondents were similar to cis men in rates of having a usual source of care and having a medical visit (non-emergency) in the past year. Compared with the adult population in Minnesota, cis men were more likely to lack these forms of care, while cis women had better access to regular medical visits and a usual source of care. However, differences from the state average did not reach significance for trans and non-binary respondents, likely due to small sample size. Nearly a third (30.1%) of trans and non-binary adults had low confidence in getting necessary care compared to an average of 11.8% for adults in Minnesota. Over half (57.1%) of trans and non-binary people reported forgone care—more than double the average (26.2%).
Figure 2. Health care use and barriers to care
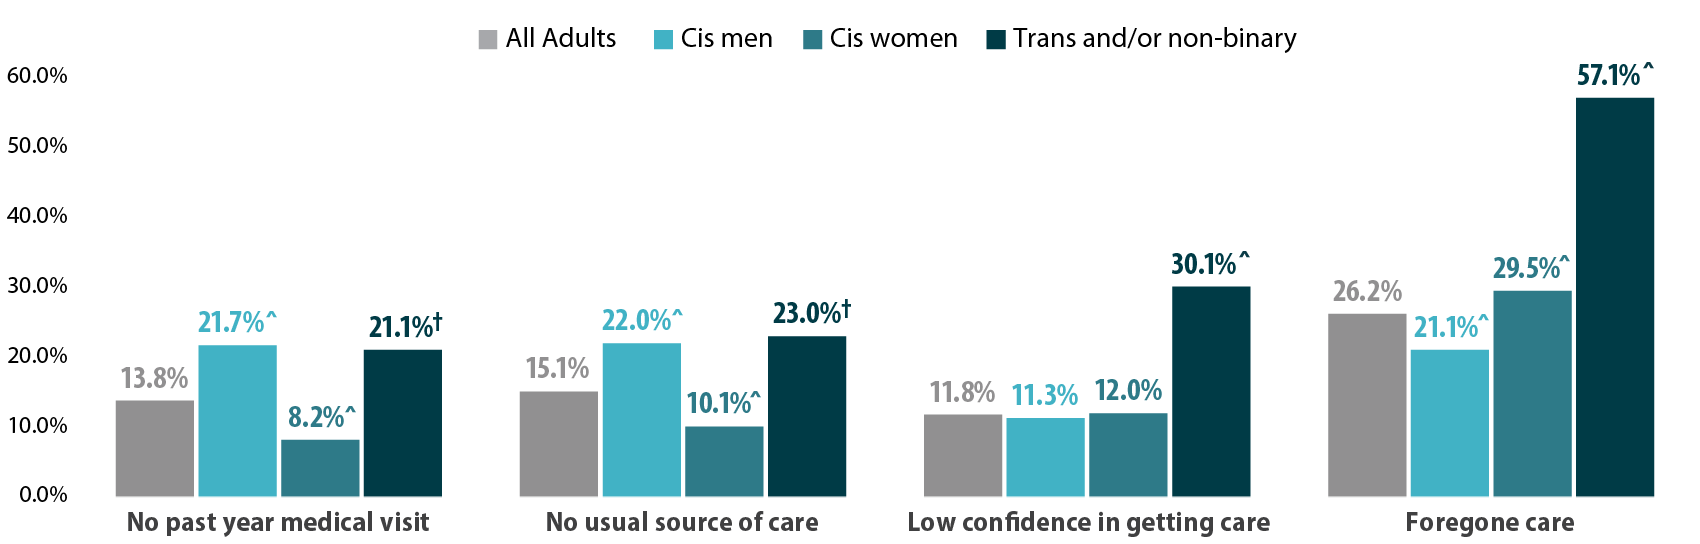
^ Rate significantly different from All Adults at the 95% confidence level.
† Estimate may be unreliable due to limited data (relative standard error greater than or equal to 30%).
Source: SHADAC analysis of the 2021 Minnesota Health Access Survey.
Figure 3. Experiences of gender-based discrimination associated with barriers to health care access
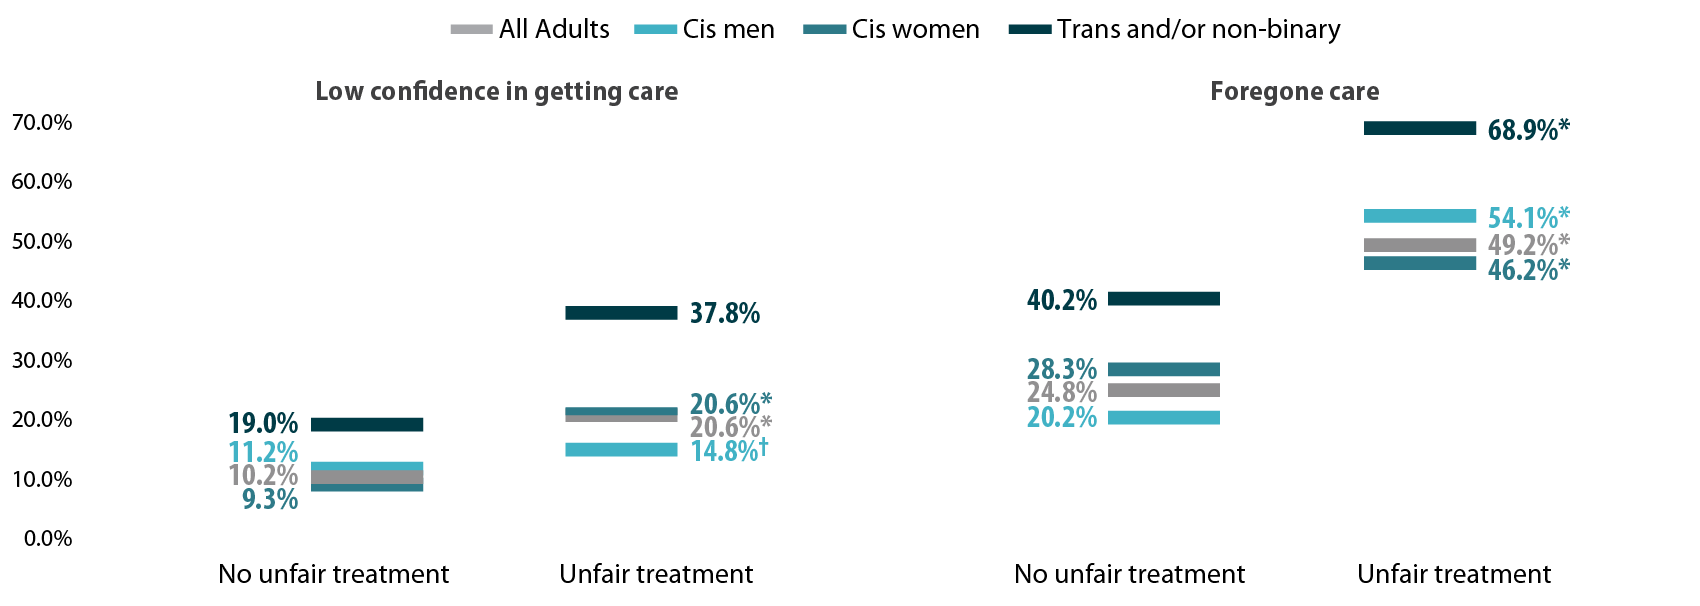
* Significant difference within a given subpopulation between rates of people who experienced unfair treatment and those who did not.
† Estimate may be unreliable due to limited data (relative standard error greater than or equal to 30%).
Source: SHADAC analysis of the 2021 Minnesota Health Access Survey.
Discussion
A worryingly high proportion of trans and non-binary adults reported gender-based discrimination and had forgone care or did not have confidence in getting needed care. This lack of confidence could be in part due to experienced or anticipated discrimination within a health care setting. Barriers to care were especially high among those who had experienced gender-based discrimination, which suggests that discrimination has a serious negative impact on health care access for trans and non-binary people.
We found higher rates of gender-based discrimination (58.9%) among trans and non-binary adults in Minnesota in 2021 compared to previously published literature on gender-based discrimination. National data indicate that between 20% and 40% of LGBTQ+ Americans experience discrimination while accessing health services (Kattari & Hasche, 2016), (Kachen & Pharr, 2020), (Penrose et al, 2020), (Rodriguez, Agardh & Asamoah, 2018), (Shires & Jaffee, 2015). Additionally, over 20% of the LGBTQ+ population avoided seeking health care due to anticipated discrimination (Kcomt et al, 2020). Notably, the majority of previously published estimates of trans peoples’ experiences of health care discrimination come from the National Transgender Discrimination Survey, which was conducted in 2016 and provides rich data, but for a specialized and non-probability sample. Such data are not considered generalizable. A strength of the MNHA survey is that it measures discrimination using a probability sample of adults reporting their gender identity.
Gender-based discrimination is just one factor affecting health care access. Gender minorities may additionally face disproportionate rates of other key barriers to access, such as lack of insurance coverage (Gonzales & Henning-Smith, 2017). Regardless, we found large gaps in health care access for trans people, non-binary people, and all people who experienced gender-based discrimination.
Conclusion
When the majority of a population is experiencing discrimination within health care systems, it is clear that change is necessary. Our data, based on a probability sample of Minnesotans, helps address gaps in knowledge about barriers transgender and non-binary adults face in accessing health care. The high rates of gender-based discrimination among gender minorities illustrate that gender-inclusive data collection is important for health equity.
However, quantifying rates of discrimination only scratches the surface of the true problem. Because of the limited sample size of gender minority adults, we were unable to explore the role of other social factors in gender-based discrimination and health care barriers by gender identity. Race, ethnicity, and class likely intersect to exacerbate experiences of discrimination and barriers to care for gender minorities. For example, Black and American Indian/Alaskan Native transgender women face disproportionate rates of victimization, and these experiences may impact their health care needs and intensify barriers to accessing care (Reisner, 2018). In this analysis, we only looked at gender identity; our future studies will look at sexual orientation with a similar lens and examine these two together.
One of the largest barriers to understanding discrimination and its effects on health access is data collection. Not all surveys collect and report inclusive data on gender identity, which makes it very hard to track access for trans and non-binary people. Even when gender-inclusive data are available, gender-based discrimination is rarely measured. Direct measurement of discrimination is essential for monitoring rates of discrimination in health care settings and associated barriers to care (Lett et al., 2022).
In Minnesota, state-level policies make this type of measurement possible. Historically, Minnesota has strong anti-discrimination laws in place to protect gender-diverse individuals. For example, Minnesota was one of the first states to allow an “X” option for gender on licenses (Walsh, 2018). Yet, we found alarmingly high reports of gender-based discrimination in health care among gender minorities in this state. The level of gender-based discrimination may be even higher in other states with less inclusive policies. Consequently, our results suggest that on a national level, gender-based discrimination in health care may affect a substantial number of Americans.
Understanding the full scope of gender-based discrimination in Minnesota and across the U.S. should be a priority in future research to support health equity. Our data contributes to the base of knowledge regarding gender-based discrimination in health care and its correlation with issues of health care access. Our findings highlight the need for more expansive research and policy changes in these areas.
Methods
Data are from the 2021 Minnesota Health Access (MNHA) survey, which is a biennial population-based survey on health insurance coverage and access conducted in collaboration with the Minnesota Department of Health. We limited the analysis to adults responding for themselves about experiences of discrimination and access (n=10,003); we excluded proxy reports (e.g., a household member answering for a spouse or roommate). Tests for statistical significance were conducted at the 95% confidence level.
Check out our companion blog "Examining Discrimination and Health Care Access by Sexual Orientation in Minnesota".
References
Gonzales, G., & Henning-Smith, C. (2017). Barriers to Care Among Transgender and Gender Nonconforming Adults. The Milbank quarterly, 95(4), 726–748. https://doi.org/10.1111/1468-0009.12297
Kachen, A., & Pharr, J. R. (2020). Health Care Access and Utilization by Transgender Populations: A United States Transgender Survey Study. Transgender health, 5(3), 141–148. https://doi.org/10.1089/trgh.2020.0017
Kattari, S. K., & Hasche, L. (2016). Differences Across Age Groups in Transgender and Gender Non-Conforming People's Experiences of Health Care Discrimination, Harassment, and Victimization. Journal of aging and health, 28(2), 285–306. https://doi.org/10.1177/0898264315590228
Lett E., Asabor E., Beltrán S., Cannon A.M., Arah O.A. (2022). Conceptualizing, Contextualizing, and Operationalizing Race in Quantitative Health Sciences Research. Ann Fam Med 20(2):157-163. https://doi.org/10.1370/afm.2792
Movement Advancement Project. "Equality Maps: Housing Nondiscrimination Laws." https://www.lgbtmap.org/equality-maps/non_discrimination_laws/housing. Accessed 11/07/2022.
Reisner, S. L., Bailey, Z., & Sevelius, J. (2014). Racial/ethnic disparities in history of incarceration, experiences of victimization, and associated health indicators among transgender women in the US. Women & health, 54(8), 750-767.
Shires, D. A., & Jaffee, K. (2015). Factors associated with health care discrimination experiences among a national sample of female-to-male transgender individuals. Health & social work, 40(2), 134–141. https://doi.org/10.1093/hsw/hlv025
Walsh, P. (2018, October 3). Minnesota Now Offers 'X' for Gender Option on Driver's Licenses. Star Tribune. Retrieved November 9, 2022, from https://www.startribune.com/minnesota-now-offers-x-for-gender-option-on-driver-s-licenses/494909961/.
Blog & News

Neighborhood Support Matters for Child Health
November 22, 2022:Where people live, work, and play has been shown to have important impacts on health. In addition to one’s physical environment (e.g., access to safe schools, parks, and sources of nutritious food), the extent to which people feel connected to a supportive community with a network of resources is an important factor for health. This concept is known as “social capital," and has been linked with a broad range of health outcomes including mortality.
Neighborhood support is a form of social capital that can be measured with available survey data. The National Survey of Children’s Health (NSCH) is nationally representative and includes children (age 0-17) in all 50 states and the District of Columbia. The data from this survey provide information on family perceptions of neighborhood support and a broad range of child sociodemographic and health characteristics. NSCH data also allow researchers to study the association between supportive neighborhoods and key children’s health outcomes.
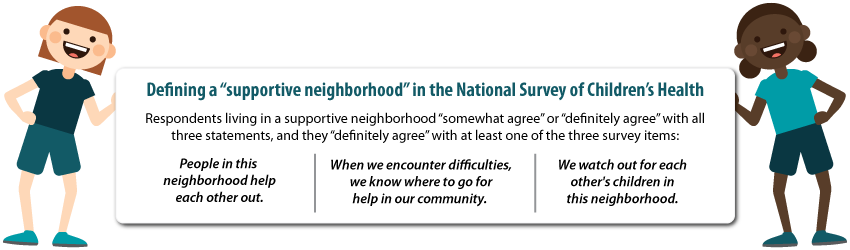
Only about half (55%) of children lived in a supportive neighborhood. As shown in the figure below, the likelihood of living in a supportive neighborhood also varied across population subgroups. Perceived neighborhood support was less likely for non-English households, children of color, children with special health care needs (CSHCN), families with less education or income, and children with public health insurance coverage or who were uninsured.
Percent of children living in supportive neighborhoods, by child characteristics
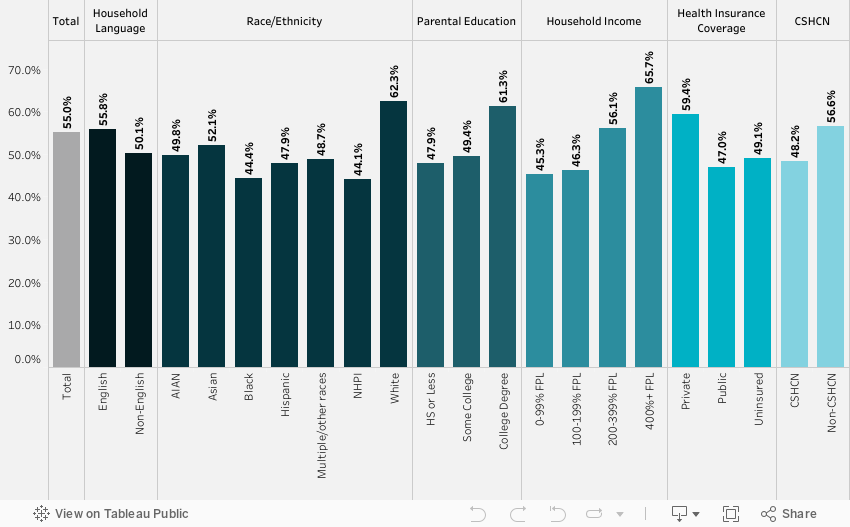
Source: SHADAC analysis of the National Survey of Children’s Health, 2018-2019
We found that neighborhood support matters for a child’s health. Family perceptions of neighborhood support were significantly associated with four of the five outcomes we examined, after adjusting for child characteristics. Children in supportive neighborhoods were less likely to have a past year emergency department visit or unmet care needs and were more likely to have a preventive dental visit and better parent-reported oral health status (Table below).
| Past year ED visit odds ratio | Unmet health needs odds ratio | Preventive dental visit odds ratio | Fair/poor health odds ratio | Fair/poor oral health odds ratio | |
| Neighborhood support | 0.89* | 0.52*** | 1.16** | 0.72 | 0.65*** |
Notes: *** p<0.001, ** p<0.01, * p<0.05 Unmet health care needs included medical, dental, hearing, vision, or mental health needs. All models were adjusted for demographic characteristics (age, sex, race/ethnicity, household language, income, parental education), children with special healthcare needs (based on a five-item screener), health insurance coverage, and a composite measure of family resilience. Resilience was defined by how families face problems, with ‘all of the time’ or ‘most of the time’ responses to four items: talk together, work together, draw on strengths, stay hopeful.
Our study provides evidence that neighborhood cohesion is correlated with better child health outcomes. Policies that support healthy neighborhoods and build social capital are essential for the wellbeing of children. This includes policies that benefit child development, such as neighborhood schools, playgrounds, and early childhood education. Community-based programs and health care also play a role in fostering neighborhood support by strengthening networks and linking community members to needed care and resources.
NSCH dataset provided by the Data Resource Center:
Child and Adolescent Health Measurement Initiative. 2018-2019 National Survey of Children’s Health (NSCH) Stata Constructed DataSet. Data Resource Center for Child and Adolescent Health supported by Cooperative Agreement U59MC27866 from the U.S. Department of Health and Human Services, Health Resources and Services Administration (HRSA), Maternal and Child Health Bureau (MCHB). Retrieved from www.childhealthdata.org.
Blog & News

State Health Compare Adds New Social Determinants Measure: Percent of Children with Adverse Childhood Experiences
September 14, 2020:A new State Health Compare measure examines the prevalence and degree of adverse childhood experiences (ACEs) among different demographic groups, with estimates available across the states and over time.
What are ACEs?
The Centers for Disease Control and Prevention (CDC) defines ACEs as “potentially traumatic events that occur in childhood (0-17 years)” including experiencing violence, abuse, or neglect; witnessing violence in the home or community; or having a family member attempt or die by suicide. ACEs also include “aspects of the child’s environment that can undermine their sense
of safety, stability, and bonding,” such growing up in a household with substance misuse, mental health problems, and instability due to parental separation or household members being in jail or prison.i
Why are ACEs Important?
A landmark study conducted in the 1990s found a significant relationship between the number of ACEs an individual experienced and a variety of negative outcomes in adulthood, including poor physical and mental health, substance abuse, and risky behaviors (e.g., smoking, having a history of sexually transmitted disease/infection, etc.). The more ACEs an individual experienced, the greater the risk of these outcomes.ii Because ACEs are common, with about 61% of adults reporting at least one type of ACE and nearly one in six reporting four or more types of ACEs, preventing ACEs
could reduce a large number of negative physical and behavioral health outcomes.iii
How Can We Prevent ACEs?
Creating and sustaining safe, stable, nurturing relationships and environments for children and families can prevent ACEs.iv Data on the prevalence and severity of ACEs among different groups can help policymakers and public health professionals target prevention efforts effectively so that resources are efficiently leveraged to support these relationships and environments where they are most needed.
What Can We Learn from the State Health Compare Estimates?
The ACEs estimates presented in State Health Compare indicate the percent of children with no ACEs, the percent of children with one ACE, and the percent of children with multiple ACEs. Breakdowns are available by age, insurance coverage type, education, poverty level, and race/ethnicity. Available time periods are the two-year pooled periods of 2016-2017 and 2017-2018
Children with ACEs: Data Highlights
Nationwide, an estimated 18.6% of all children (age 0-17) had multiple ACEs in 2017-2018, 23.3% had one ACE, and 58.2% had zero ACEs. The following section takes a quick dive into the percentages of children with multiple ACEs to highlight some of the subgroup analyses that are available using State Health Compare.
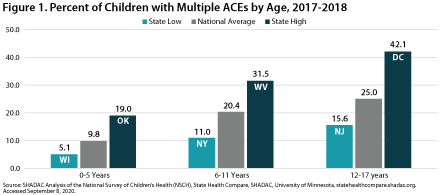
Percent of Children with Multiple ACEs: By Age Group
Figure 1 shows the national rates of children with multiple ACEs and state high and low rates for different age groups of children, with rates tending to be higher among older children and lower among younger children. Overall, the lowest percentage of children with multiple ACEs by age was 5.1% among 0-5 year-olds in Wisconsin, and the highest percentage was 42.1% among 12-17 year-olds in the District of Columbia (DC).
Percent of Children with Multiple ACEs: By Race/Ethnicity
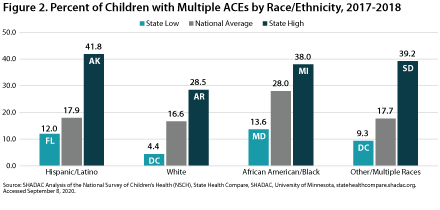 Figure 2 shows the national rates and state high and low rates for children with multiple ACEs by race/ethnicity in 2017-2018. When examining the national rate of children with multiple ACEs by race/ethnicity, as well as state-level highs and lows for this measure, White children consistently ranked at the bottom, with the lowest percentage being 4.4% among White children living in DC. The highest nation- wide percentage of children with multiple ACEs by race/ethnicity was among African American/Black children, of whom 28% had more than one ACE. The highest state-level percentage was 41.8% among Hispanic/Latino children living in Alaska.
Percent of Children with Multiple ACEs: By Insurance Coverage Type
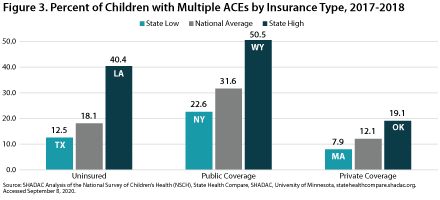 Figure 3 shows the percentage of children with two or more ACEs according to insurance status in 2017-2018. Nationwide, the highest proportion of children reporting multiple ACEs was among those with public coverage, at 31.6 percent. This is more than 2.5 times the nationwide low of 12.1 percent among children with private coverage. At the state level, a low of 7.9 percent of privately insured children in Massachusetts reported multiple ACEs, versus a high of 50.5 percent of publicly insured children in Wyoming.
Percent of Children with Multiple ACEs: By Poverty Level
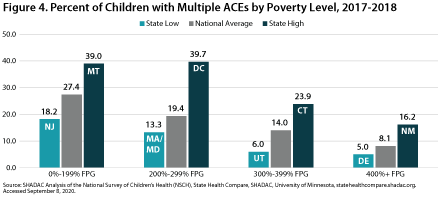 Figure 4 shows the prevalence of multiple ACEs by poverty level in 2017-2018. The national percentage of children who had multiple ACEs by poverty level was highest among children at 0 to 199 FPG at 27.4 percent. This proportion was lowest among children in household with incomes at or above 400 percent of the Federal Poverty Guideline (FPG) at 8.1 percent—a 19.3 percentage-point difference from the rate for high-income children. At the state level, the highest percentages of children with multiple ACES by poverty level were 39.7 percent among children at 200 to 299 percent FPG living in DC and 39.0 percent among children at 0 to 199 percent FPG living in Montana. The state low for multiple
ACEs by poverty level was 5.0 percent among children at
or above 400 percent FPG living in Delaware.
Learn More
To explore State Health Compare’s ACEs estimates further, visit State Health Compare at statehealthcompare.shadac.org and click on “Explore Data.”
Other social and economic factors that can be explored through State Health Compare include:
i Centers for Disease Control and Prevention (CDC). (April 2020). “Preventing Adverse Childhood Experiences.” Available at https://www.cdc.gov/violenceprevention/acestudy/fastfact.html?CDC_AA_refVal=https%3A%2F%2Fwww.cdc.gov%2Fviolenceprevention%2Fchildabuseandneglect%2Faces%2Ffastfact.html
ii Felitti, V.J., Anda, R.F., Nordenberg, D., Edwards, B.A., Koss, M.P., Marks, J.S. (May 1998). “Relationship of Childhood Abuse and Household Dysfunction to Many of the Leading Causes of Death in Adults.” American Journal of Preventive Medicine 14(4): 245-258. DOI: 10.1016/S0749-3797(98)00017-8.
iii Centers for Disease Control and Prevention (CDC). (April 2020). “Preventing Adverse Childhood Experiences.” Available at https://www.cdc.gov/violenceprevention/acestudy/fastfact.html?CDC_AA_refVal=https%3A%2F%2Fwww.cdc.gov%2Fviolenceprevention%2Fchildabuseandneglect%2Faces%2Ffastfact.html
iv Ibid.
Blog & News
New Brief Explores State Approaches to Risk Adjustment Based on Social Factors and Strategies for Filling Data Gaps
August 2020: The role that social factors, such as housing instability, food insecurity, and access to transportation, have in influencing health has been a growing focus in health policy and health care. However, the concept of “social determinants of health” (SDOH), the idea that individuals have unique circumstances that can affect their health care outcomes, is not new to health care. In fact, the concept of “social determinants of health” (SDOH)—the idea that individual’s social circumstances can affect their health—is being used in some states to augment existing health care risk-adjustment tools, which are often used in setting payment rates or calculating performance on quality measures.
A new State Health & Value Strategies (SHVS) brief, authored by SHADAC researchers, details three approaches taken by organizations in two states, Minnesota and Massachusetts, to solving a key challenge to risk adjusting based on social factors: Where to find data on social risk factors? The brief’s profiled examples employed three approaches to filling the data gap—using survey data, using claims and administrative data, and using a combination of both.
Minnesota Medicaid ACO
In 2018, Minnesota launched an update to the state Medicaid program’s accountable care organization (ACO) model, known as “Integrated Health Partnerships” (IHPs). Among other changes, the updated IHP program introduced a new population-based payment that is now adjusted based on the social risk factors (in addition to medical conditions) of IHP program beneficiaries. The rationale for the change was to support activities typically not reimbursed by Medicaid, recognizing that some beneficiaries have greater risk factors—including social risk factors.
To create its new risk-adjustment methodology, Minnesota leaned on earlier research conducted by state Medicaid staff that had used claims and other administrative data to study the relationship between social risk factors and health outcomes. Informed by that research, the state developed a risk-adjustment approach that used beneficiary-level claims and administrative records that would adjust payments based on records of individual beneficiaries’ own social risk factors, such as an income level that would be considered as “deep poverty” (based on Medicaid eligibility data) and homelessness (based on self-reported information or analysis of beneficiary addresses).
Minnesota Community Measurement
Another entity in the same state, Minnesota Community Measurement (MNCM), is a non-profit organization that collects, analyzes, and publishes health care quality and cost data. MNCM undertook an effort to incorporate social risk factors into its risk-adjustment approach based on recommendations from the organization’s board of directors and another stakeholder committee.
Unlike Medicaid agencies, MNCM does not have access to detailed data on individual patients beyond basic demographics. However, because health care providers report ZIP codes for individual patients to MNCM, they were able to develop a geographically based index measure drawn from the U.S. Census Bureau’s American Community Survey (ACS), using the social risk factors associated with the ZIP codes where individual patients live as a proxy for their own social risk factors. Although it is not a Medicaid agency, the approach used by MNCM to risk adjust based on social risk factors could be readily duplicated by a state Medicaid agency because it uses publically available data.
Massachusetts Medicaid ACO and MCO
In Massachusetts, the state’s Medicaid program has incorporated measures of beneficiaries’ social risk factors into its methodology for risk adjusting payments to Medicaid Managed Care Organizations (MCOs) since 2016 and Accountable Care Organizations (ACOs) since 2018. Part of the state’s rationale for accounting for social risk factors in its payments to MCOs and ACOs was to “mitigate the incentive (they) might otherwise have to limit care or avoid members with greater health care needs,” recognizing that individuals with social risk factors may face additional needs and greater challenges to optimal health outcomes.1,2
Unlike the prior examples, Massachusetts has developed a hybrid approach using both administrative and survey data. Similar to Minnesota Medicaid, Massachusetts uses various elements of Medicaid claims data and administrative data tied to individual beneficiaries from within the Medicaid agency and other departments, such as data on disability status and housing instability. And similar to MNCM, Massachusetts created a geographically based index of other social risk factors using data from the ACS. By using those dual approaches, Massachusetts was able to fill more gaps in social risk factor data than either single data source was able to address on its own.
Massachusetts also took an initial step toward collecting new data on individual beneficiaries’ own social risk factors. The state began using ICD-10 Z-codes for homelessness as part of its methodology for risk adjusting based on social factors. Although Z-codes for homelessness already existed, using them as part of the state’s risk adjustment methodology—which informs payments to health care providers—gives providers an incentive for reliably screening for and documenting whether individual patients are experiencing homelessness.
Key takeaways
A key challenge to risk adjusting based on social factors is obtaining data regarding patients’ relevant social risk factors. To address that limitation, the three examples profiled in this brief highlight possible approaches to filling those gaps that other states’ Medicaid programs could reproduce or build from:
- Using survey data as a proxy for individuals’ own social risk factors;
- Repurposing existing administrative data pertaining to social risk factors;
- And taking initial steps toward collecting data on social risk factors, such as through systematic use of billing Z-codes.
1 Seifert, R.W., & Love, K.A. (2018). What to know about ACOs: An Introduction to MassHealth Accountable Care Organizations. Retrieved from https://www.bluecrossmafoundation.org/sites/default/files/download/publication/ACO_Primer_July2018_Final.pdf
2 Massachusetts’ revised risk adjustment methodology also includes some measures that are not necessarily social risk factors, such as interaction measures specific to children—ages 0-14 and 15-20—between age and medical risk scores, to account for the particular health care costs for children with complex medical situations compared to healthy children.
Publication
Leveraging American Community Survey (ACS) Data to Address Social Determinants of Health and Advance Health Equity
 In a new issue brief for the Robert Wood Johnson Foundation’s State Health and Value Strategies, SHADAC Senior Researchers Lacey Hartman, MPP, Elizabeth Lukanen, MPH, and Colin Planalp, MPA explain how researchers and policymakers can leverage federal survey data to inform and target interventions that seek to address social determinants of health and advance health equity.
About the Issue Brief
As state Medicaid programs increasingly seek to understand and address social factors that contribute to poor health, they need data in order to identify priority areas of unmet social and economic needs, to execute SDOH initiatives, and to monitor and evaluate the impacts of these programs.
While Medicaid programs can choose to utilize data from a broad array of sources, this brief highlights several advantages to using data from one federal survey, the American Community Survey (ACS), to inform and target interventions that seek to address social determinants of health and advance health equity. The ACS contains a vast range of variables relevant to social determinants of health including but not limited to; food insecurity, unstable housing, and lack of access to social supports, and has a large sample size that supports estimates for smaller subpopulations.
This brief provides an overview of select social determinants of health measures and examples of how the data could be used to address questions and evaluate interventions related to housing, transportation, and nutrition. It also provides examples of states that use SDOH and health equity measures from the ACS, including which measures are used and what they are used for.
Access the new “Leveraging American Community Survey (ACS) Data to Address Social Determinants of Health and Advance Health Equity” brief in full to read more about how researchers can use federal-level SDOH survey data to advance health equity. Readers can also download the brief, along with a companion toolkit that includes a detailed data dictionary.
Support for this project was provided by the Robert Wood Johnson Foundation. The views expressed here do not necessarily reflect the views of the foundation.

