
Publication


Significance Testing Using State Health Compare
 Originally published December 2016.
Updated March 2023 by SHADAC Research Assistant Adey Fentaw.
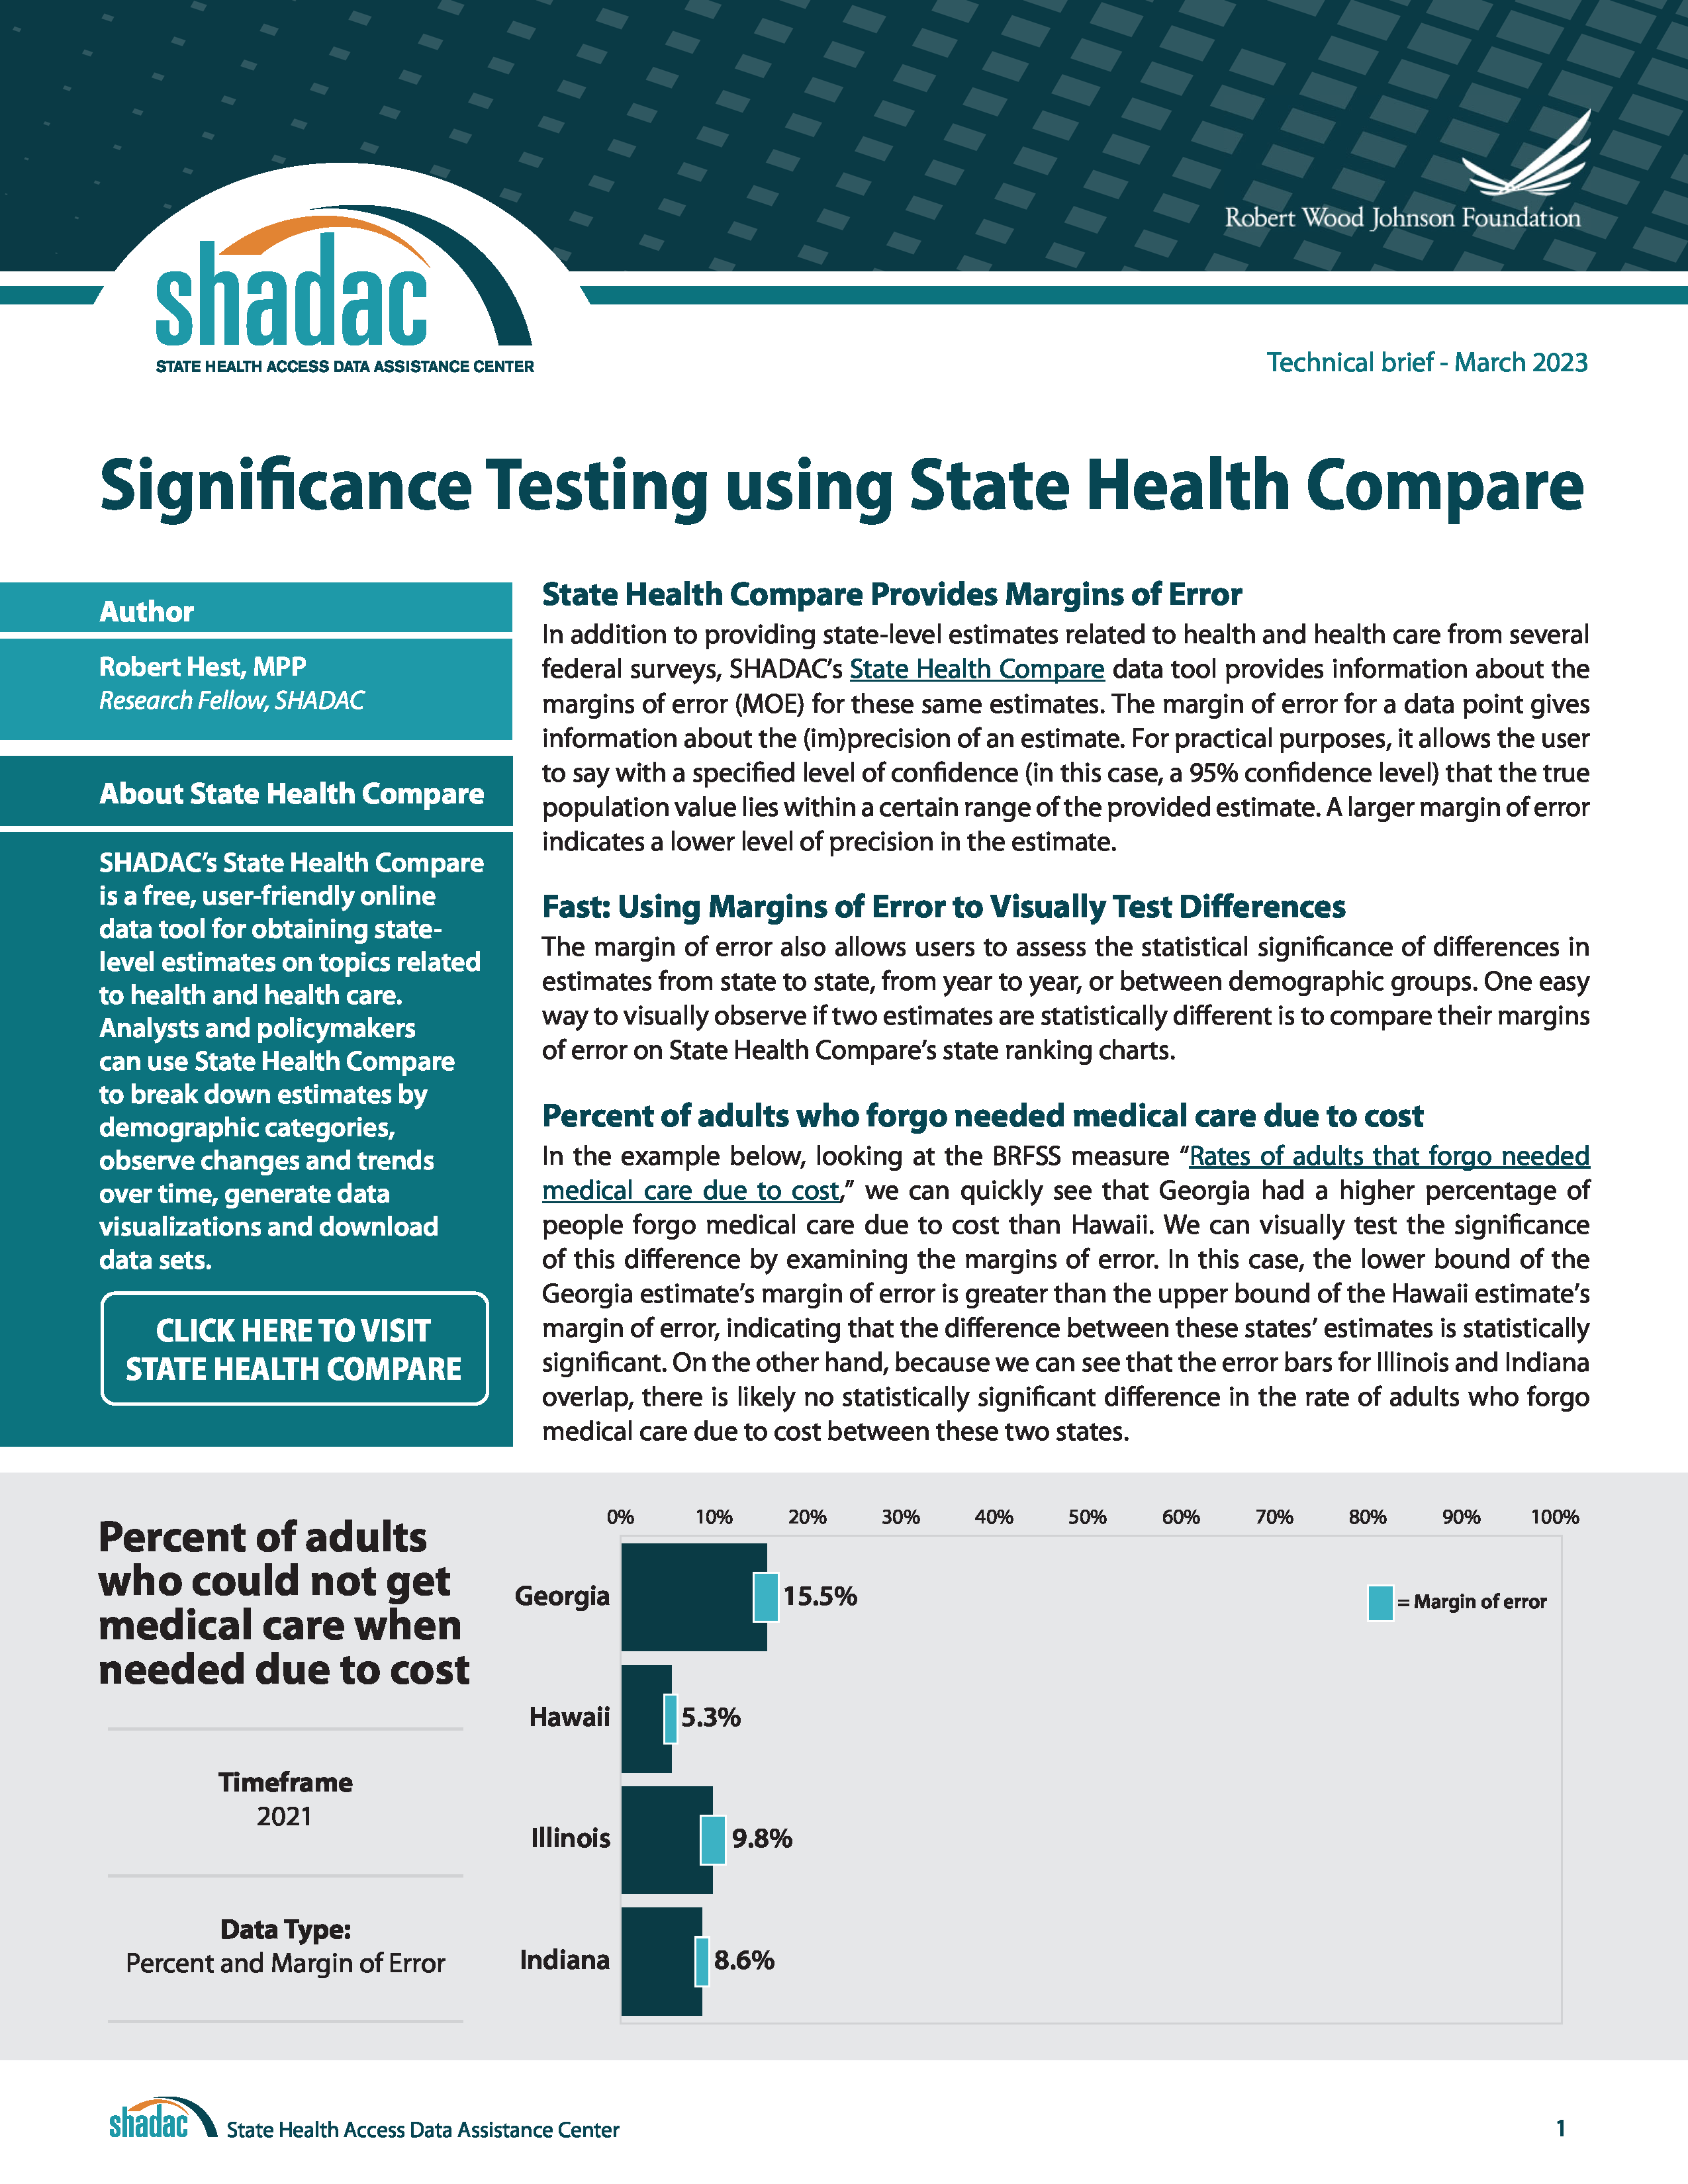
This technical brief provides guidance on how to run tests for statistically significant differences using estimates and their associated margins of error from SHADAC’s State Health Compare web tool.
The brief first explains how to conduct a quick visual scan for statistically significant differences using the margins of error (MOE) output in State Health Compare's state ranking charts, and then goes on to provide step-by-step instructions for using margins of error to conduct a more robust test of statistical significance through a type of hypothesis testing known as a “t-test.” Download a PDF of the brief.

Blog & News

Review of Health Insurance Coverage Data in 2021: Releases and Resources
February 27, 2023:Each year, SHADAC covers the releases of health insurance coverage data from major federal surveys such as the American Community Survey (ACS) and Current Population Survey (CPS), both of which are overseen by the U.S. Census Bureau.1 Not only do these data provide an understanding of trends for the millions of individuals in the United States who lack any type of coverage, but they also give indications of changes in other major forms of health insurance, like public coverage, private coverage, and employer-sponsored coverage.
SHADAC researchers work to provide insights into these data in a variety of formats (including reports, blog posts, and webinars) and analyze a multitude of important demographic groups (children, families living below poverty levels, and for communities of color). We also know that to truly understand the trends and vagaries of health insurance coverage, it’s important to look beyond national-level statistics, to see what’s happening at the state level.
That’s why we recently updated one of the longest-running measures on SHADAC’s data tool, State Health Compare, “Health Insurance Coverage Type” with the latest data for 2021. Users can take a look at estimates of health insurance coverage across all 50 states by type (uninsured, employer-sponsored, Medicaid/CHIP, etc.), by categories (age, education level, race/ethnicity, marital status, poverty level, etc.),2 over time (from 2008-2021),3 and can even examine estimates using color-coded maps, trend and bar charts, or by ranking states in terms highest and lowest rates for any coverage type.
2021 Key Findings
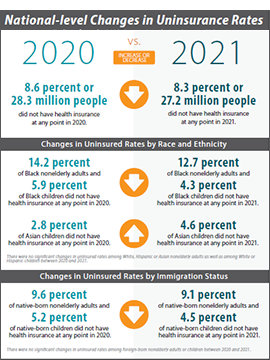
After multiple disruptions to data collection efforts resulted in data quality issues for 2020 ACS estimates, SHADAC is excited that data for 2021 are able to be used with confidence once again—though users are cautioned not to compare data to the prior year. Nationally, the U.S. saw a near-record low rate of uninsurance in 2021, at 8.6%, second only to a rate of 8.5% in 2016.
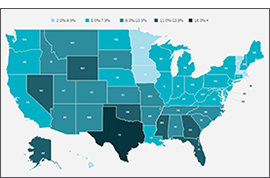
Looking at the state level, however, shows much wider variation in uninsured rates, from a low of 2.4% in Massachusetts to a high of 17.9% in Texas. By larger demographic groups:
- Among children (age 0-18), 5.4% were uninsured in 2021; however, by state, this ranged from 1.1% in Massachusetts to 11.8% in Texas.
- Among those below the poverty level, 15.6% were uninsured in 2021; however, by state, this ranged from 4.4% in Vermont to 30.5% in Texas.
- Among individuals with less than a high school degree, 22.2% were uninsured in 2021; however, by state, this ranged from 5.9% in Massachusetts to 41.4% in Texas.
- Among people reporting “Fair” or “Poor” health status, 25.9% were uninsured in 2021; however, by state, this ranged from 17.9% in Louisiana to 44.7% in Utah.
SHADAC Publications
For a full range of available products from SHADAC’s coverage of the 2022 health insurance data release (2021 estimates) please see below.
|
2021 CPS ASEC: National-level |
An Annual Conversation with |
Comparing Federal Government |
|
2021 ACS: State-level Analysis |
2019 vs 2021 ACS: State and |
2017-2021 ACS: 5-year State and |
- CPS ASEC: 2021 National Health Insurance Coverage Estimates Show Falling Uninsured and Private Coverage Rates Across Population Demographics (Blog & Infographic)
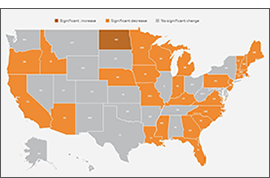
- 2021 ACS: Estimates Show Declining Uninsurance Rates Across 28 States, Driven by Rise in Public Coverage and Fall in Private Coverage (Blog & Interactive Maps)
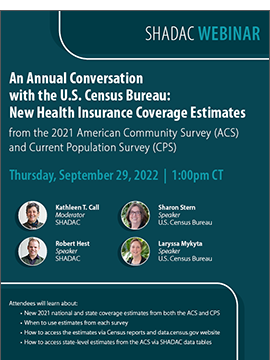
- An Annual Conversation with the U.S. Census Bureau: Coverage Estimates from the 2021 ACS and CPS (Webinar Recording)
- 2021 ACS Data: State and County Uninsured Rates, with Comparison Year 2019 (Blog, Interactive Map, & Data Tables)
- Comparing Federal Government Surveys That Count the Uninsured: 2022 (Issue Brief)
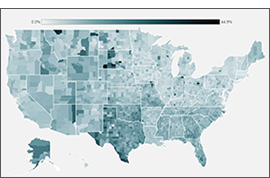
- 2017-2021 ACS: 5-year Combined State and County Uninsured Rates (Blog, Interactive Map, & Data Tables)
For more detailed estimates on health insurance coverage in 2021, please visit State Health Compare. Be sure to also check out our helpful guide to Navigating Data on State Health Compare for more on what users can do with this unique data tool!
1 SHADAC also covers health insurance coverage data releases from both the National Health Interview Survey (NHIS) and the Medical Expenditure Panel Survey (MEPS). For more on the NHIS, see a recent blog post discussing the early release estimates from the first half of 2022, and for more on the MEPS, see the latest edition of our of Employer-Sponsored Health Insurance report.
2 Because of changes made in 2020 to how the ACS measures race and ethnicity, caution should be used when comparing data by race and ethnicity from 2021 and later to data from 2019 and earlier.
3 As previously documented by SHADAC, 2020 ACS data were unfortunately severely disrupted by the COVID-19 pandemic, resulting in the choice by the U.S. Census Bureau to release the estimates in an “experimental-only” capacity. For that reason, SHADAC created a special “Health Insurance Coverage Type (2020)” measure using data from the CPS. For more on the reasoning behind using the CPS instead of the ACS and the differences between the two surveys, please see our explanatory blog post.
Blog & News

To Improve Health Equity, Treat Disparities in Adverse Childhood Experiences
February 15, 2023:Twenty-five years ago, a watershed study on adverse childhood experiences (ACEs) first established a relationship between childhood trauma and long-term health impacts that can last well into adulthood.1 Since then, numerous related studies have corroborated the association between ACEs and mental health and substance use disorders as well as diseases such as cancer, diabetes, and heart disease.2
Today, many public health experts recognize childhood trauma as a public health threat, not so different from the threat posed by infectious diseases such as COVID-19. And, similar to the way that medical science has developed tools such as vaccines to prevent illness caused by pathogens, research has identified strategies that can prevent childhood trauma or provide children and families with tools to limit more lasting harms.3
As with other public health strategies, identifying populations most at risk for harm can help focus interventions to improve people’s health and lives. To do that for ACEs, it is critical to understand disparities in children’s exposure to traumatic experiences.
Disparities in ACEs exposure
In a recent SHADAC study, researchers used data from the federally sponsored National Survey of Children’s Health, which includes questions on several experiences generally considered to be ACEs, such as children’s separation from parents due to death, incarceration, or divorce; exposure to violence in the home or neighborhood; and difficulty affording basic necessities, such as food and housing. Because our aim was to produce estimates of ACEs exposure for different demographic groups, we combined multiple years of the survey (2016-2019) to enhance our ability to produce reliable estimates.
The findings of our analysis were deeply troubling. Nationally, almost half of U.S. children had exposure to at least one ACE, and more than half of children had an ACE exposure in 13 states. There was no state where ACEs were rare; even in Minnesota, the state with the lowest rate, more than one-third of children had exposure to at least one ACE.
Disparities in exposure to potentially traumatic childhood experiences were even larger across demographic groups than across the states. By race and ethnicity, Black children and American Indian and Alaska Native children had the highest rates of ACEs exposure, at 63.7 percent and 63.0 percent, respectively. Meanwhile, Asian children and White children had the lowest rates of ACEs exposure, at 25.0 percent and 40.9 percent, respectively. There were similarly large disparities by family income. Children from households with the lowest incomes (200 percent of Federal Poverty Guideline [FPG] or less) had an ACEs exposure rate of 61.9 percent, while those from families with the highest incomes (400 percent of FPG or higher) had a much lower rate of 26.4 percent. Our analysis also found differences by children’s health insurance coverage status and type, as well as by age groups.
ACEs as a health equity issue
Our study showed clear patterns of disparities in exposure to experiences that can create childhood trauma across a multitude of demographic groups—a finding that, in combination with research demonstrating a link between ACEs and long-term health, suggests that working to reduce the prevalence of ACEs and the harm that they cause could pay dividends in improving health equity.
Fortunately, there is a growing body of research that points to strategies for addressing ACEs. For instance, the U.S. Centers for Disease Control and Prevention (CDC) suggests strengthening economic supports for families and promoting family-friendly work policies; ensuring access to high quality childcare and early childhood education; and giving parents and children a toolbox of healthy skills for coping with short-term stress using social-emotional learning and other evidence-based approaches.4
Improving people’s health and lives by addressing the pernicious harm of ACEs will necessarily entail a broader “culture of health” strategy that extends beyond the traditional health care system. But attempting such new approaches may be necessary to break longstanding health equity logjams and provide all children a fair chance at growing into healthy and productive adults.
Download new SHADAC brief "The Kids Aren't Alright: Adverse Childhood Experiences and Implications for Health Equity."
1 Felitti, V.J. et al. (May 1998). Relationship of Childhood Abuse and Household Dysfunction to Many of the Leading Causes of Death in Adults. American Journal of Preventive Medicine, 14(4), P245-258. https://doi.org/10.1016/S0749-3797(98)00017-8
2 Centers for Disease Control and Prevention Vital Signs (2019). Adverse Childhood Experiences (ACEs) Preventing early trauma to improve adult health. https://www.cdc.gov/vitalsigns/aces/pdf/vs-1105-aces-H.pdf
3 Centers for Disease Control and Prevention (2019). Preventing Adverse Childhood Experiences: Leveraging the Best Available Evidence. https://www.cdc.gov/violenceprevention/pdf/preventingACES.pdf
4 Centers for Disease Control and Prevention (2019). Preventing Adverse Childhood Experiences: Leveraging the Best Available Evidence. https://www.cdc.gov/violenceprevention/pdf/preventingACES.pdf
Publication
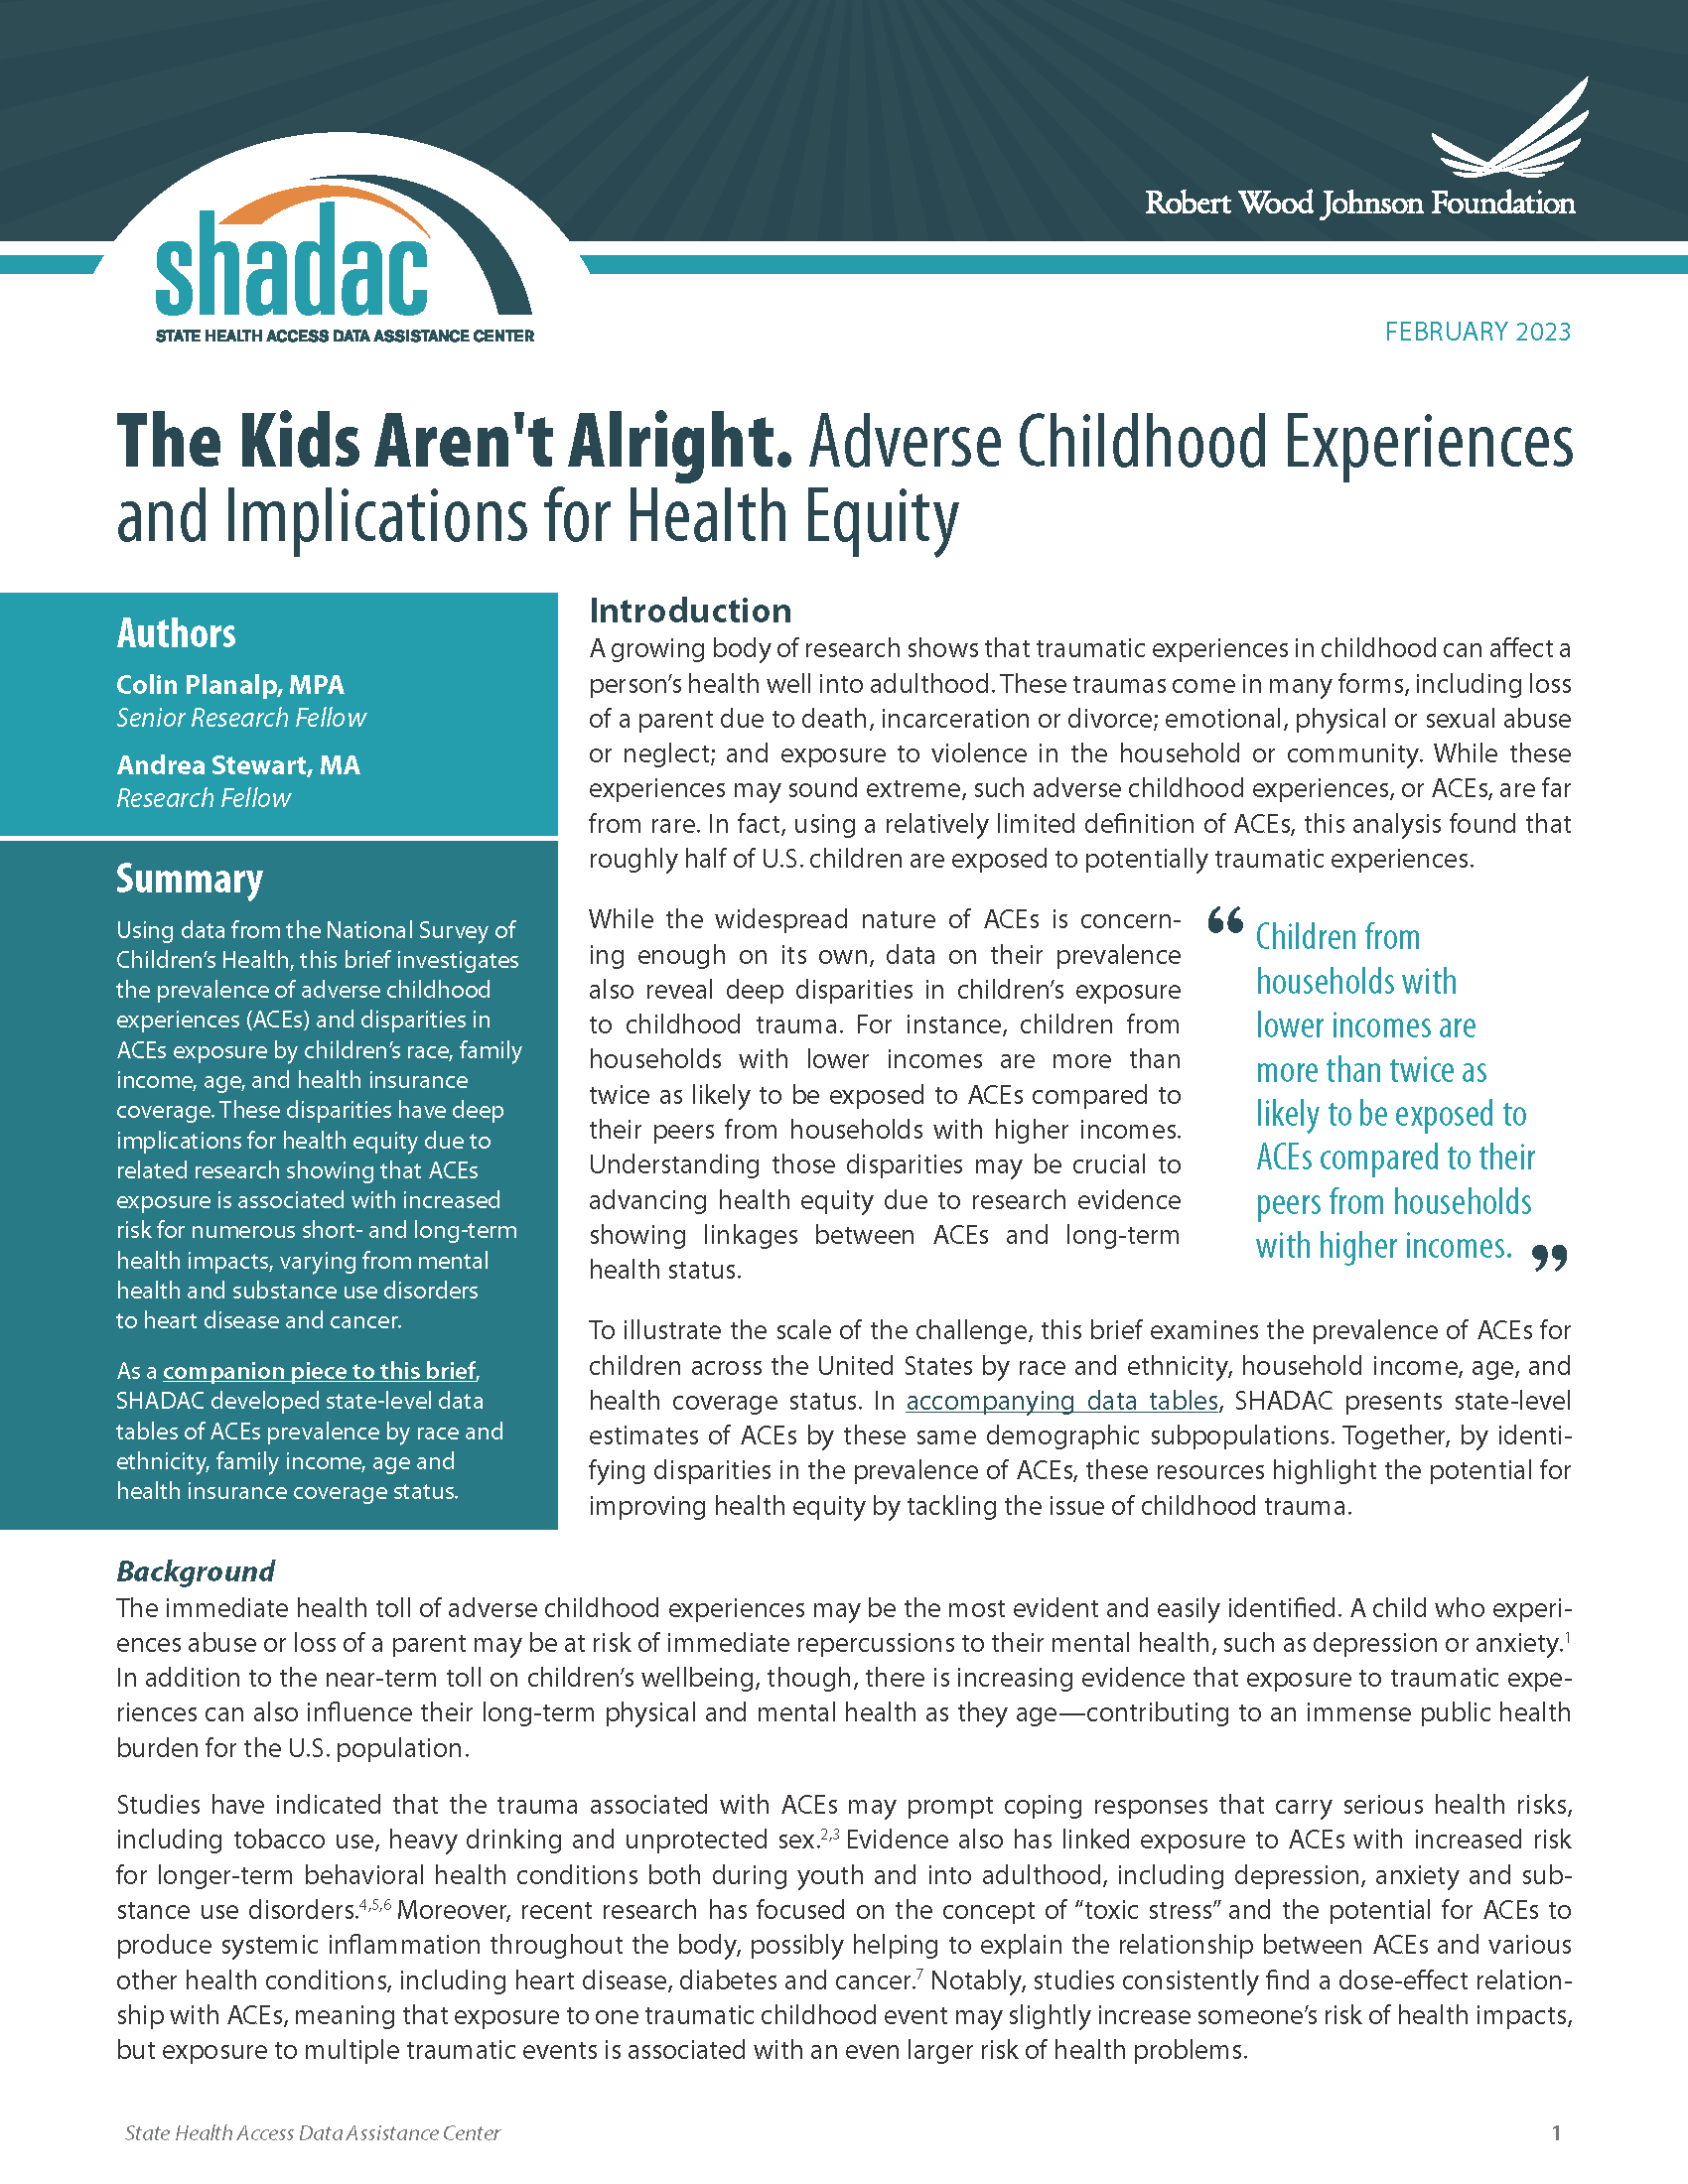
The Kids Aren't Alright: Adverse Childhood Experiences and Implications for Health Equity
Authors: Colin Planalp, MPA and Andrea Stewart, MA
Drawing on data from the National Survey of Children’s Health, this brief investigates the prevalence of adverse childhood experiences (ACEs) and disparities in ACEs exposure by children’s race, family income, age and health insurance coverage. The disproportionate impact of ACEs has deep ramifications on health equity due to related research showing that ACEs exposure is associated with increased risk for numerous short- and long-term health impacts, varying from mental health and substance use disorders to heart disease and cancer.
To learn more about disparities in ACEs: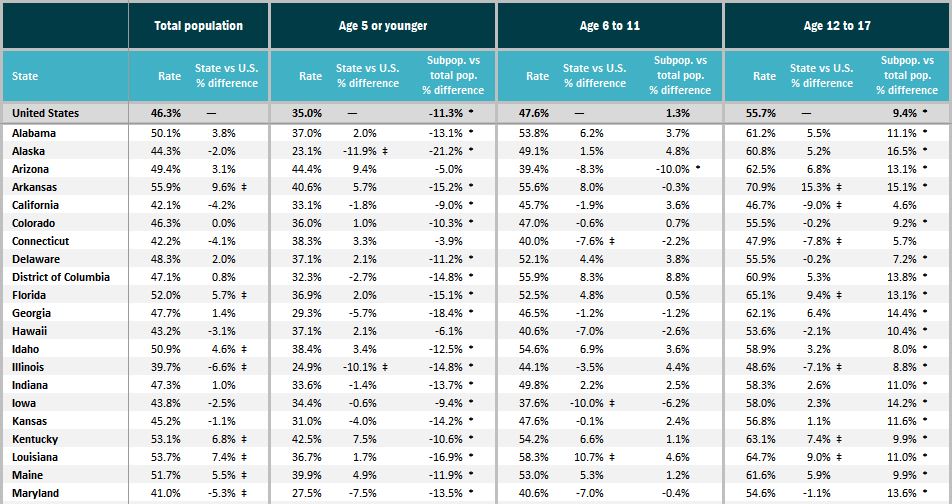
- Download State-level data tables of ACEs prevalence by race and ethnicity, family income, age, and health insurance coverage status;
- Check out the accompanying SHADAC blog "To Improve Health Equity, Treat Disparities in Adverse Childhood Experiences"; or
- Visit the Adverse Childhood Experiences measure on State Health Compare.
Blog & News
Hest, Emily
Lanigan, Lindsey
Navigating Data on State Health Compare (Video)
January 2023:
Check out our new video to learn tips and tricks for using SHADAC’s State Health Compare |
SHADAC’s State Health Compare is a go-to resource for more than 45 data measures on a range of health topics including insurance coverage; cost of care; health behaviors; health outcomes; access to and utilization of care; care quality; public health; and social and economic determinants of health. Estimates are regularly updated from more than 17 data sources and can be broken down across subcategories such as age, education level, race/ethnicity, and other characteristics.
This new video walks through how to create customized data sets and visualizations of state-level health estimates on State Health Compare, allowing analysts, policymakers, and other data users to seamlessly view and download their state’s estimates.
Additional Resources
The SHADAC website is home to numerous blogs detailing ways to use State Health Compare data. Take a deep dive on data related to excessive alcohol use, explore state-level public health funding, observe trends within the opioid epidemic, learn more about physician acceptance of Medicaid patients, or understand rates of unhealthy days for U.S. adults.

