
Blog & News


Assessing Physician Acceptance of Medicaid Patients Using State Health Compare
August 25, 2022:In order for the more than 80 million Medicaid beneficiaries to access needed care in a timely manner, there must be a sufficient number of health care providers to serve these patients. There has long been concern that providers are less likely to accept Medicaid patients than patients with other types of health insurance coverage, making it difficult for individuals with Medicaid coverage to get health care when they need it. In the U.S., nearly all physicians accept new patients with private insurance, but only about three quarters accept new patients with Medicaid coverage. Though this trend is clear nationally, there is a large degree of variation across the states in how likely physicians are to accept new patients with Medicaid coverage compared to other forms of insurance.
|
|
Physicians are more likely to take patients with private insurance over Medicaid in most states |
Nationally, in 2014–2017, while more than 95 percent of physicians said they accepted new patients with private insurance, only 74 percent accepted new patients with Medicaid coverage (among physicians accepting new patients), a greater than 20 percentage-point gap.
This gap was much larger in some states than others. For example, in New Jersey, Florida, Louisiana, and California, physicians were more than 30 percentage-points less likely to accept new patients with Medicaid coverage than those with private insurance. And in New Jersey, less than half of physicians said they accepted new patients with Medicaid (42.2%). However, in twelve states, physicians were no more than five percentage points less likely to accept Medicaid patients than private patients, and in Wisconsin, Minnesota, and North Dakota, there was essentially no difference between physicians’ acceptance of Medicaid versus private insurance.
Though the Affordable Care Act (ACA) led to important policy changes that could have prompted shifts in the share of physicians who accept Medicaid patients, rates of acceptance of Medicaid patients have been stable over time nationally and in most states, both before most ACA coverage policies were implemented (2011–2013) and after these policies were in force (2014–2017).
Nationally, the percentage of physicians accepting new Medicaid patients was statistically unchanged between 2011–2013 and 2014–2017, remaining between 73 and 74 percent. Six states—Idaho, Massachusetts, Missouri, Ohio, Vermont, and West Virginia—saw significant increases in the percent of physicians accepting Medicaid patients. Of these states, Missouri saw the largest increase, with 78 percent of physicians accepting Medicaid-covered patients in 2014–2017 compared to less than 69 percent in 2011–2013, a greater than nine percentage-point increase.
Six states saw increases in the share of physicians accepting new Medicaid patients
Visit SHADAC’s State Health Compare to dive deeper into state-level trends for these two measures:
- Physician acceptance of new patients by coverage type
- Factors associated with physician acceptance of Medicaid patients
Related Resource
SHADAC brief summarizing Dr. Hannah Neprash’s study examining the effects of Medicaid expansion on physician participation
Notes
Estimates in this post are representative of non-federally employed office-based physicians who are primarily engaged in direct patient care and reported accepting new patients. Data years 2011–2013 and 2014–2017 were merged to improve sample sizes and facilitate the production of state-level estimates. Estimates represent a weighted average of the years in these periods.
Differences between physician acceptance of Medicaid versus private insurance were not evaluated for statistical significance. All described differences in physician acceptance of Medicaid coverage over time were statistically significant at the 95% confidence level.
All data in this post come from SHADAC analysis of the 2011–2017 National Electronic Health Records Survey (NEHRS) data, produced by the National Center for Health Statistics (NCHS). The analysis was performed by SHADAC under contract with the Medicaid and CHIP Payment and Access Commission (MACPAC). The findings, statements, and views expressed here are those of SHADAC and do not necessarily reflect those of MACPAC. Data were analyzed at the University of Minnesota's Census Research Data Center. Data for 2016 are not available.
Blog & News

2022 NHIS Early Release: Estimates from Quarter 1 (January-March) show potential post-pandemic rebounds in health insurance coverage
August 8, 2022:The National Center for Health Statistics (NCHS) has released quarterly estimates of health insurance coverage beginning in January 2021 through March 2022 from the National Health Interview Survey (NHIS) as part of the NHIS Early Release Program.
After disruptions to data collection operations due to COVID-19 in 2020 and 2021, NHIS quarterly estimates for 2022 were able to collect and produced as usual.1 Estimates for each included category of insurance coverage (uninsured, public, and private) have been disaggregated by age group and family incomes as a percentage of the federal poverty level (FPL), reported race and ethnicity categories, and by geographic region.2
Uninsured rate saw significant decreases while public and private coverage remain stable
As the United States emerges from the height of the COVID-19 pandemic, estimates from the NHIS indicate positive trends for health insurance rates across coverage types thus far in 2022.
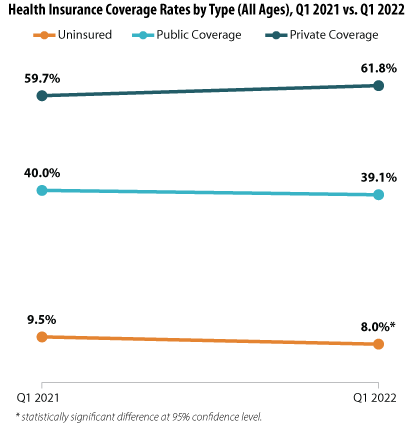
The uninsured rate dropped significantly across all age groups, decreasing by an incredible 1.5 percentage points (PP) from 9.5% during Q1 2021 to a historic low of just 8.0% during Q1 2022.
While public and private insurance coverage rates showed no statistically significant changes between the Quarter 1 time periods (measuring at 40.0% in 2021 and 39.1% in 2022 and 59.7% in 2021 and 61.8% in 2022, respectively), the potential shifts in coverage that are hinted at by the NHIS data offer hope toward a continuing post-pandemic recovery. A possible rise in private insurance coverage would indicate the potential for a resurgence in employer-sponsored insurance (ESI) due to a prospective rise in employment (unemployment rates fell sharply to 5.3% in 2021 from 8.1% in 2020).3 Consequently, this potential rise in private insurance coverage appears to be possibly offset by a reduction in public insurance coverage, indicating a consequent reduction in the portion of the national population needing to rely on safety net public insurance programs such as Medicaid. Again, our analysis of the NHIS insurance estimates did not find the year-to-year changes in public and private coverage to be statistically significant; therefore, these data will require further monitoring to see if these possible trends bear out.
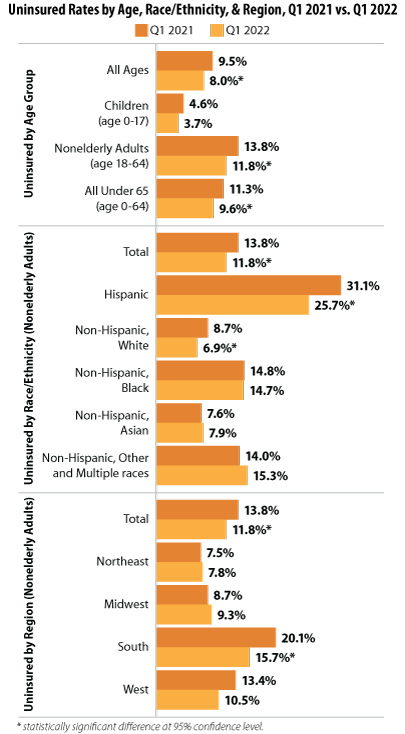
Falling uninsured rates across demographic groups
Examining the NHIS coverage estimates for Q1 (January-March) 2022 revealed further good news in that a number of demographic subgroups saw a significant reduction in uninsured rates: by age, by race and ethnicity, and by geographic region.
Findings by age group
Our analysis showed not only a significant drop in uninsurance across all age groups from 2021 to 2022 (9.5% to 8.0%, respectively), but this decrease was underscored by rates for individuals under 65 (11.3% to 9.6%) and for nonelderly adults age 18-64 (13.8% to 11.8%). Rates for children (age 0-17) remained stable between the two years’ first quarters.
Findings by race and ethnicity
Uninsured rates also decreased significantly for Hispanic nonelderly adults (age 18-64)—dropping from 31.1% in Q1 2021 to 25.7% in Q1 2022—and for Non-Hispanic, White nonelderly adults (age 18-64) —dropping from 8.7% in Q1 2021 to 6.9% in Q1 2022.
Findings by geographic region
While uninsured rates in most regions remained stable between January-March of 2021 and 2022, NHIS data showed a significant drop in uninsurance for nonelderly adults (age 18-64) in the South, a region that traditionally has seen higher rates of uninsurance, falling to 15.7% in 2022 from 20.1% in 2021.4
Overall, data from Q1 of 2022 indicated positive trends in health insurance coverage, with uninsured rates falling significantly for a number of population subgroups and a potential (though not significant) recovery for private insurance and a lessening of public insurance coverage.
About the Numbers
The above estimates provide a point-in-time measure of health insurance coverage, indicating the percent of individuals with (or without) a specific type of coverage at the time of the interview. The estimates discussed in this blog are only from Q1 (January-March) 2022 and the same period in 2021.
Differences in estimates are statistically significant at the 95% confidence level unless otherwise specified.
Notes
1 SHADAC has previously documented the ways that data collection efforts for the NHIS, as well as a number of other federal surveys, were impacted in 2020 due to the COVID-19 pandemic. Additionally, NCHS—the organization which conducts the NHIS—has provided additional detail on the ways that COVID impacted collection in 2021 to a lesser degree. From January through April 2021, NHIS interviews continued to be attempted by telephone first, with personal visits used only to follow-up on nonresponse, deliver recruitment materials, and conduct interviews when telephone numbers were unknown. Starting in May, field representatives were given discretion to decide whether or not to resume personal visits based on their own health risk and the conditions in the area.
2 FPL categories have been further stratified than in previous years. Through 2020, poverty level estimates were classified in categories of “poor,” “near poor,” and “not poor,” which corresponded with 2021 classifications of “<100% FPL,” “100% to less than 200% FPL,” and “200% and greater FPL.” In the 2022 estimates, the categories were expanded to include a “200% to less than 400% FPL” category and a “400% and greater FPL.”
3 SHADAC analysis of Bureau of Labor Statistics data for 2020 and 2021. State Health Compare. Unemployment rate: 2020; 2021 [Data set]. State Health Access Data Assistance Center. http://statehealthcompare.shadac.org/trend/148/unemployment-rate-by-total#0/1/a/19,20,9,10,11,12,13,14,1,2,3,4,5,6,7,8,15,24,25,27,32,37/185
4 Tolbert, J. & Orgera, K. (2020, November 6). Key facts about the uninsured population. Kaiser Family Foundation (KFF). https://www.kff.org/uninsured/issue-brief/key-facts-about-the-uninsured-population/
Office of Health Policy. (2021, March 23). The remaining uninsured: Geographic and demographic variation [No. HP-2021-06]. Office of the Assistant Secretary for Planning and Evaluation (ASPE). https://aspe.hhs.gov/sites/default/files/private/pdf/265286/Uninsured-Population-Issue-Brief.pdf
NHIS Report Citation
Cohen, R.A. & Cha, A.E. (July 2022). Health insurance coverage: Early release or quarterly estimates from the National Health Interview Survey, January 2021–March 2022. National Center for Health Statistics (NCHS). https://www.cdc.gov/nchs/data/nhis/earlyrelease/Quarterly_Estimates_2022_Q11.pdf
Blog & News

Now Available on State Health Compare: Five Updated Measures and One Brand New Measure
July 27, 2022:Estimates for five measures of health care access, affordability, and use have now been updated on SHADAC’s State Health Compare web tool. One new measure, Had Dental Visit has also been added to the tool. The new and updated measures are all produced using data from the National Health Interview Survey (NHIS), conducted by the National Center for Health Statistics (NCHS). SHADAC produces these state-level measures using restricted-access data through the Minnesota Research Data Center (MnRDC). SHADAC’s State Health Compare is the only source of state-specific data for these measures which are essential for monitoring individuals’ access to and use of medical care, along with their ability to afford care.
These measures now contain data updated through 2020, using two-year pooled periods (i.e., 2017-2018, 2019-2020). The measures can be broken down by Total, Age, and Coverage Type (Public, Private, Uninsured). Additional breakdowns—such as Race and Ethnicity—will be highlighted within future SHADAC blogs as they become available.
Updated and new measures include:
![]()
 NEW: Had Dental Visit
This measure describes the percent of individuals who had a dental examination or cleaning during the past twelve months.

Had Usual Source of Medical Care
This measure captures rates of individuals who had a usual place of medical care other than an emergency department during the past twelve months.
 Had General Doctor or Provider Visit
This measure provides rates of individuals who had any visit to a general doctor or provider within the last year.
 Had Emergency Department Visit
This measure looks at rates of individuals who had any type of visit to an emergency department in the past twelve months.
 Trouble Paying Medical Bills
This measure examines rates of individuals who had trouble paying off medical bills during past twelve months for the civilian non-institutionalized population.
 Made Changes to Medical Drugs
This measure highlights rates of individuals who were prescribed medication in the past twelve months who made changes to medical drugs because of cost during the past twelve months for the civilian non-institutionalized population. This includes delaying filling a prescription, taking less medicine, or skipping medication doses to save money.
Click here to explore these measures on State Health Compare!
Data Sources
The estimates were produced using restricted NHIS data in the MnRDC. Measures have been updated with data through 2020 using two-year pooled periods, including (a) 2017-2018 and (b) 2019-2020.
Publication
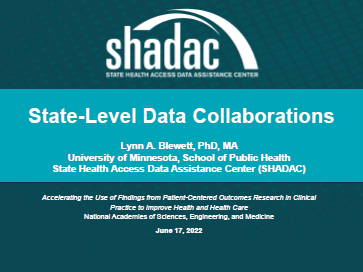
Accelerating the Use of Findings from Patient-Centered Outcomes Research in Clinical Practice to Improve Health and Health Care
 A committee of the National Academies of Sciences, Engineering, and Medicine is hosting a series of public workshops to explore potential ways to accelerate the use of patient-centered outcomes research (PCOR) findings in clinical practice to improve health and health care.
In the second workshop on June 17, 2022, SHADAC director Lynn Blewett presented on "State-Level Data Collaborations and Opportunities to Improve the Sustainability of Their Efforts."

Event Summary
These public workshops from the National Academies of Sciences, Engineering, and Medicine (the National Academies) feature invited presentations and discussions examining topics in 4 main categories:
1. Ways to revise and improve AHRQ’s proposed strategic plan, priorities, and strategies to make them clearer and more likely to lead to funding high-impact and complementary projects while being consistent with the Congressional mandate for investing funds from the PCOR Trust Fund (PCORTF), e.g.,
- Opportunities to train and educate PCOR investigators, while also addressing AHRQ’s PCORTF strategic priorities
- Development of digital tools to increase implementation of PCOR findings into practice
- Sustainable strategies for expanding implementation of PCOR findings
- The potential for development of an overall coordinated interdisciplinary approach to decisions about AHRQ’s PCORTF investments
2. Ways to measure progress and the impact of AHRQ’s PCORTF investments as a whole on meeting its goals (in the short-term, proximate, and long-term).
- Currently available metrics,
- Currently available data sources,
- Potential for novel metrics, analytics and data sources, and
- Ways to harmonize data elements across projects that could be included in evaluating the short- and long-term impact of AHRQ’s PCORTF investments.
3. Ways to better align priorities and strategies and to create complementary collaborations between the agencies charged with using the PCORTF to improve patient-centered outcomes research and practice (AHRQ, PCORI and ASPE), so as to increase the impact of AHRQ’s PCORTF investments and their potential to sustainably reduce disparities.
4. Ways AHRQ can apply communication science to improve dissemination of evidence, gaps in evidence, and policy gaps to inform health policies and decision-makers at the local, state, and federal levels.
Blog & News

Six Measures on SHADAC’s State Health Compare Now Updated to Include Pandemic-era Data for Health Behaviors and Outcomes
March 18, 2022:As part of our commitment to releasing relevant and timely state-level data, estimates for six measures on SHADAC’s State Health Compare web tool have recently been updated with data from the first years of the COVID-19 pandemic, 2020 and 2021. Data for each of these measures is drawn from a variety of different data sources, which are detailed in the notes below.
Measures that have been updated include:
- Alcohol-Involved Deaths (2020)
Alcohol-Involved Deaths is a newer measure that was added to State Health Compare last year. Estimates for this measure provide state-level rates of deaths that were determined to be “alcohol-induced,” as defined by the Centers for Disease Control (CDC), including deaths from conditions such as alcohol poisoning and alcoholic liver disease that CDC considers to be entirely alcohol-attributable (a full listing of which is available on the data measure homepage). Data are available for years 1999 through 2020.
 Opioid-Related Deaths (2020)
Opioid-related Drug Poisoning Deaths is a measure that encompasses all age-adjusted rates of deaths caused by drug poisoning (i.e., overdose) per 100,000 people. Users can select national and state-level estimates for this measure for comparison by individual drug types, including legal (natural and semi-synthetic opioids; synthetic opioids [non-methadone]) and illegal (heroin) opioids, cocaine, and psychostimulants, as well as high-level “all opioids” and “all drugs” categories. Estimates are available from 1999 through 2020.
- Suicide Deaths (2020)
Suicide Deaths provides a measure of age-adjusted deaths from suicide per 100,000 people. Estimates can be viewed across categories that include age, sex, race/ethnicity, firearm or non-firearm method, and metropolitan status. Data are available for years 1999 through 2020.
- Premature Death (2020)
Premature Death measures the average number of years of potential life lost prior to age 75 per 100,000 persons. In addition to viewing this measure for the entire state population, data users can compare rates of premature death by race and ethnicity. Data are available for this measure for years 2000 through 2020.
- Adverse Childhood Experiences (2019-2020)
Adverse Childhood Experiences measures the percent of children (age 0–17) residing in households who had experienced no, one, or two or more adverse childhood experiences (ACEs) out of a possible nine ACEs ([1] hard to cover basics on family's income; [2] parent or guardian divorced or separated; [3] parent or guardian died; [4] parent or guardian served time in jail; [5] saw or heard parents or adults slap, hit, kick, punch one another in the home; [6] was a victim of violence or witnessed violence in neighborhood; [7] lived with anyone who was mentally ill, suicidal, or severely depressed; [8] lived with anyone who had a problem with alcohol or drugs; and [9] treated or judged unfairly due to race/ethnicity). Data users can make national and state-level comparisons of ACEs rates of by age, health insurance coverage type, parental education, poverty level, and race/ethnicity. Data are available for the two-year pooled periods 2016–2017, 2017–2018, 2018–2019, and 2019-2020.
- Unemployment Rate (2021)
Unemployment Rate measures the average annual percent of the civilian labor force (age 16 and older) that was unemployed. Individuals are defined as unemployed if they do not have a job, have actively looked for work in the prior four weeks, and are currently available for work. Users are able to compare data estimates for years 2000 through 2020 for national and state total population; however, only 2000-2020 data is available for viewing by race/ethnicity categories, as 2021 data is still forthcoming.
Notes
Data for Alcohol-involved Deaths, Opioid-related Deaths, and Suicide Deaths come from the CDC WONDER system. Data for Premature Death come from the CDC WISQARS system. Estimates for Adverse Childhood Experiences are produced using microdata from the National Survey of Children’s Health. Data for Unemployment Rate come from the U.S. Bureau of Labor Statistics’ Local Area Unemployment Statistics program.

