
Blog & News


Explore Physician Acceptance of New Medicaid Patients through Two New Measures on SHADAC’s State Health Compare and in a New MACPAC Factsheet
August 5, 2021:Authors: Robert Hest and Julia Ngep
In order for the more than 80 million Medicaid beneficiaries to access needed care in a timely manner, there must be a sufficient number of health care providers to serve these patients. There has long been concern that providers are less likely to accept Medicaid patients than patients with other types of health insurance coverage. Because Medicaid policies—and providers’ responses to those policies—differ substantially across states, state-level data is critical for monitoring the providers’ decisions to accept Medicaid patients and for understanding the factors that influence those decisions.
Using data from the 2011-2017 National Electronic Health Records Survey (NEHRS),1 SHADAC performed an analysis to examine and compare physician acceptance of new Medicaid patients at the state level and by physician and practice characteristics. This analysis was performed under contract with the Medicaid and CHIP Payment and Access Commission (MACPAC) and is presented in two new measures on SHADAC’s State Health Compare web tool as well as in a new MACPAC factsheet.
State Health Compare Measures
 Physicians who accept new patients
Physicians who accept new patients measures the percent of physicians who accept new patients by type of coverage: private, Medicare, and Medicaid. Data years were pooled where single-year estimates were not possible and are available for 2011-2013 and 2014-2017.
In 2014-2017, state-level physician acceptance of Medicaid patients ranged from 42.2 percent in New Jersey to 99.4 percent in North Dakota, acceptance of Medicare patients ranged from 77.1 percent in Georgia to 98.3 percent in North Dakota, and acceptance of private patients ranged from 80.3 percent in the District of Columbia (D.C.) to 100.0 percent in Nebraska.
Physicians who accept new Medicaid patients
Physicians who accept new Medicaid patients measures the percent of physicians who accept new Medicaid patients by the following physician/practice characteristics:
- Setting (private solo/group versus total) available for pooled data years 2011-2012 and 2014-2017;
- The share of Medicaid existing patients (above versus below national average) available for pooled data years 2011 & 2013 and 2014-2017;
- And the ratio of mid-level providers (above versus below national average) available for pooled data years 2014-2017.
At the national level in the most recent time period: physicians in private solo/group practices were less likely to accept new Medicaid patients compared to all physicians (70.4% versus 74.0%); physicians with an above-average share of existing Medicaid patients were more likely to accept new Medicaid patients compared to all physicians (87.4% versus 63.8%); and physicians with an above-average ratio of mid-level providers were more likely to accept new Medicaid patients compared with all physicians (80.5% versus 73.7%).
New MACPAC Factsheet
 Physician Acceptance of New Medicaid Patients: Findings from the National Electronic Health Records Survey
This new MACPAC factsheet analyzes physician acceptance of new Medicaid patients at the national and state levels. As Medicaid programs vary by each state and there is little information on physician participation in Medicaid at the state level, this analysis provides an important update of previous MACPAC work analyzing physician acceptance at the national level and prior literature analyzing state-level physician acceptance, last updated for data year 2013.
The analysis found significant differences in rates of physician acceptance of new patients by coverage type, with physicians being more likely to accept private and Medicare patients compared with Medicaid patients. Acceptance of Medicaid patients varied significantly by state and by various patient, physician, and practice characteristics. These include source of patient coverage (Medicaid, Medicare, and private), physician specialty, practice setting, existing Medicaid caseload, and presence of mid-level providers. The analysis found that nationally, rates of physician acceptance were stable over time and increased significantly in a handful of states, with no states experiencing significant decreases in rates of acceptance.
1 Data for 2016 was not released by National Center for Health Statistics (NCHS), which conducts the NEHRS. Data were unavailable by setting in data year 2013; data were unavailable by share of existing Medicaid patients for data year 2012; and data were unavailable by ratio of mid-level providers for data years 2011-2013.
Blog & News

Tracking Broadband Access to Monitor Access to Care
August 4, 2021:The dramatic growth of telehealth during the COVID-19 pandemic has highlighted the crucial role of broadband access in ensuring that people can obtain healthcare services. Broadband has allowed individuals to leverage telehealth technology to receive care from providers in ways that minimize the risk of COVID-19 transmission while eliminating certain access barriers regarding transportation and/or travel time. However, individuals who lack access to broadband services can face healthcare inequities as they are unable to utilize virtual services. Although COVID-19 vaccination rates are on the rise across the United States, the resurgence of cases due to the Delta variant of COVID-19 may lead to more required virtual visits. In addition, virtual access to care will remain important for individuals who live in rural areas, have transportation or mobility limitations, or otherwise would have difficulty visiting a care provider in person, even after the pandemic subsides.
Broadband Access Across the Country
Despite the important role of broadband access in obtaining virtual healthcare services, not everyone lives in a household that has broadband. Estimates from a SHADAC analysis of the American Community Survey (ACS) Public Use Microdata Sample (PUMS) files indicate that in 2019, 86.3 percent of families nationwide had access to broadband in their households.1 Among the states, household broadband access ranged from a high of 91.2 percent in Washington to a low of 76.9 percent in Mississippi.1 Higher rates of broadband access are clustered in states on the West Coast and the Northeast shore. States that have more rural populations tend to have lower access to broadband, with a concentration of limited access in the Southeast.1
Percent of households with a broadband internet subscription, 2019
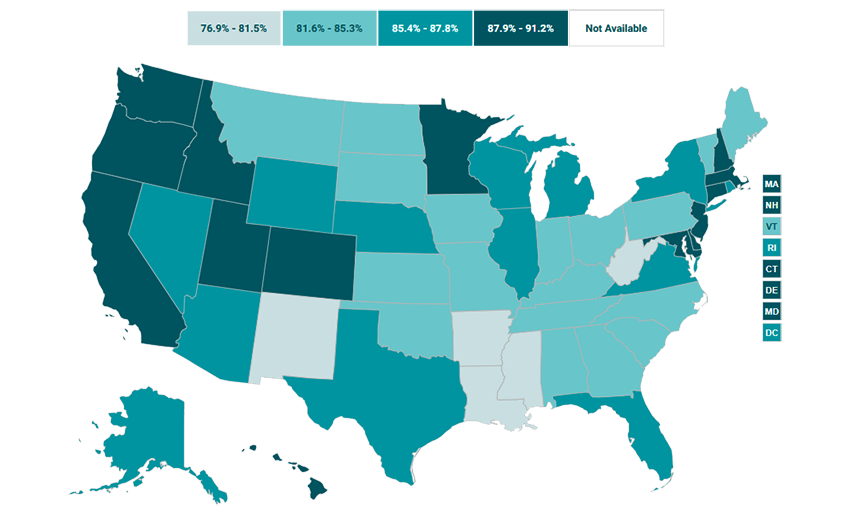
Source: SHADAC analysis of the 2019 American Community Survey (ACS) Public Use Microdata Sample (PUMS) files.
Broadband Access in Minnesota: Above Average, with Plans to Expand
In Minnesota, 87.9 percent of households had access to broadband in their homes in 2019, placing the state higher than the national average and with the 14th highest access to broadband across the states.1 However, the nearly 12 percent of Minnesota households that do not have broadband access also tend to face other factors that can reduce access to healthcare, like living in less dense counties, which tend to have fewer medical providers and require patients to travel farther to access medical facilities.2 In order to improve healthcare accessibility in these areas, Minnesota legislators have agreed to invest an additional $70 million in broadband coverage expansion through the Border-to-Border grant program.3 This program assists with infrastructure installation costs that broadband providers may experience when offering services to an area that has been historically unserved or underserved.3 While this grant program is not expected to expand broadband services to every household in Minnesota, it is one of the largest investments in broadband access in the state since 2014.3
Conclusion
Broadband internet has been vital for accessing healthcare during the COVID-19 pandemic. However, not every family in the U.S. has access to broadband, and this lack of access is distributed unevenly among the states. Less than 80 percent of households in Mississippi and New Mexico (76.9 percent and 78.9 percent, respectively) have broadband access while over 90% of households in Utah, Colorado, and Washington (90.5 percent, 91.1 percent, and 91.2 percent, respectively) have access to broadband internet.1 As telehealth continues to play a role in getting needed services to individuals who face barriers to obtaining care in person, it is important to monitor broadband access as an indicator of access to care.
About the Data
The data cited here can be accessed through SHADAC’s online data tool, State Health Compare, using the measure “Percent of households with a broadband internet subscription” for the years 2016-2019. The estimates come from SHADAC’s analysis of the American Community Survey (ACS) Public Use Microdata Sample (PUMS).
1 Percent of households with a broadband internet subscription. State Health Compare, SHADAC, University of Minnesota website. http://statehealthcompare.shadac.org/map/232/percent-of-households-with-a-broadband-internet-subscription-by-total#a/27/266. Accessed July 21, 2021.
2 Estimated availability of wireline broadband service by county in the state of Minnesota—Areas served by at least 25 Mbps download/3 Mbps upload. Connected Nation. https://mn.gov/deed/assets/county-bb-service-availability_tcm1045-255846.pdf. Published April 2021. Accessed July 21, 2021.
3 Orenstein W. Minnesota lawmakers agree to spend $70 million on improving broadband access across the state. MinnPost. June 1, 2021. https://www.minnpost.com/greater-minnesota/2021/06/minnesota-lawmakers-agree-to-spend-70-million-on-improving-broadband-access-across-the-state/. Accessed July 21, 2021.
Blog & News

Drug overdose deaths grew by almost 30 percent in 2020
July 15, 2021:Fentanyl- and methamphetamine-type drugs surged roughly 50 percent in 2020
Drug overdose deaths surged in the United States during the first year of the COVID-19 pandemic, increasing nearly 30 percent in just 12 months. Provisional data recently published by the U.S. Centers for Disease Control and Prevention (CDC) show that more than 92,000 people died of drug overdoses in 2020—surpassing records yet again.1
The growth was widespread throughout the country, with only two states (New Hampshire and South Dakota) spared from the jump in drug overdose deaths. Conversely, some states saw their death rates increase more than 50 percent, including Kentucky, South Carolina, Vermont, and West Virginia.
Much of the growth in drug overdose deaths was driven by synthetic opioids such as fentanyl, which increased more than 50 percent from 2019 to 2020 (see Figure 1). Fentanyl has become a key product for international drug traffickers, often finding its way as an adulterant in other drugs like heroin and cocaine, and even as an ingredient in counterfeits of common opioid prescription pills such as Oxycontin. The emergence of fentanyl in the U.S. illicit drug trade is a newer phenomenon beginning in the past decade, and it has recently spread from eastern states to increasingly affect states in the western half of the country as well.
Figure 1. Changes in drug overdose deaths in the U.S., 2019 to 2020
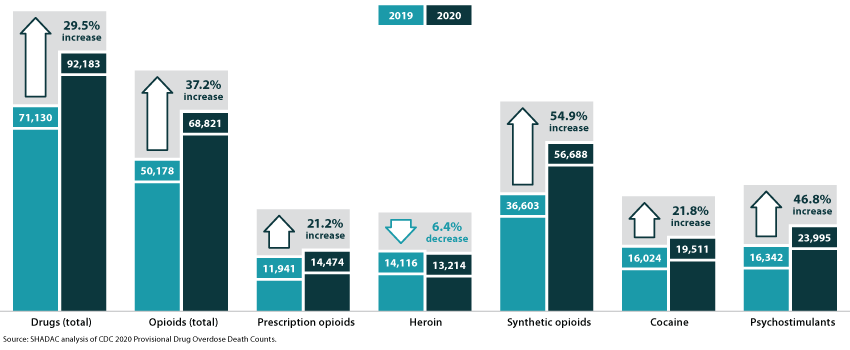
A family of drugs called “psychostimulants”—mostly methamphetamine—also drove a large increase in deaths in 2020, up nearly 50 percent since 2019. Deaths involving methamphetamine and other psychostimulants have grown dramatically in the past few years. The increased death toll involving psychostimulants is likely caused by two factors: First, the methamphetamine trafficked in the U.S. today is generally much more potent than methamphetamine sold in the past, raising the potential risk of overdoses caused by methamphetamine. Second, methamphetamine today is often contaminated with, or used alongside, synthetic opioids, raising the risk of an overdose involving the use of multiple drugs simultaneously.
Of the main drugs involved in overdoses2, only heroin was associated with a decline in deaths during 2020—falling by less than 10 percent since 2019. Meanwhile, overdose deaths involving prescription opioids increased more than 20 percent, reversing a trend of relatively stable or even declining death rates over several years. Cocaine overdose deaths similarly increased by more than 20 percent in 2020.
1 National Center for Health Statistics (NCHS). (2021, July 14). Vital Statistics Rapid Release: Provisional Drug Overdose Death Counts [Data set]. Centers for Disease Control and Prevention (CDC). https://www.cdc.gov/nchs/nvss/vsrr/drug-overdose-data.htm
2 The drug overdose death categories presented in the CDC data include: heroin, natural opioid analgesics (e.g., morphine and codeine) and semisynthetic opioids (e.g., oxycodone and hydrocodone), synthetic opioids such as methadone and synthetic opioids other than methadone (e.g., fentanyl and tramadol), cocaine, and psychostimulants.
Blog & News
Pandemic drinking may exacerbate upward-trending alcohol deaths
June 14, 2021:Even before 2020, alcohol-involved deaths reached a modern record
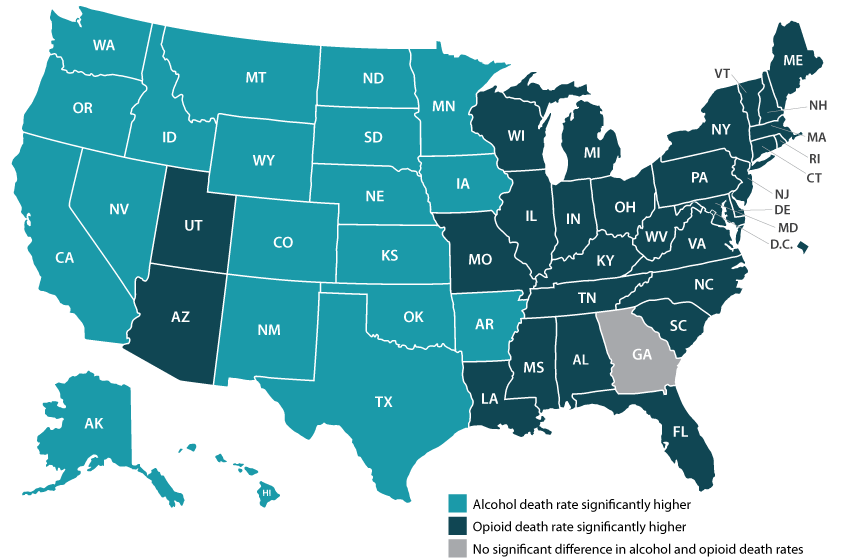
Considering the well-deserved attention paid to the opioid crisis in recent years, few people might guess that rates of alcohol-involved deaths were as high as or higher than opioid overdose death rates in nearly half of states (Figure 1).1 Like the opioid crisis, the trend in alcohol-involved deaths is also worsening, having grown by roughly 50 percent in just over a decade. All this was before the coronavirus crisis had even begun.
Figure 1. State alcohol death rates vs. opioid death rates, 2019
|
Data and analysis on alcohol-involved deaths Read more about growing alcohol-involved death
|
Now, evidence is accumulating that the pandemic precipitated dangerous changes in the way people consume alcohol in the United States. For instance, research has found increased alcohol sales since the crisis began, a finding illustrated by data showing that liquor taxes represented a rare instance of increased revenues for some states, such as Minnesota, during the COVID pandemic.2,3 Other studies have found that U.S. adults report consuming more alcohol in order to deal with pandemic-related stress, and that they are drinking more frequently and engaging in more high-risk drinking behaviors, such as heavy drinking and binge drinking.4,5,6
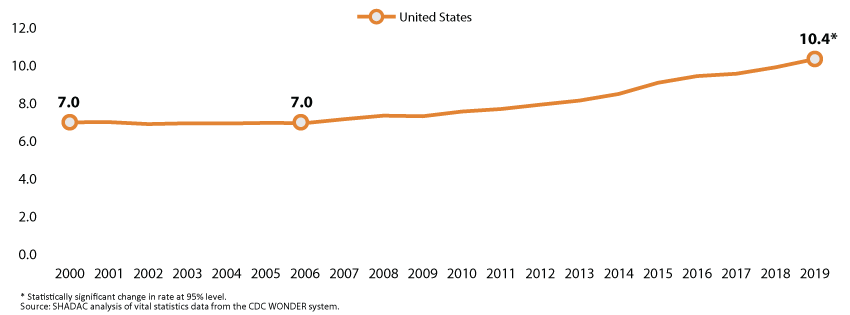
As we climb our way out of the immediate crisis, the U.S. will need to shift attention back to long-running public health threats. Beyond the obvious toll of the virus itself, another legacy of the pandemic may be the exacerbation of existing problems, including alcohol-related deaths and the opioid crisis. The opioid crisis was commonly recognized before 2020, but the upward trend in alcohol deaths was still occurring largely under the radar (Figure 2). But recent attention to risky pandemic-related alcohol consumption can sharpen our focus on this emerging concern.
Figure 2. U.S. alcohol-involved death rates, 2000-2019
With alcohol especially, the U.S. has a window of opportunity to intervene before many people’s pandemic-era risky drinking habits result in deaths, since the bulk of alcohol-involved deaths result from years of excessive drinking. In the coming years, it will be vital for states to monitor and study these issues and to consider doubling down on policy initiatives to curb the tide through efforts such as enhancing access to treatment of substance use disorder and by persuading and assisting people in recalibrating their alcohol consumption to healthier levels.
Visit State Health Compare to explore state-level data on alcohol death and opioid death rates.
1 SHADAC Staff. U.S. alcohol-related deaths grew nearly 50% in two decades: SHADAC briefs examine the number among subgroups and states. https://www.shadac.org/news/us-alcohol-related-deaths-grew-nearly-50-two-decades. Published April 19, 2021. Accessed May 12, 2021.
2 Rebalancing the ‘COVID-19 effect’ on alcohol sales. Nielseniq.com. https://nielseniq.com/global/en/insights/2020/rebalancing-the-covid-19-effect-on-alcohol-sales/. Published May 7, 2020. Accessed May 12, 2021.
3 Ewoldt J. Liquor stores neared sales records for 2020 as bars, restaurants closed. Startribune.com. https://www.startribune.com/liquor-stores-neared-sales-records-for-2020-as-bars-restaurants-closed/573469221/. Published December 26, 2020. Accessed May, 12, 2021.
4 American Psychological Association. Stress in America: One year later, a new wave of pandemic health concerns. https://www.apa.org/news/press/releases/stress/2021/sia-pandemic-report.pdf. Published March 2021. Accessed May 12, 2021.
5 Pollard MS, Tucker JS, Green HD. Changes in adult alcohol use and consequences during the COVID-19 pandemic in the US. JAMA Netw Open. 2020; 3(9): e2022942. doi: 10.1001/jamanetworkopen.2020.22942.
6 Grossman ER, Benjamin-Neelon SE, Sonnenschein S. Alcohol Consumption during the COVID-19 Pandemic: A Cross-Sectional Survey of US Adults. Int J Environ Res Public Health. 2020;17(24): 9189. doi: 10.3390/ijerph17249189
Blog & News

5 States and DC Led the Pack for Per-Capita State Public Health Funding over Past Decade: New Brief Explores Public Health Funding Estimates on State Health Compare
June 8, 2021:
New data collected by the Trust for America’s Health show that most states (43) and the District of Columbia maintained or increased total public health funding levels in FY 2020 amid the COVID-19 public health emergency. However, seven states decreased their total public health funding during this time, and TFAH points out that increases due to state-supported COVID-19 response funding are unlikely to lead to sustained funding growth. It will be important to continue monitoring state funding for public health activities throughout and after the COVID-19 emergency, as these activities have been persistently underfunded over time.1
A new SHADAC brief provides an overview of TFAH’s FY 2020 data on state public health funding--which we standardize to the estimated population of each state to create per-capita estimates--looking at state variation in 2020 and trends over the last decade. SHADAC’s State Health Compare web tool provides access to these per-capita estimates, which are available for data years 2005 through 2020.2
Highlights from the brief are below.
Wide State Variation in Per Capita Public Health Funding Persisted in 2020
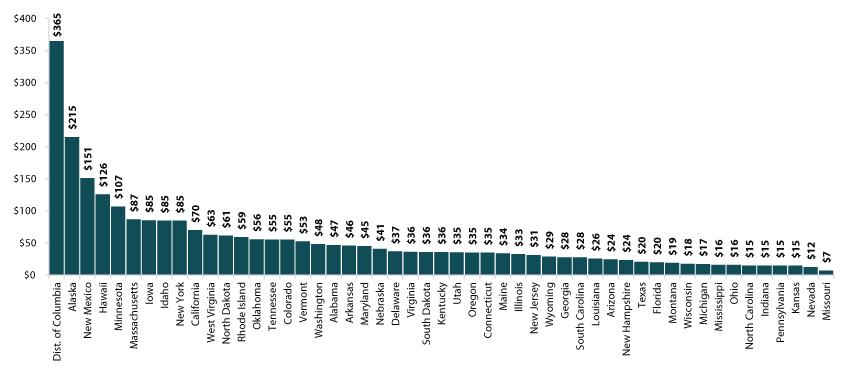
As in 2019, there was a wide gap between state public health funding levels among states in 2020, with state-provided funding ranging from $7 per capita in Missouri to $365 per capita in the District of Columbia. While Missouri’s spending held steady at $7 per capita between 2019 and 2020, the District of Columbia increased its funding by $2 per capita and stayed far ahead of the next-highest funding rate of $215 per capita seen in Alaska. Kentucky held the median spot for 2020, spending $36 per person on public health.
Figure 1. Per Person Public Health Funding, 2020
A Handful of States Consistently Near the Top for Public Health Spending
Five states (Alaska, Hawaii, Idaho, New York, and California) and the District of Columbia were consistently among the top 10 for public health funding over the course of the last 10 years (2011 through 2020). Alaska, the District of Columbia, and Hawaii were among the top five for public health spending during each of the last ten years as well, with Alaska and Hawaii each having been the top spending state four times.
A Few States Consistently among Lowest-Ranked for Public Health Spending
There was more movement among the ranks of the states with the lowest public health spending than among the highest-ranking states from 2011 to 2020. Just three states were consistently among the bottom 10 for public health spending during this time: Missouri, Nevada, and Mississippi. Missouri and Nevada were among the bottom five for public health spending during each of the last ten years as well, and each of the two states was the lowest spending state overall five times.
Explore Additional Public Health Data at State Health Compare
Visit State Health Compare to explore national and state-level estimates for the following public health indicators:
- Weight Assessment in Schools
- School Nutrition Standards Stronger than USDA
- School Required to Provide Physical Activity
- Smoke Free Campuses
- Cigarette Tax Rates
State Health Compare also features a number of other indicator categories, including health insurance coverage, cost of care, access to and utilization of care, care quality, health behaviors, health outcomes, and social determinants of health.
1 McKillop, M., & Lieberman, D.A. (May 2021). “The Impact of Chronic Underfunding on America’s Public Health System: Trends, Risks, and Recommendations, 2021.” Trust for America’s Health Issue Report. Available at https://www.tfah.org/wp-content/uploads/2021/05/2021_PHFunding_Fnl.pdf
2 With the exception of data year 2006, for which no estimates are available.

