
Blog & News


Review of Health Insurance Coverage Data in 2021: Releases and Resources
February 27, 2023:Each year, SHADAC covers the releases of health insurance coverage data from major federal surveys such as the American Community Survey (ACS) and Current Population Survey (CPS), both of which are overseen by the U.S. Census Bureau.1 Not only do these data provide an understanding of trends for the millions of individuals in the United States who lack any type of coverage, but they also give indications of changes in other major forms of health insurance, like public coverage, private coverage, and employer-sponsored coverage.
SHADAC researchers work to provide insights into these data in a variety of formats (including reports, blog posts, and webinars) and analyze a multitude of important demographic groups (children, families living below poverty levels, and for communities of color). We also know that to truly understand the trends and vagaries of health insurance coverage, it’s important to look beyond national-level statistics, to see what’s happening at the state level.
That’s why we recently updated one of the longest-running measures on SHADAC’s data tool, State Health Compare, “Health Insurance Coverage Type” with the latest data for 2021. Users can take a look at estimates of health insurance coverage across all 50 states by type (uninsured, employer-sponsored, Medicaid/CHIP, etc.), by categories (age, education level, race/ethnicity, marital status, poverty level, etc.),2 over time (from 2008-2021),3 and can even examine estimates using color-coded maps, trend and bar charts, or by ranking states in terms highest and lowest rates for any coverage type.
2021 Key Findings
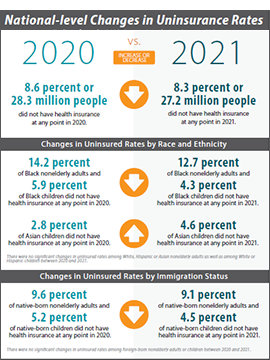
After multiple disruptions to data collection efforts resulted in data quality issues for 2020 ACS estimates, SHADAC is excited that data for 2021 are able to be used with confidence once again—though users are cautioned not to compare data to the prior year. Nationally, the U.S. saw a near-record low rate of uninsurance in 2021, at 8.6%, second only to a rate of 8.5% in 2016.
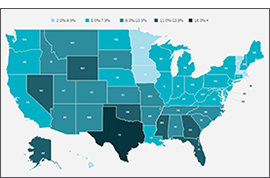
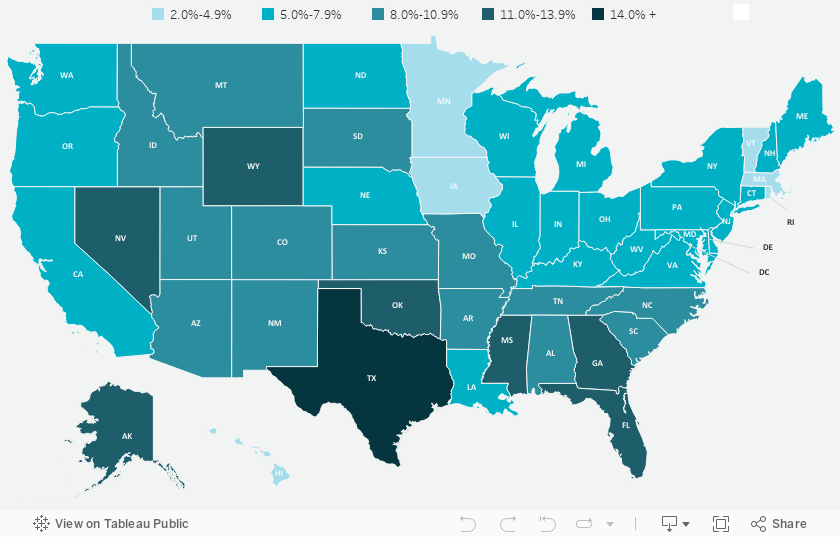
Looking at the state level, however, shows much wider variation in uninsured rates, from a low of 2.4% in Massachusetts to a high of 17.9% in Texas. By larger demographic groups:
- Among children (age 0-18), 5.4% were uninsured in 2021; however, by state, this ranged from 1.1% in Massachusetts to 11.8% in Texas.
- Among those below the poverty level, 15.6% were uninsured in 2021; however, by state, this ranged from 4.4% in Vermont to 30.5% in Texas.
- Among individuals with less than a high school degree, 22.2% were uninsured in 2021; however, by state, this ranged from 5.9% in Massachusetts to 41.4% in Texas.
- Among people reporting “Fair” or “Poor” health status, 25.9% were uninsured in 2021; however, by state, this ranged from 17.9% in Louisiana to 44.7% in Utah.
SHADAC Publications
For a full range of available products from SHADAC’s coverage of the 2022 health insurance data release (2021 estimates) please see below.
|
2021 CPS ASEC: National-level |
An Annual Conversation with |
Comparing Federal Government |
|
2021 ACS: State-level Analysis |
2019 vs 2021 ACS: State and |
2017-2021 ACS: 5-year State and |
- CPS ASEC: 2021 National Health Insurance Coverage Estimates Show Falling Uninsured and Private Coverage Rates Across Population Demographics (Blog & Infographic)
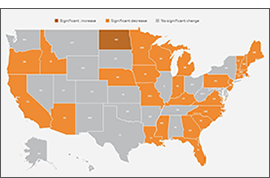
- 2021 ACS: Estimates Show Declining Uninsurance Rates Across 28 States, Driven by Rise in Public Coverage and Fall in Private Coverage (Blog & Interactive Maps)
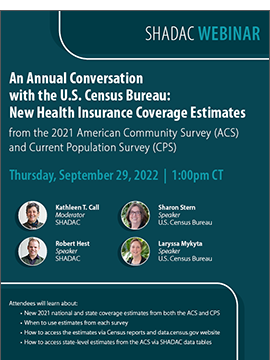
- An Annual Conversation with the U.S. Census Bureau: Coverage Estimates from the 2021 ACS and CPS (Webinar Recording)
- 2021 ACS Data: State and County Uninsured Rates, with Comparison Year 2019 (Blog, Interactive Map, & Data Tables)
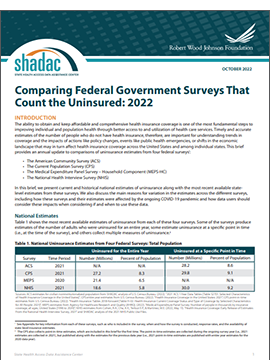
- Comparing Federal Government Surveys That Count the Uninsured: 2022 (Issue Brief)
- 2017-2021 ACS: 5-year Combined State and County Uninsured Rates (Blog, Interactive Map, & Data Tables)
For more detailed estimates on health insurance coverage in 2021, please visit State Health Compare. Be sure to also check out our helpful guide to Navigating Data on State Health Compare for more on what users can do with this unique data tool!
1 SHADAC also covers health insurance coverage data releases from both the National Health Interview Survey (NHIS) and the Medical Expenditure Panel Survey (MEPS). For more on the NHIS, see a recent blog post discussing the early release estimates from the first half of 2022, and for more on the MEPS, see the latest edition of our of Employer-Sponsored Health Insurance report.
2 Because of changes made in 2020 to how the ACS measures race and ethnicity, caution should be used when comparing data by race and ethnicity from 2021 and later to data from 2019 and earlier.
3 As previously documented by SHADAC, 2020 ACS data were unfortunately severely disrupted by the COVID-19 pandemic, resulting in the choice by the U.S. Census Bureau to release the estimates in an “experimental-only” capacity. For that reason, SHADAC created a special “Health Insurance Coverage Type (2020)” measure using data from the CPS. For more on the reasoning behind using the CPS instead of the ACS and the differences between the two surveys, please see our explanatory blog post.
Blog & News

Recent Publication Round-Up: The 2021 Medicaid Undercount
February 1, 2023:Research has consistently shown that surveys that measure health insurance coverage underestimate the number of people enrolled in Medicaid; this is known as the “Medicaid undercount.” SHADAC researchers have long monitored and investigated the magnitude, causes, and effects of the Medicaid undercount across surveys such as the American Community Survey (ACS) and Current Population Survey Annual Social and Economic Supplement (CPS ASEC) and its prevalence across states and populations.
Two recent SHADAC publications investigate the large increase in the size of the undercount in the 2021 ACS, providing new information and guidance for data users:
The first, “Medicaid Undercount Doubles, Likely Tied to Enrollee Misreporting of Coverage,” describes the large increase in the undercount in the ACS, using longitudinal data from the CPS ASEC to analyze the extent to which the increase in the undercount may be tied to an increase in Medicaid enrollees’ misreporting of coverage due to the pandemic-era Medicaid continuous coverage requirement. |
The second, “Tracking the Medicaid Undercount in the 2021 ACS Coverage Data,” presents state variation in the 2021 ACS’ undercount, how analytic choices such as health insurance coverage hierarchies and misaligned analytic universes (i.e., all persons vs. noninstitutionalized persons) can affect the apparent size of the undercount, and best practices for using 2021 ACS coverage data in light of the increased undercount. |
SHADAC continues to monitor and investigate the Medicaid undercount in surveys of health insurance coverage. The undercount will remain an active area of interest as survey estimates of 2022 health insurance coverage are released later this year and as the “unwinding” of the Medicaid continuous coverage requirement begins this spring.
Publication
Tracking the Medicaid Undercount in the 2021 ACS Coverage Data
Research has consistently shown that health insurance coverage surveys underestimate the number of people enrolled in Medicaid and the extent of this “Medicaid undercount” varies greatly across surveys and states. Among these surveys that measure health insurance coverage, the American Community Survey (ACS) has been shown to have a smaller Medicaid undercount, which is one of the reasons that SHADAC typically relies on this survey to track state-level health insurance coverage.
The “Medicaid undercount” refers to the discrepancies that exist between survey estimates of enrollment in Medicaid and the number of enrollees that are actually reported in state and national administrative data.
With 2021 ACS data being given its normal, official release by the Census Bureau following COVID-19 pandemic-related disruptions, SHADAC is again using the ACS as our primary data source for monitoring state-level health insurance coverage. However, as we and other data users have begun analyzing the 2021 ACS data, it has become apparent that the extent of the ACS’ Medicaid undercount was larger in 2021 than in prior years.
Given the evidence of a greater Medicaid undercount in the 2021 ACS, it is important for users to understand the undercount in the ACS when interpreting coverage estimates. In this brief, we review the research regarding the Medicaid undercount in the ACS, provide estimates of how the undercount varies across states, discuss the impact of assigning single coverage for those with multiple sources on the Medicaid undercount in the ACS, and provide guidance on how to understand health insurance coverage data in the 2021 ACS.
Related SHADAC Resources
Medicaid Undercount Doubles, Likely Tied to Enrollee Misreporting of Coverage (Issue Brief)
Understanding the Undercount of Medicaid Enrollees in the 2020 CPS (SHADAC Blog)
Medicaid Expansion and the Medicaid Undercount in the ACS (Research Article)
Medicaid Undercount Project (Collaborative Study)
Publication
2021 ACS Data: State and County Uninsured Rates, with Comparison Year 2019
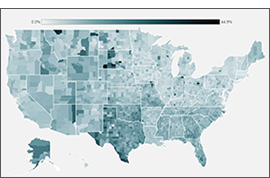
Each year, SHADAC uses data released from the American Community Survey (ACS) via the U.S. Census Bureau's data.census.gov tool to produce estimates of uninsurance at the state and county level.*
Click on a state in the interactive map below to view a PDF table of uninsured rates by state and sub-state geographies, but also by demographic characteristics (e.g., age, race/ethnicity, and poverty level) for 2021 and comparison year 2019.^
Click here to view uninsurance estimates for the United States.
Click here to view uninsurance estimates for Puerto Rico and its municipios.
Note: These tables present uninsured rates, which indicate the share of the population that is uninsured. For example, a 10 percent uninsured rate for adult women indicates that 10 percent of all adult women are uninsured.
Additional Estimates (50-State Comparisons)
Maps & Tables of Private, Public, & Uninsured Changes from 2019 to 2021
Private Coverage Rates by State, Change from 2019 to 2021, for All People
Public Coverage Rates by State, Change from 2019 to 2021, for All People
Uninsurance Rates by State, Change from 2019 to 2021, for All People
Uninsurance Rates by State, Change from 2019 to 2021, for Children under age 18
About the ACS
The ACS is a household survey that began in 2005 and produces annually updated data on a variety of population characteristics, including health insurance coverage. In total, the ACS surveys approximately three million U.S. households each year. An important feature of the ACS is that it includes a large enough sample for state‐level and sub‐state estimates.
The ACS began asking survey respondents about health insurance coverage during the 2008 calendar year. Specifically, the survey asks respondents about current coverage for each person in the respondent’s household. A person is categorized as “insured” if he or she has coverage at the point in time at which the survey is administered.
*Why Aren’t Estimates Provided for All Counties?
Due to sample size constraints, single-year ACS estimates are available at the county level only for counties with a population greater than 65,000.
^Why Are the Estimates Being Compared to 2019 and not to 2020?
Impacts of the COVID-19 pandemic on survey data collection and dissemination efforts, as well as the presence of measurable nonresponse bias, resulted in ACS estimates from data year 2020 being released on an “experimental only” basis, and the Census Bureau has recommended that these estimates not be used or compared to any other data year.
How Are These Estimates Different from the Estimates that SHADAC Publishes Using Census Bureau Micro-Data Files?
Two definitions used by the Census Bureau to generate the tabulations above differ from those that SHADAC uses to generate tabulations for State Health Compare. The definitional differences are as follows:
Family
The Census Bureau defines a family as “all related people in a household.”
SHADAC defines a family using a measure called the “Health Insurance Unit” (HIU), which includes all individuals who would likely be considered a family unit in determining eligibility for either private or public coverage.
To learn more about the 2020 update of SHADAC's Health Insurance Unit (HIU) see our HIU resource page, which houses two issue briefs: The first describes the SHADAC HIU, its purpose, the most recent update, and improvements to HIU data inputs; and the second outlines the impacts of using the SHADAC HIU in analysis so that researchers can assess whether the SHADAC HIU is suitable for their research and what the potential impacts of its use might be. The page also provides a link to STATA and SAS codes to aid in the use of the HIU variable.
Family Income
The Census Bureau determines family income as a percentage of the Federal Poverty Level (FPL), which is a definition of poverty used primarily for statistical purposes. For example, FPL is used to estimate the number of Americans living in poverty each year.
SHADAC determines family income as a percentage of the U.S. Department of Health and Human Services’ Federal Poverty Guideline (FPG), which is a measure used for administrative purposes. For example, FPG is used to determine eligibility for federal programs such as Medicaid and the Supplemental Nutrition Assistance Program (SNAP).
Check out our blog post from May 2022 to learn more about the difference between FPL and FPG,
Related ACS Materials:
Publication
Medicaid Undercount Doubles, Likely Tied to Enrollee Misreporting of Coverage
 Medicaid and Children’s Health Insurance Plan (CHIP) programs have played a key role in responding to the COVID-19 pandemic, providing an important safety net for health insurance coverage for millions of people during this unprecedented public health crisis. The Families First Coronavirus Response Act enacted the continuous coverage requirement, which provides a 6.2 percentage point increase in federal matching funds for states that maintain continuous Medicaid enrollment until the end of the public health emergency. Subsequently, administrative records show that enrollment in Medicaid and CHIP has grown substantially.
However, key federal surveys such as the American Community Survey have failed to show the extent of this growth in the population with Medicaid/CHIP coverage. This brief describes our analysis of these estimates, focused on the size of the “Medicaid undercount”, the misalignment between survey estimates of self-reported Medicaid coverage, and enrollment counts obtained from Medicaid/CHIP administrative data.
The Medicaid undercount in the 2021 American Community Survey (ACS) was larger than in earlier years, which we believe was tied, at least in part, to the Medicaid continuous coverage requirement. In the brief, we also present analysis of two years of linked data from the Current Population Survey Annual Social and Economic and Supplement (CPS ASEC). Our results suggest that despite having continuous coverage, many enrollees may not have known they were still covered by Medicaid.
Related Resources

