Blog & News
Vaccinating children may be key to reaching COVID-19 herd immunity
March 29, 2021:Few states could hit 80% vaccination rate until children are eligible
As more people become vaccinated against COVID-19, it’s understandable that many want to return to “normal.” Recognizing that desire, the U.S. Centers for Disease Control and Prevention (CDC) recently published guidance on activities people can engage in after being fully vaccinated; for instance, those who are fully vaccinated may socialize indoors, without a mask, with other fully vaccinated people.1
However, as the U.S. still works toward a goal of “herd immunity,” in which a sufficient share of the population has been vaccinated to stem the spread of the virus, the CDC also recommends that everyone—including fully vaccinated individuals—continue to take precautions. For example, people should continue to wear masks and social distance in public, avoid large gatherings, and postpone travel plans until enough people are vaccinated.
While the herd immunity threshold to halt community spread of COVID-19 is yet unknown, experts such as Dr. Anthony Fauci, director of the National Institute of Allergy and Infectious Disease, estimate the rate is somewhere between 70-90 percent of the population. The development and authorization of multiple vaccines raises hope for achieving herd immunity, but reaching that goal will be neither fast nor easy.
One major challenge on the path toward herd immunity is that current vaccines are primarily or entirely limited to adults. However, children make up a substantial share of the U.S. population—roughly 22 percent for the country overall, and ranging by state from a low of 18 percent in Vermont to a high of 29 percent in Utah.
State-level population data illustrate the impracticality of reaching herd immunity thresholds until COVID immunization is also broadly available for children. For instance, assuming a 70 percent threshold for COVID, which falls on the lower end of what experts predict, herd immunity would be challenging for most states and almost impossible for others.
Estimated Percentage of State Adult Populations Needed to Reach Total Population Herd Immunity
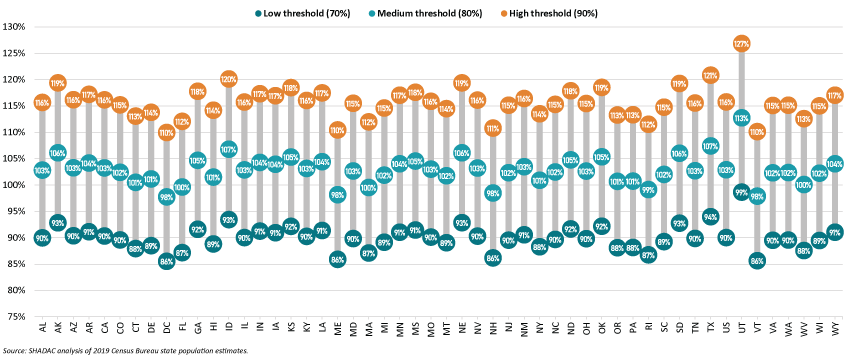
To reach 70 percent of the overall state population by immunizing only adults, Vermont would have to vaccinate 86 percent of the state’s adult population, while Utah would have to vaccinate 99 percent of its adult population. Achieving those goals would necessitate concerted efforts to overcome historic disparities in distribution of vaccines, as well as nascent inequities in the distribution of COVID vaccines, as SHADAC has documented in other analyses.2,3,4
As herd immunity targets increase—from 70 percent to 80 percent to 90 percent—reaching herd immunity through only adults ultimately becomes mathematically impossible for all states due to their sizeable numbers of children, who are largely ineligible for vaccination as of yet.
Eventually, as COVID vaccine trials are completed and the immunizations are approved for children, herd immunity will become a tangible and achievable landmark. The U.S. has decades of experience in successfully immunizing its population against communicable diseases. For example, recent estimates from the CDC show that more than 90 percent of eligible children have received vaccines against chickenpox; hepatitis B; polio; and measles, mumps and rubella.5
But until COVID vaccines have been deeply distributed among both adults and children, it will likely remain important for people to take continued public health precautions such as social distancing and wearing face masks to slow the spread of the virus, as recommended by the CDC.
Related Reading
Measuring Coronavirus Impacts with the Census Bureau's New Household Pulse Survey: Utilizing the Data and Understanding the Methodology (SHADAC Blog Series)
State-level Flu Vaccination Rates among Key Population Subgroups (50-state profiles) (SHADAC Infographics)
50-State Infographics: A State-level Look at Flu Vaccination Rates among Key Population Subgroups (SHADAC Blog)
Anticipating COVID-19 Vaccination Challenges through Flu Vaccination Patterns (SHADAC Brief)
Ensuring Equity: State Strategies for Monitoring COVID-19 Vaccination Rates by Race and Other Priority Populations (Expert Perspective for State Health & Value Strategies)
1 Centers for Disease Control and Prevention (CDC). (2021, March 8). Interim Public Health Recommendations for Fully Vaccinated People. https://www.cdc.gov/coronavirus/2019-ncov/vaccines/fully-vaccinated.html
2 Planalp, C. & Hest, R. (2021). Anticipating COVID-19 Vaccination Challenges through Flu Vaccination Patterns. State Health Access Data Assistance Center (SHADAC). https://www.shadac.org/publications/anticipating-covid-19-vaccination-challenges-through-flu-vaccination-patterns
3 State Health Access Data Assistance Center (SHADAC). (2021). State-level Flu Vaccination Rates among Key Population Subgroups (50-state profiles). https://www.shadac.org/publications/state-level-flu-vaccination-rates-among-key-population-subgroups-50-state-profiles
4 State Health Access Data Assistance Center (SHADAC). (2021). Measuring Coronavirus Impacts with the Census Bureau's New Household Pulse Survey: Utilizing the Data and Understanding the Methodology. https://www.shadac.org/Household-Pulse-SurveyMethods
5 National Center for Health Statistics (NCHS). (2021, March 1). Immunization. Centers for Disease Control and Prevention (CDC). https://www.cdc.gov/nchs/fastats/immunize.htm
Blog & News
Expert Perspective: States’ Reporting of COVID-19 Health Equity Data (State Health & Value Strategies Cross-Post)
September 14, 2020:The following content is cross-posted from State Health and Value Strategies. It was first published on April 22, 2020.
Authors: Emily Zylla, Lacey Hartman & Lindsey Theis - SHADAC
Throughout the coronavirus pandemic SHADAC has been tracking which states are regularly reporting data that could help shed light on the health equity issues of this crisis. Collecting disaggregated demographic data on the impact of COVID-19 is one way to advance health equity during response efforts. We have found that all states are reporting some data on the coronavirus (COVID-19) outbreak, but the type and granularity of information varies considerably across states. In this expert perspective we provide updated interactive maps that explore the current status of all 50 states and the District of Columbia’s reporting of COVID-19 case and death data breakdowns by age, gender, race, ethnicity, and health care workers; and provide an update on the status of states’ reporting of hospitalization and testing data by demographic categories. We also highlight examples of states that are undertaking new, or additional, COVID-19 related data collection, reporting, or research activities to understand health disparities across populations. Finally, we summarize new federal guidance related to COVID-19 data reporting.
Current Status of COVID-19 Health Equity Reporting
The number of states reporting disaggregated COVID-19 case and mortality data has increased significantly since the start of the pandemic. All states now report race or ethnicity data for either COVID-19 cases or mortalities, a marked improvement from back in April when just over half (27) of states were reporting COVID-19 cases by race, and only 22 states were reporting COVID-19 deaths by race. Additionally, at the beginning of the epidemic, only three states reported information about how the distribution of cases by race/ethnicity compared to the state’s underlying population distribution. To date, 38 states are reporting their data in this way, which is helpful for understanding the extent to which COVID-19 is disproportionately impacting certain populations.
At the start of the pandemic, 13 states were reporting COVID-19 cases by residence type, and only six states were reporting deaths by residence type. Today, all states report cases by residence type, and 47 states report deaths by residence type. Similarly, the number of states reporting the number of health care workers with positive COVID-19 cases has increased from 10 to 26, and the number of states reporting COVID-19 deaths by underlying conditions has increased from 4 to 17.
We expect that as states work to comply with the new federal reporting guidance (see below), the number of states reporting disaggregated case and testing data by various indicators will continue to increase. The number of states reporting disaggregated hospitalization and testing data, however, remains low, with just over half (26) of states reporting hospitalization data breakdowns and only eight states reporting some type of testing data breakdowns.
The maps below show how states are reporting disaggregated data for positive COVID-19 cases (Figure 1) and COVID-19 mortality data (Figure 2) and can be filtered to highlight which states are reporting by each health equity category. States marked by a darker shade of color are reporting more data breakdown categories than lighter-shaded states. Clicking on a state provides a link to each state’s data-reporting website along with more detailed information about which breakdowns a state is reporting.
Figure 1
Figure 2
Hospitalizations
In our scan, we identified 26 states that are reporting hospitalization data for some subpopulations, but of those only 18 are reporting hospitalization data by race or ethnicity. (Figure 3.)
Figure 3
Testing
Our scan revealed eight states that are providing testing information by age and gender, and only five—Delaware, Illinois, Indiana, Kansas, and Nevada are also disaggregating testing data by race and ethnicity.
New COVID-19 Related Health Equity Data Activity
In addition to the newly required demographic data required above, several states are exploring, or beginning to report, additional data. For example:
· On September 8th, California became the first state in the nation to require the collection of sexual orientation and gender identity data for all COVID-19 patients.
· Pennsylvania announced it will work with a new data collection platform to collect sexual orientation and gender identity data.
· Minnesota is reporting language needs for positive cases interviewed and language by county of residence
· Massachusetts signed into law an act addressing COVID-19 data collection, requiring the Department of Public Health to compile, collect, and report several demographic factors, including whether an individual hospitalized speaks English as a second language.
A number of states have also formed health equity task forces, several of which are charged with looking at what additional data could be collected and reported. For example:
Colorado: A COVID-19 Health Equity Response Team, headed by the Office of Health Equity, was formed to look at inequities and ways to prevent gaps from widening during the pandemic. One of the Response Team’s tasks is to ensure racial and ethnicity COVID-19 data are accessible, transparent and used in decision-making.
Indiana: A legislative task force, led by the Indiana Black Legislative Caucus and in collaboration with the Interagency State Council on Black and Minority Health, the Indiana State Department of Health Office of Minority Health, and the Indiana Minority Health Coalition, was charged with studying racial disparities in health care and health care outcomes as it relates to COVID-19. The Task Force recommended the collection, stratification, analysis and reporting of race, ethnicity and preferred language data; and recommended action plans and annual reports of race, ethnicity, and preferred language outcomes.
Louisiana: A COVID-19 Health Equity Task Force examined how health inequities are affecting communities that are most impacted by the coronavirus. The Task Force’s Subcommittee on COVID-19 Data and Analysis made several recommendations in its report, including: establishing standardized protocols to ensure that information is consistently collected across the multiple testing sites, especially those pertaining to racial and ethnic identity; ensuring data collection occurs in collaboration with trusted organizations, e.g. tribal organizations and faith-based organizations or nonprofits within the Asian community; creating a data warehouse where harmonized data can be easily extracted for analysis; and allocating resources allocated to the Louisiana Department of Health to accomplish these goals.
Michigan: The Michigan Coronavirus Task Force on Racial Disparities serves as an advisory board within the state's Department of Health and Human Services. Among several charges, the Task Force will: study racial disparities of COVID-19 in Michigan and recommend action to overcome the disparities; recommend actions to increase transparency in reporting data regarding the racial and ethnic impact of COVID-19 and remove barriers to accessing physical and mental health services; and ensure stakeholders are informed, educated, and empowered with information on the racial disparities of COVID-19.
New Hampshire: The Governor’s COVID-19 Equity Response Team was charged with developing a recommended strategy to address the disproportionate impacts of the COVID-19 pandemic. Initial recommendations included: Adopting and following best practices (outlined in the report) for equitable data collection, analysis, dissemination, and utilization; dedicating staff with specific expertise in equitable data best-practice methodologies; and developing internal protocols that require the use of a vetted and approved Equity Review Tool analysis for all programmatic and policy work.
Ohio: The Minority Health Strike Force was charged with addressing the disproportionate impact of COVID-19 on minority populations in the state. The strike force was comprised of four subcommittees: data and research; education and outreach; health care; and resources. The groups’ Blueprint report included data-specific recommendations to improve data collection and reporting, have state agencies develop dashboards to monitor inequities and disparities, and consider the need for sufficient samples to identify disparities in groups with small population sizes. The Governor’s subsequent Executive Response included a commitment to: collect state-level health care quality information stratified by race, ethnicity, and language data; identify the contributing and confounding factor affecting the health disparities; identify and targeting the resources where interventions may be best applied; adopt of standards by state agencies to achieve a normalized set of data that uses the same categorization scheme; and establish evaluation criteria of impacts to inform policy.
Pennsylvania: The Pennsylvania COVID-19 Response Task Force on Health Disparity is charged with identifying obstacles that cause disparity for marginalized populations. The group collaborated with community members, stakeholders, and legislators to send recommendations to the Governor for addressing issues related to a higher incidence of COVID-19 among minorities. The group recommended instituting a statewide standard around racial/ethnic data collection that mirrors the standards in the Affordable Care Act, and disaggregating Asian health data.
Tennessee: The Tennessee Department of Health, Office of Minority Health, launched a statewide Health Disparities Task Force to: examine existing data, monitor trends, and hear from those living, working and serving Tennessee communities to generate responsive solutions and policies to reduce health disparities.
Vermont: A Racial Equity Task Force will undertake projects designed to promote racial, ethnic and cultural equity, including evaluating structures of support for racially diverse populations, including a focus on the racial disparities in health outcomes highlighted by COVID-19. It will submit recommendations to the Governor on the COVID-19 project by August 15.
CARES Act Reporting Requirements
In March 2020 Congress passed, and the President signed, the Coronavirus Aid, Relief, and Economic Security (CARES) Act. The statute required “every laboratory that performs or analyzes a test that is intended to detect SARSCoV-2 or to diagnose a possible case of COVID-19” to report the results from each such test to the Secretary of the Department of Health and Human Services (HHS), and authorized HHS to prescribe the form and manner of such reporting. On June 4, HHS released new guidance outlining the data elements required for reporting, which included, among other elements:
· Patient age
· Patient race
· Patient ethnicity
· Patient sex
· Patient residence zip code
· Patient residence county
· If the patient is employed in health care
· Is the patient a resident in a congregate care setting (including nursing homes, residential care for people with intellectual
and developmental disabilities, psychiatric treatment facilities, group homes, board and care homes, homeless shelter,
foster care or other)
· If the patient is hospitalized
· If the patient is pregnant
The guidance also indicates that additional data elements may be requested by state, local, or federal health departments at any time. If required data elements are not available, providers, laboratories and public health departments are encouraged to leverage resources like state, regional, or national Health Information Exchanges or Networks to obtain missing, required information. Reporting of these data elements must begin no later than August 1, 2020. While this guidance applies to all laboratories, it does not require states or local public health departments to report COVID-19 mortality data by any specific demographic breakdowns.
Blog & News
Expert Perspective: State COVID-19 Data Dashboards (State Health & Value Strategies Cross-Post)
April 10, 2020:The following content is cross-posted from State Health and Value Strategies. It was first published on April 9, 2020.
Authors: Emily Zylla and Lacey Hartman, SHADAC
Accurate, timely data is a key tool in states’ efforts to understand and respond to the impact of the coronavirus (COVID-19) outbreak at the local level. There have also been increasing calls to further break down COVID-19 data into subcategories (such as by gender, age, and race and ethnicity) in order to track the impact of the disease on specific populations. As of April 6, all 50 states and DC are publicly reporting some type of data related to COVID-19, such as the number of positive tests and/or the number of deaths. Furthermore, some states have recently begun to utilize innovative dashboards in order to visualize and track reported cases of coronavirus disease as well as monitor additional related key indicators. These dashboards are designed to organize complex data in an easy-to-digest visual format, allowing the audience to easily interpret key trends and patterns at a glance (e.g., see SHADAC’s COVID-19 dashboard template, which is currently under development using mock data).
Source: SHADAC COVID-19 dashboard template under development using mock data.
This expert perspective reviews the key indicators currently being tracked by states via their COVID-19 dashboards and also provides an overview of “best practices” states can consider when developing or modifying these same COVID-19 dashboards.
| States that currently publish COVID-19 dashboards include: |
|
| Alabama | Montana |
| Alaska | Nebraska |
| Arizona | Nevada |
| Arkansas | New Jersey |
| California | North Carolina |
| Colorado | North Dakota |
| Delaware | Ohio |
| Florida | Oregon |
| Idaho | South Carolina |
| Indiana | Texas |
| Iowa | Utah |
| Kansas | Virginia |
| Louisiana | Washington |
| Maryland | West Virginia |
| Minnesota | Wyoming |
| Missouri | |
Current Status of COVID-19 Dashboards
As of April 6, we identified 31 states with public-facing COVID-19 data dashboards (i.e., the information is displayed with charts and other graphics, not just in tabular form), and we anticipate that more states will publish COVID-19 dashboards in the coming days.
States are reporting a wide number (ranging from 4 to 13) and type of indicators in their dashboards, most of which are updated at least daily.
Many states are also starting to show trends in these data points over time. The most common indicators reported on a state dashboard include:
- Number of total cases
- Number of total deaths
- Number of cases by county
- Map of cases by county
- Number of tests completed
- Number of cases by age group
- Number of cases by gender
- Number of deaths by county
- Number of hospitalizations
Other key indicators that some states are reporting that may be of interest include:
- Total number of recovered cases (i.e., cases that are no longer required to isolate)
- Number of hospitalizations that require ventilation
- Number of deaths by age/gender/race/ethnicity
- Case rate per 100,000 people by county
- Number of cases by race/ethnicity
- Number of cases by congregate living setting (e.g., long-term care, assisted living, dorms, jails, correctional settings, etc.)
- Number of tests completed by laboratory type (e.g., public vs. commercial labs)
- Number of tests completed by race/ethnicity
- Number of calls to a state’s COVID-19 hotline or number of hits on a COVID-19 website
It is important to note that states may be defining indicators that appear initially similar in different ways. For example, some states report “hospitalizations” as the total number of cases who have ever been hospitalized, while other states report “hospitalizations” as the current number of hospitalizations on a certain day. As a result, users should be cautious about making comparisons across states. In most cases, states have not identified the sources of their dashboard data beyond indicating that data is maintained by the respective state’s health department (or equivalent) and that it comes from a variety of sources such as state and local public health surveillance data, lab data (including public health, hospital, and commercial labs), and hospital reporting systems, among others. While the quality of the data being reported is difficult to assess currently (and is therefore reported as provisional), many states have acknowledged that data on confirmed cases represent an undercount due to a lack of widespread testing. Similarly, states have suggested that data on the number of deaths from COVID-19 may also change as post-mortem testing expands and guidance on how to record COVID-19 deaths is established. As mentioned below, we encourage states to include information on data quality, such as levels of missing data, where possible.
COVID-19 Dashboard Best Practices
Audience: Before designing a dashboard, make sure to clearly identify who is the intended audience. Different levels of detail, explanation, or source information may be necessary depending on whether the intended audience is state agency leadership, political leadership, or the general public. It is also important to think about what medium you will be using to reach the audience. Will the dashboard only be published on a website? Will it be available on a mobile device? Or, might you want to print it as a handout or post it on social media?
Organization and layout: Prioritize key measures. Because timeliness of these data is so important, the dashboard needs to have enough data points to convey key information, but limited enough to update quickly. It is helpful to have a landing page that makes all indicators visible to users with limited scrolling, but also provides users with the ability to “drill down” to more detail—comparisons, methodology, etc. If it is not possible to show all indicators, there should be an obvious and intuitive option for the user to “hover” over a list and get an “at a glance” view of the available content. The following example shows Florida’s COVID-19 Dashboard landing page, which implements many of these best practices.
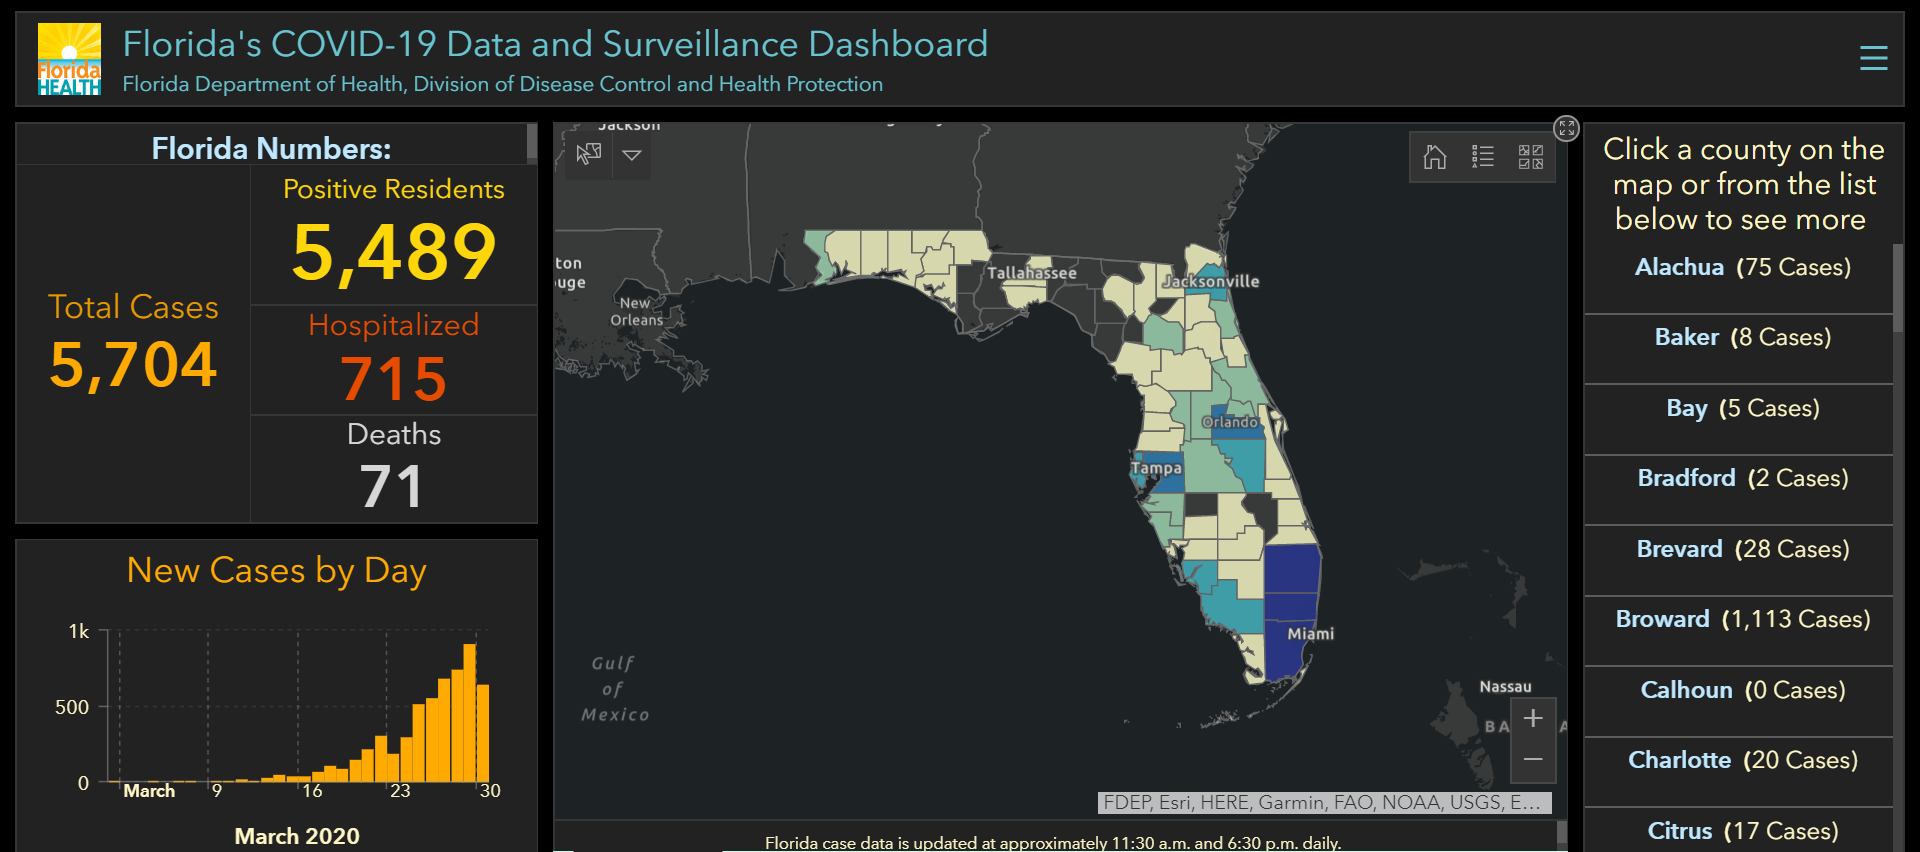
Source: Florida COVID-19 Data and Surveillance Dashboard. Accessed March 30, 2020.
Think about any potential layout in terms of a story. It is helpful to group indicators into high-level categories with headings (e.g., overview, demographics, hospitalizations, etc.). This provides additional context for interpreting the data without the need for lengthy text descriptions. In addition, many dashboards are modular in nature so that visual elements can be replaced as information relevancy changes over time (e.g., information on likely source of exposure may become less relevant over time, while information on health care workforce exposure may become more relevant).
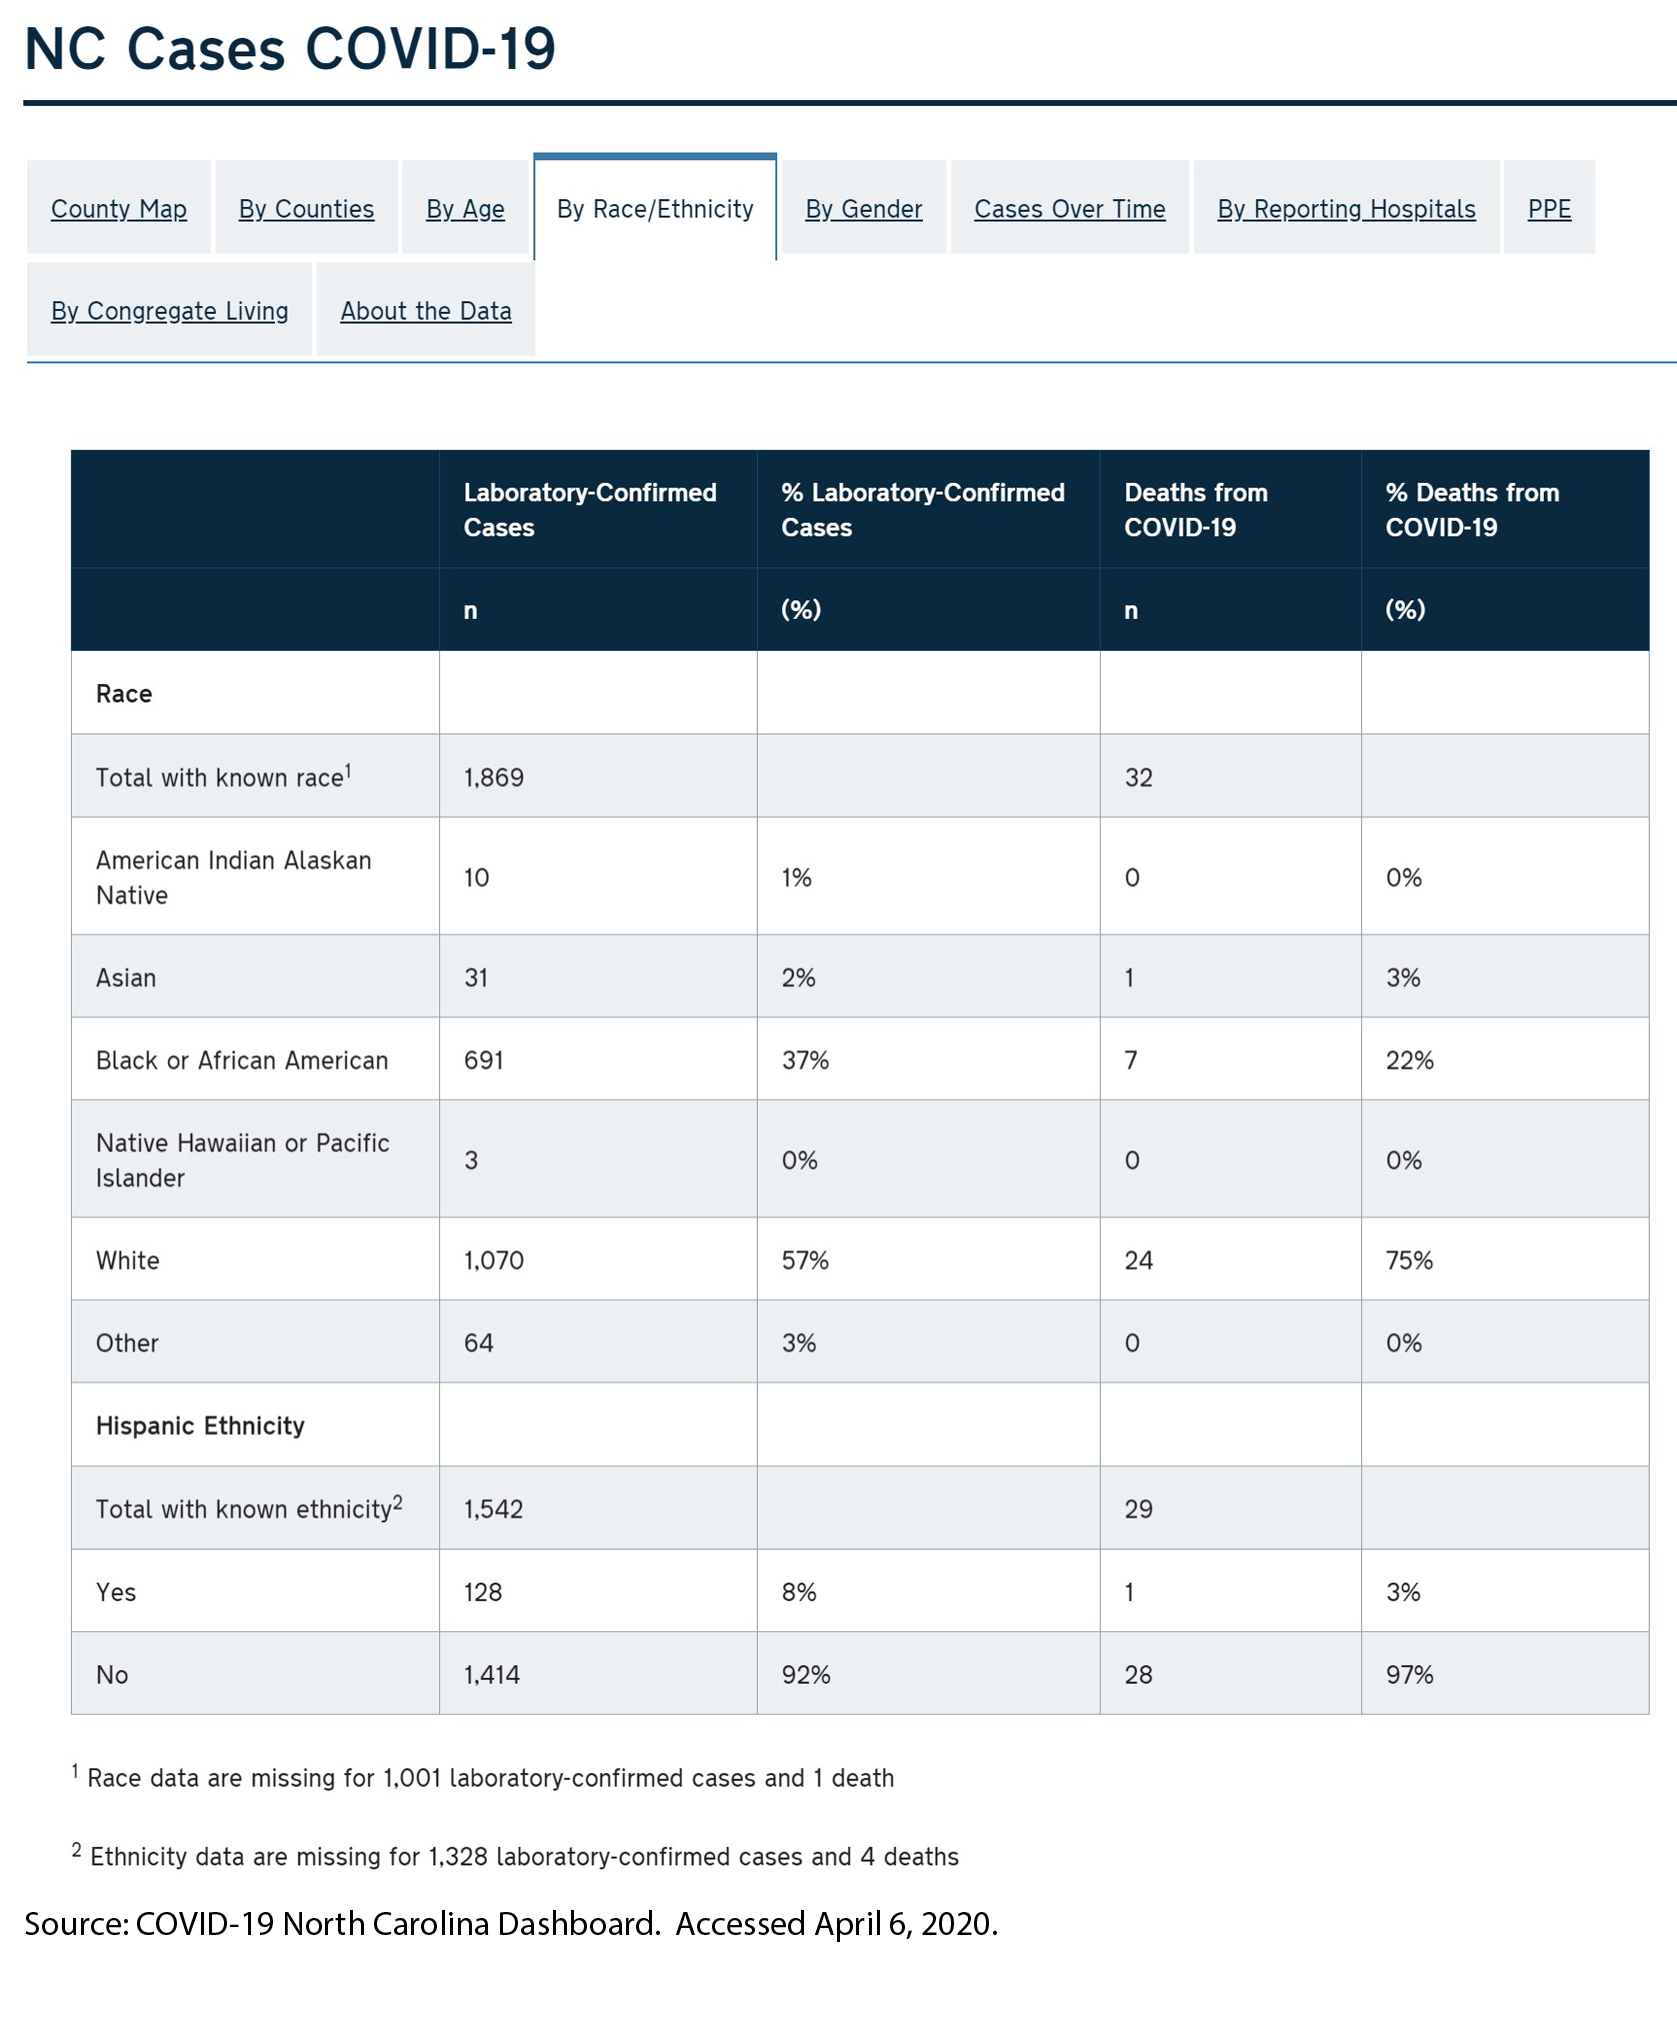
Health equity: In order to understand the potentially disproportionate impact COVID-19 may have on communities of color, low-income, and other populations that face health disparities, it will be important for states to track both COVID-19 related cases and health outcome data disaggregated for key subpopulations, such as gender, race and ethnicity, geography (e.g., urban vs. rural), and insurance status. Several states are reporting data by race/ethnicity, which is critical as early reports suggest that the crisis is disproportionately impacting communities of color. For states that do report data on race, we recommend including detail about the scope of the missing data (and the reason, if possible) to help users interpret the findings. In the example below, North Carolina’s dashboard reports confirmed cases and deaths broken down by race and ethnicity. North Carolina also clearly states the data’s limitations—i.e., the number of cases for which race and ethnicity data are missing.
Another breakdown important for monitoring equity is geography. Nearly all states are reporting data at the county level. It may also be helpful for states to present information that compares metrics in urban versus rural areas, as the unique challenges of the virus (e.g., overcrowding in densely populated areas vs. more limited hospital resources in rural areas) differ significantly by these factors. There are several approaches to defining urban versus rural areas and each have advantages and disadvantages, but given that states are already collecting COVID-19 information at the county level, it may be most straightforward to disaggregate information using the Census definition that classifies counties as “completely rural”, “mostly rural”, and “mostly urban”.
In addition to providing data by race and geography, it would be ideal if states could provide additional subpopulation breakdowns such as primary language, socioeconomic status (e.g., education, income, occupation), and disability status, if the data is available. Due to the rapid emergency response required to address the COVID-19 outbreak, we realize states may not initially have the time or bandwidth to produce a broad range of subpopulation analysis or to conduct additional analyses of their demographic data, such as looking at the intersectionality of data (e.g., by race and gender). However, those types of analyses will be increasingly important as states seek to understand disparities in COVID-19 treatment access, morbidity, and mortality.
Date and time-stamps: Because these indicators are subject to change so rapidly, it will be important to date and time-stamp any dashboard updates. In addition to date-stamping the entire dashboard, also consider adding the date (and source information) to any graphic that could potentially be used as a stand-alone item in another report or on social media. For example, the graphic below represents the age distribution of a state’s COVID-19 cases and is labeled “As of 3/31/2020” so that it’s clear what time period this represents, even when the image is viewed separately from the overall dashboard.
| Data labels, definitions, and sources: Provide clear data labels and documentation. Although you should avoid “cluttering” a dashboard with extensive text, it is also important to provide the audience with information about data definitions and sources. Below is an example from North Dakota’s data dashboard showing how they included definitions for each of their six key indicators below their visualization. If space is limited, it is fine to provide hyperlinks to more detailed information on these factors. However, the links should be tested regularly to ensure they are still “live” and taking users to the correct information. 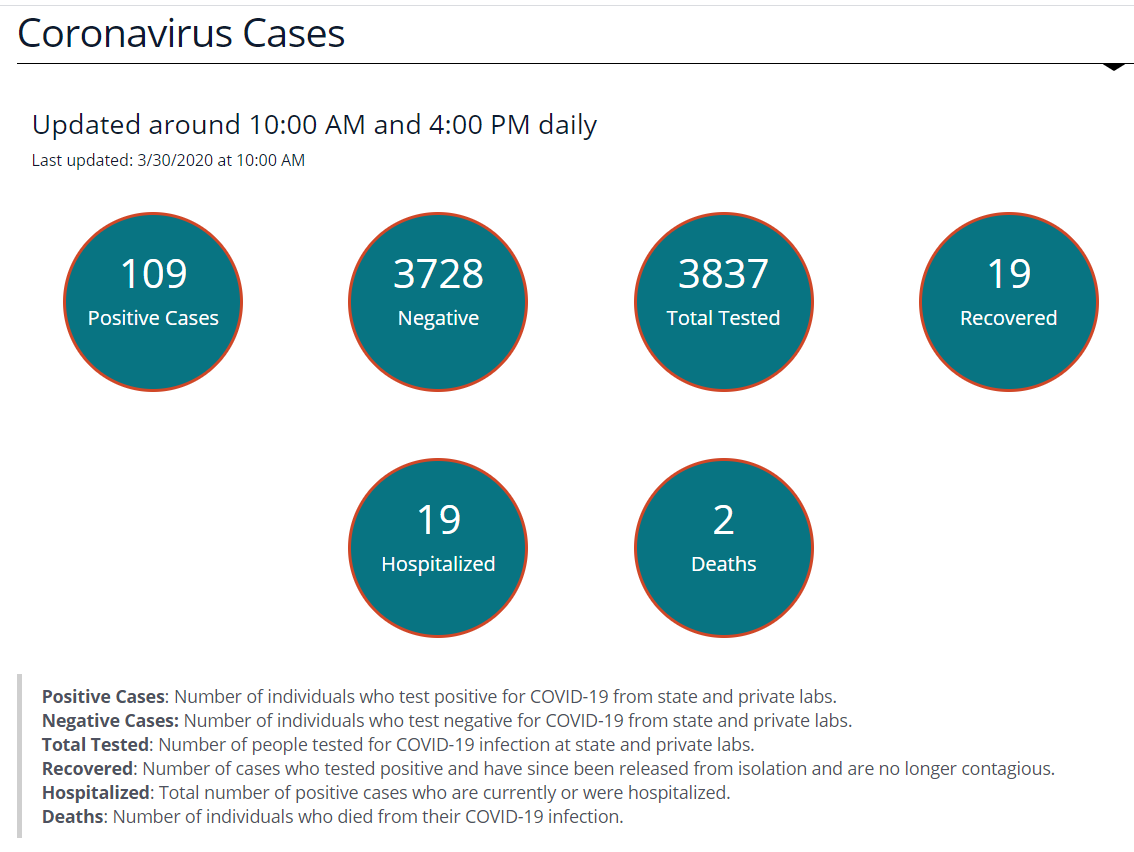 Source: North Dakota COVID-19 Dashboard. Accessed March 30, 2020. Source: North Dakota COVID-19 Dashboard. Accessed March 30, 2020. |
Time-series data: Visually displaying time-series data is an effective way to track changes. In order to improve readability, try to ensure that all time-trended data on the dashboard starts with the same date and covers the same time period, if possible. For example, although deaths and hospitalizations began ramping up at different times, these two time-trended graphs on Ohio’s dashboard start on the same date and cover the same time period. States may also choose to have a dual-axis marking both the date and the week (as shown in the first figure at the top of the page). This helps users understand the broader context of the trends being displayed.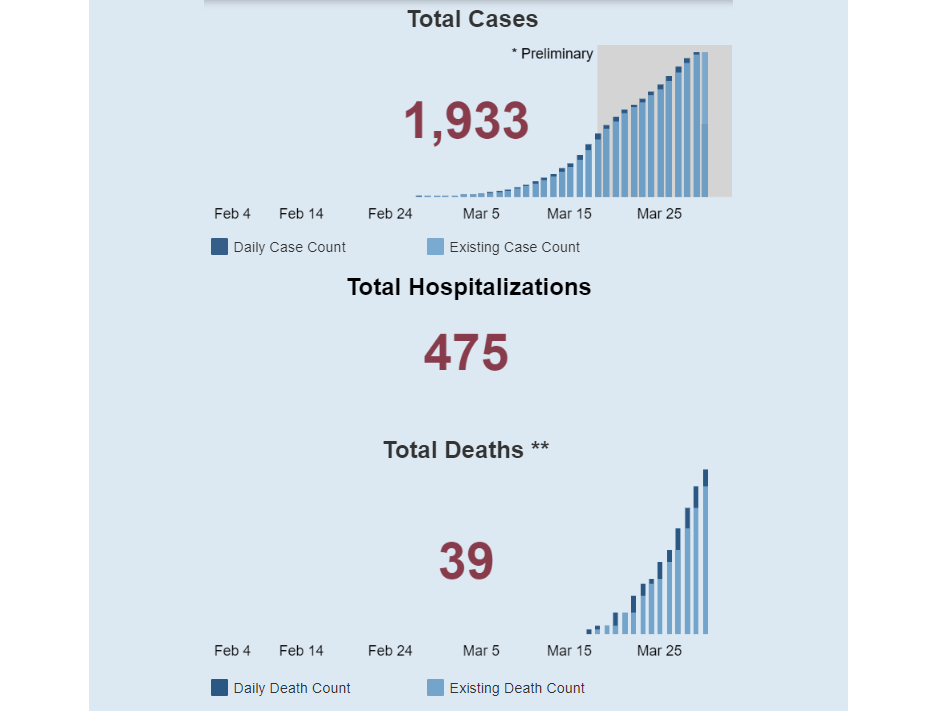 Source: State of Ohio COVD-19 Dashboard. Accessed March 30, 2020. |
Visualizations: Choose visualizations that are clean and compliant with a range of browsers. Simple visualizations can also help users interpret more complex data “at a glance.” For example, many dashboards use up or down arrows to indicate whether most recent data show improvements or declines. Make sure visualizations require limited manual data manipulation. For example, the visual to the right was created so that it links to a back-end Excel spreadsheet, which is easily refreshed.
Documentation to support data updates: After constructing your customized dashboard, create an “instruction sheet” outlining all of the steps necessary to update the data on an ongoing basis, including:
- Which specific cells or inputs need daily updates
- What data sources are being used and where the data is located
- How and where to document what data was pulled and when
This detailed “instruction sheet” is especially important in the event that the individual who normally updates the data is absent or leaves—that way someone else can easily complete the update.
Support for the development of this expert perspective was provided by the Robert Wood Johnson Foundation. The views expressed here do not necessarily reflect the views of the Foundation.
Pages
- « first
- ‹ previous
- 1
- 2
- 3
- 4


