
Blog & News


Minnesota’s COVID-19 vaccine campaign left vulnerable groups with lagging rates
August 2, 2023:Health inequities are nothing new in Minnesota, but the pandemic placed them in a new light. Numerous studies have reported disparities in how COVID-19 affects many vulnerable groups, often placing them at higher risk of infection, hospitalization, and death. And the inequitable effects of the disease itself are not the only cause for alarm. Once COVID-19 vaccines received authorization, disparities in vaccination rates also became a concern, especially as surveys indicated widespread hesitancy and lagging uptake.
Partnering with the Minnesota Electronic Health Record Consortium, SHADAC delved deep into an analysis of COVID-19 vaccination rates in Minnesota. Unlike many other studies, we were able to examine not only how COVID-19 vaccination rates differed across different demographic groups, but also how those disparities developed over time. This type of analysis was possible because of the Consortium’s unique dataset, which matches data from large health care providers’ electronic health records—including detailed demographics with immunization records from the Minnesota Department of Health, ultimately covering almost all people who received a COVID-19 vaccine in the state.
Understanding the dynamics of vaccination disparities over time was a crucial element of our study. While we present data on COVID-19 vaccination rates for different demographic subpopulations at the end of 2022, we also examined the time it took to reach 50 percent of people in different demographic groups with COVID-19 vaccinations. That measure of time to vaccination is important because, in a public health crisis during which hundreds or even thousands of people were dying each day at its peak in the U.S. alone, the speed with which people were vaccinated was critical to saving lives.
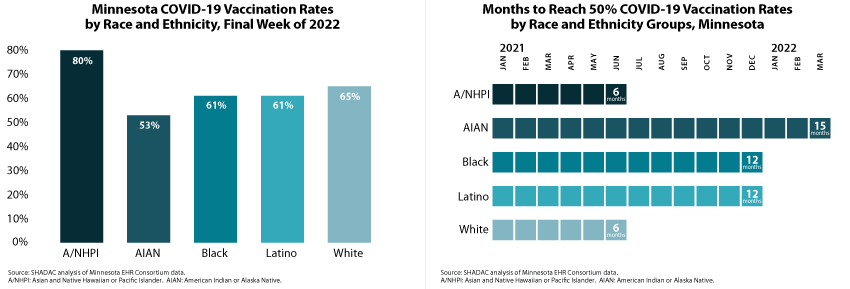
Our approach also allowed us to glean unique insights on COVID-19 vaccination disparities that are hidden below the headline numbers. For instance, although Minnesota’s Black, Latino, and White populations each had similar COVID-19 vaccination rates (61 percent, 61 percent, and 65 percent, respectively) at the end of 2022, they took distinctly different paths to reach that point. Within six months of the first COVID-19 vaccine receiving emergency use authorization, Minnesota vaccinated half of the state’s White population, but it took twice as long (12 months) for the state to vaccinate half of its Black and Latino populations.
 Another crucial but under-recognized factor in COVID-19 vaccination disparities is the way public health policies placed some groups as a disadvantage in accessing vaccines in the early days of limited supply. Because experience showed that elderly people were at higher risk of severe disease and death from COVID-19, they were prioritized to be among the first people eligible for vaccines. But nationwide and in Minnesota, the White population skews older, effectively baking racial and ethnic disparities into the vaccine prioritization criteria. For that reason, we also stratified racial and ethnic groups’ COVID vaccination data by age—an approach that uncovered complex dynamics.
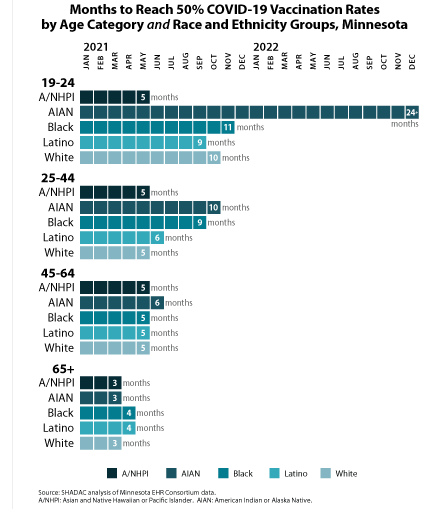
We found that disparities in COVID-19 vaccination rates were relatively small among Minnesota’s elderly population. For instance, Minnesota succeeded in vaccinating half of the elderly population across all racial and ethnic groups within three or four months—an example of how health inequities can be minimized. But disparities were stark among young adults, age 19-24. While Minnesota vaccinated half of Asian and Native Hawaiian and Pacific Islander young adults within five months, it took roughly twice as long to vaccinate half of Latino young adults (nine months), White young adults (ten months), and Black young adults (eleven months). And stunningly, Minnesota had failed to reach half of American Indian and Alaska Native young adults by the end of 2022—approximately 24 months after vaccines were first authorized.
We also examined COVID-19 vaccination rates by other demographic categories, finding higher vaccination rates and quicker vaccination progress among older population groups, urban and suburban communities, and females. Additionally, our study found disappointing rates of COVID-19 vaccination among children, particularly younger children. At the end of 2022, less than one-half of children age 5-11 had been vaccinated, despite having been eligible for vaccines for over a year; and less than one-tenth of children age six months to four years had been vaccinated, despite having been eligible for roughly six months. Despite a common, incorrect notion that COVID-19 is harmless for children, other researchers have found that COVID-19 was a top 10 cause of death for children during the pandemic, so those low vaccination rates are needlessly leaving Minnesota kids at risk.
Together, the findings from this new study highlight two main points: First, Minnesota’s COVID-19 vaccination efforts resulted in clear disparities. When looking at high-level data, it is easy to miss those disparities because some of them narrowed over time. But looking at detailed data illustrates the ways that certain groups were left vulnerable to COVID-19 for much longer than others. Second, our findings on disparities in the time Minnesota took to vaccinate half of different subpopulations demonstrate the importance of monitoring such health equity measures over time. Time is critical in an emergency such as the pandemic, and eventually closing gaps in health disparities simply isn’t good enough. Health equity requires urgency.
SHADAC Expertise
Federal Survey Data Release Schedule
American Community Survey (ACS)
An ongoing general household survey conducted by the U.S. Census Bureau provides annual estimates of health insurance coverage at the national, state, and sub-state geographies.
Released
September 14, 2023
• 2022 ACS 1-year data file
January 2023
• 2017-2021 5-Year Public Use Microdata Sample (PUMS) file
October 2022
• 2021 ACS 1-Year Public Use Microdata Sample (PUMS) file
September 2022
• 2021 ACS 1-year data file (i.e., on data.census.gov)
Other Resources
• An Assessment of the COVID-19 Pandemic’s Impact on the 2020 ACS 1-Year Data Analytic Paper
• Introduction to the American Community Survey Public Use Microdata Sample (PUMS) file
Current Population Survey (CPS)
A monthly household survey conducted by the U.S. Census Bureau for the Bureau of Labor Statistics. Data on income and health insurance coverage is collected in its Annual Social and Economic Supplement administered in February through April. Annual health insurance estimates are provided for the nation and states.
Released
September 12, 2023
• 2022 Income, Poverty and Health Insurance statistics from the Current Population Survey Annual Social and Economic Supplement (CPS ASEC)
September 2022
• 2021 Income, Poverty and Health Insurance statistics from the Current Population Survey Annual Social and Economic Supplement (CPS ASEC)
Medical Expenditure Panel Survey (MEPS)
MEPS is a two-component survey sponsored by the U.S. Department of Health and Human Services' Agency for Healthcare Research and Quality. The MEPS-Insurance Component (IC) is a survey of employers that provide data on employer-based health insurance. The MEPS-Household Component (HC) is a panel household survey that is supplemented with data from the respondents' medical providers.
Released
July 2023
• 2022 MEPS-IC Private Sector Tables - National Estimates
• 2022 MEPS-IC Private Sector Tables - State Estimates
• 2022 MEPS-IC Private Sector Tables -Metro Estimates
National Health Interview Survey (NHIS)
A continuous cross-sectional household interview survey conducted by the National Center for Health Statistics (NCHS) which is part of the Centers for Disease Control and Prevention (CDC). It provides information on the health of the U.S. population and includes questions about health insurance coverage, health care utilization and access, and health conditions and behaviors, in addition to demographic and socioeconomic characteristics.
Estimates for sub-annual time periods are released through the NHIS Early Release Program in September, November/December, and February/March each year.
Released
December 2023
• Key Health Indicators: Interactive Estimates from the January 2019 - June 2023 NHIS
June 2023
• 2022 NHIS Public Use Files
Behavioral Risk Factor Surveillance System (BRFSS)
A state-based survey sponsored by the Centers for Disease Control and Prevention that focuses on population health, risk factors, and health behaviors for the adult population.
Released
August 2023
• 2022 Annual Survey Data
Household Pulse Survey
A near-real-time experimental survey from the U.S. Census Bureau. Typically released on a monthly basis.
Note: Based on previous data release calendars.
Page last updated January 2024
Blog & News

Now Available on State Health Compare: One Brand New Measure and Five Updated Measures
May 26, 2023:Estimates for five measures of health care access, affordability, and use have now been updated on SHADAC’s State Health Compare. One new measure, Had Telehealth Visit, has also been added to State Health Compare. The new and updated measures are all produced using data from the National Health Interview Survey (NHIS), conducted by the National Center for Health Statistics (NCHS). SHADAC produces these state-level measures using restricted-access data through the Minnesota Research Data Center (MnRDC). SHADAC’s State Health Compare is the only source of state-specific data for these measures which are essential for monitoring individuals’ access to and use of medical care, along with their ability to afford care.
These measures now contain data through 2021, using two-year pooled periods (i.e., 2019-2020, 2020-2021). The measures can be broken down by Total, Age, and Coverage Type (Public, Private, Uninsured).
Updated and new measures include:

 NEW: Had Telehealth Visit
This measure describes the percent of individuals who had a medical appointment by video or phone during the past twelve months.

 Had Usual Source of Medical Care
This measure captures rates of individuals who had a usual place of medical care other than an emergency department during the past twelve months.
 Had General Doctor or Provider Visit
This measure provides rates of individuals who had any visit to a general doctor or provider within the last year.
 Had Emergency Department Visit
This measure looks at rates of individuals who had any type of visit to an emergency department in the past twelve months.
 Trouble Paying Medical Bills
This measure examines rates of individuals who had trouble paying off medical bills during past twelve months.
 Made Changes to Medical Drugs
This measure highlights rates of individuals who were prescribed medication in the past twelve months who made changes to their medical drugs due to cost during the past twelve months. This includes delaying filling a prescription, taking less medicine, or skipping doses to save money.
Click here to explore these measures on State Health Compare!
Notes: Data for State Health Compare’s Had Dental Visit measure is only asked in the NHIS rotating core and thus was not asked in the 2021 survey. We will be able to update that measure with new data after both the 2022 and 2023 data are out in mid-2024.
All measures are representative of the civilian noninstitutionalized population.
Data Source: The estimates were produced using restricted NHIS data in the MnRDC. Measures have been updated with data through 2021 using two-year pooled periods, including (a) 2011–2012 through 2017–2018 and (b) 2019-2020 through 2020-2021, except in the case of the telehealth measure for which data is only available from 2020-2021.
Blog & News

Monitoring Broadband Expansion and Disparities using Data from State Health Compare
April 13, 2023:Introduction
The onset of the COVID-19 pandemic underscored the importance of telehealth services to people across the U.S. and the crucial role of broadband internet access in providing those services. Telehealth continues to be a popular and often necessary way for patients to access care, and federal and state governments are now making significant investments to expand and ensure affordable access to broadband internet.1
For these reasons, it is important to monitor changes in the share of the population with broadband internet as an indicator of access to care. SHADAC analysis of 2021 American Community Survey (ACS) data indicates households’ access to broadband internet has increased by 3.8 percentage points (PP) since 2019, rising to 90.1% (from 86.3%).
State Broadband Efforts
The percentage of households with broadband access varies across the states, ranging from a low of 81.8% in Mississippi to a high of 93.4% in Washington. Though every state experienced some increase in household broadband access, a few states showed larger expansions in access.

Out of all states, Arkansas saw the largest increase at 5.4PP, rising to 85.7% from 80.3%. Former Arkansas Governor Asa Hutchinson and the Arkansas General Assembly had made broadband a “top priority,” working to expand the state Broadband Office by increasing staffing and enhancing services.2, 3 The state also developed the Arkansas Rural Connect (ARC) grant program to expand broadband access in rural communities, and they recently announced a first-in-the-nation partnership with national non-profit EducationSuperHighway to develop best practices and programs to address broadband affordability.4
 Rates of broadband access increased by similar amounts in South Carolina, rising to 87.8% from 82.4%. South Carolina has engaged in significant broadband expansion initiatives over the past few years, approving nearly $30 million in broadband expansion projects in early 2021 and spending nearly $50 million in CARES Act funding on broadband-related projects in 2020.5
Despite gains in access, disparities by income level remain
Despite overall growth in broadband internet access, there are still sizable disparities in access between households of different income levels.
For example, though 91.1% of Minnesota households have broadband access (higher than the national average), only 73.1% of low-income households in Minnesota (under $25,000 per year) have broadband internet (below the national average of 74.7%).
In general, households with an income under $25,000 per year have the lowest percentage of broadband access, and households with an income over $50,000 per year have the highest percentage, though that difference varies by state. South Dakota shows the largest gap at 26.2PP: only 67.8% of low-income households have broadband access, compared to 94% of high-income households. Mississippi has a sizable disparity between income levels as well, with a 25.4PP difference between high- and low-income households.
Delaware and Oregon see the smallest disparities between income levels, showing a gap of only 15.8PP and 15.9PP between high- and low-income households, respectively. Those two states have some of the highest percentages of broadband access for low-income households as well, with 79.7% of low-income households in Delaware reporting broadband access and 79.5% in Oregon.
Considering these disparities, some states are taking steps to address broadband affordability;

![]() The 2022 Virginia Telecommunication Initiative guidelines include grant scoring criteria that encourage applicants to be aligned with the state’s efforts to bring low-income households affordable access to broadband internet.6
The 2022 Virginia Telecommunication Initiative guidelines include grant scoring criteria that encourage applicants to be aligned with the state’s efforts to bring low-income households affordable access to broadband internet.6
 The Minnesota Office of Broadband Development recently began the process of establishing a statewide digital equity plan which would focus on addressing internet service affordability and reducing gaps in device access, and digital skills.7
 In 2021, California passed a historic law directing $6 billion toward improving broadband access and affordability, with multiple provisions intended to improve internet speed, increase access, and lower internet costs for consumers.8, 9
Conclusion
On both national and state levels, access to broadband internet improved from 2019 to 2021. States have begun several promising broadband expansion initiatives and are using available federal and state grant funding to bolster broadband infrastructure and affordability. However, as states continue working toward greater broadband access and navigating an influx of funding for expansion projects, it is necessary to ensure those improvements are specifically targeted to address existing disparities in access.
|
The U.S. Census Bureau recently launched a data dashboard exploring the impact of federal broadband initiatives on local economies, including different access measures and displays for data on local employment statistics, wages and income, home values, and more. This is a helpful tool for visualizing the local effects of broadband infrastructure investment; explore it here. |
About the Data
The data cited here can be accessed through SHADAC’s online data tool, State Health Compare, using the measure “Percent of households with a broadband internet subscription” for the years 2019-2021. The estimates come from SHADAC’s analysis of the American Community Survey (ACS) Public Use Microdata Sample (PUMS). All differences described are statistically significant at the 95% confidence level unless otherwise specified.
1 Broadband Expansion Initiatives—The Council of State Governments. (2022, May 11). The Council of State Governments. https://www.csg.org/2022/05/11/broadband-expansion-initiatives/
2 AR Rural Connect. (n.d.). Arkansas Department of Commerce – Broadband Office. https://broadband.arkansas.gov/ar-rural-connect/
3 Connecting Arkansas: A Path to Economic Prosperity. (2021). Arkansas Department of Commerce. https://www.arkleg.state.ar.us/Calendars/Attachment?committee=410&agenda=4735&file=Exhibit+C+-Arkansas+Broadband+Plan.pdf
4 Governor Hutchinson Announces First State Partnership with EducationSuperHighway to Close Broadband Affordability Gap. (2022, November 30). https://www.arkansasedc.com/news-events/newsroom/detail/2022/11/30/governor-hutchinson-announces-first-state-partnership-with-educationsuperhighway-to-close-broadband-affordability-gap
5 Broadband and the Coronavirus Aid, Relief, and Economic Security or “CARES Act.” (2021). South Carolina Office of Regulatory Staff. https://ors.sc.gov/sites/ors/files/Documents/Broadband/Broadband%20CARES%20Act%20Update_1.04.2021.pdf
6 2022 Virginia Telecommunication Initiative (VATI) Program Guidelines and Criteria. (2022). Virginia Department of Housing and Community Development (DHCD). https://dhcd.virginia.gov/sites/default/files/Docx/vati/2022-vati-guidelines-and-criteria.pdf
7 Digital Inclusion. (n.d.). Minnesota Department of Employment and Economic Development. Retrieved March 2, 2023, from https://mn.gov/deed/programs-services/broadband/adoption/
8 Broadband Implementation for California. (2021). https://www.cpuc.ca.gov/industries-and-topics/internet-and-phone/broadband-implementation-for-california
9 SB 156 Fact Sheet: Meeting the Digital Divide. (2021). California Telehealth Policy Coalition. https://www.cchpca.org/2022/01/SB156_factsheet_0921_r3_091621-4.pdf
Blog & News

Examining Discrimination and Health Care Access by Sexual Orientation in Minnesota
March 22, 2023:Authors: Natalie Mac Arthur, Jeremy Duval, Kathleen Call
|
More than one-third of lesbian/gay adults in Minnesota reported experiencing discrimination from health care providers based on their sexual orientation and gender identity. |
Survey Question OverviewIn this analysis, we examined the experiences of adults in Minnesota by sexual orientation using data from the biennial 2021 Minnesota Health Access Survey (MNHA). The MNHA asked respondents how often their gender, sexual orientation, gender identity, or gender expression cause health care providers to treat them unfairly. In addition to this measure of SOGI-based discrimination, this survey includes information on access to health care such as forgone care due to costs. |
Introduction
Discrimination based on sexual orientation and gender identity (SOGI) from health care providers is a barrier to creating an equitable health care system. Nearly one in five lesbian, gay, bisexual, transgender, and queer (LBGTQ) adults reports avoiding health care due to anticipated discrimination (Casey et al., 2019). Compared with straight adults, lesbian/gay and bisexual adults are more likely to forgo or delay health care (Jackson et al., 2016, Nguyen et al., 2018). However, less is known about the association between reports of SOGI-based discrimination from health care providers and health care access.
We included three sexual orientation categories in this study: straight, lesbian/gay, and bisexual/pansexual. Survey respondents also had the option to select “none of these” and write in their own response. Due to sample size limitations, we excluded observations with responses that we could not recode to the existing categories. We tabulated SOGI-based discrimination and four measures of health care access by sexual orientation for adults in Minnesota. We also examined differences in health care access for respondents who did and did not report discrimination.
Results
Reports of discrimination from health care providers based on SOGI were significantly higher among lesbian/gay (36.1%) and bisexual/pansexual (26.1%) populations compared with the state average of 6% (Figure 1). Sexual minorities were also more likely to report barriers to health care access when compared with all adults in Minnesota (Figure 2). Low confidence in getting needed health care was significantly above the state average (11.8%) for people who identify as bisexual/pansexual (30.6%). Statewide, over a quarter of adults reported forgone care due to costs (26.2%), which included routine medical care, prescription drugs, dental care, specialists, and mental health care. Rates of forgone care were significantly higher for people who identify as lesbian/gay (45.5%) or bisexual/pansexual (41.9%).
Figure 1. Unfair treatment from health care providers based on gender or sexual orientation in Minnesota
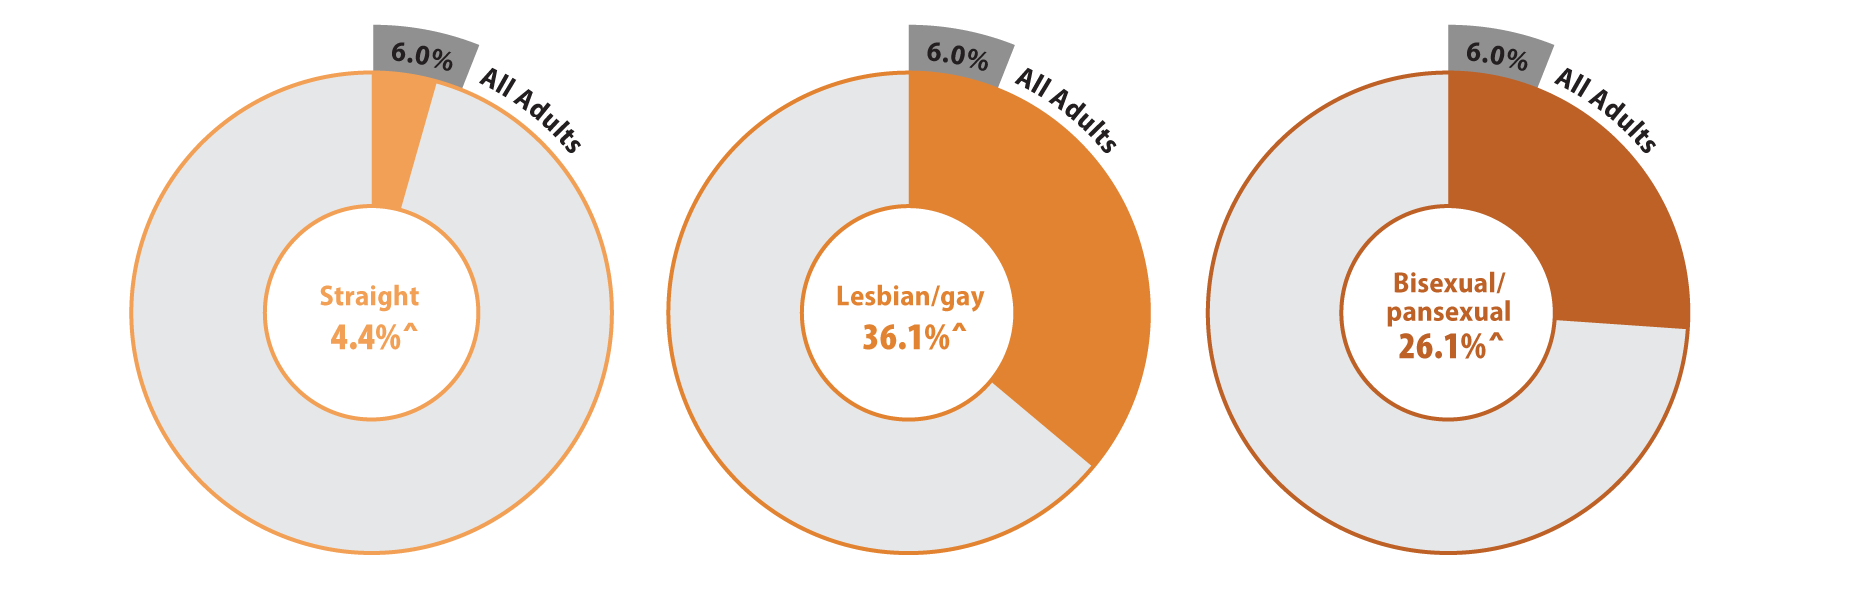
^ Rate significantly different from All Adults at the 95% confidence level.
Source: SHADAC analysis of the 2021 Minnesota Health Access Survey.
Figure 2. Health care access and barriers to care
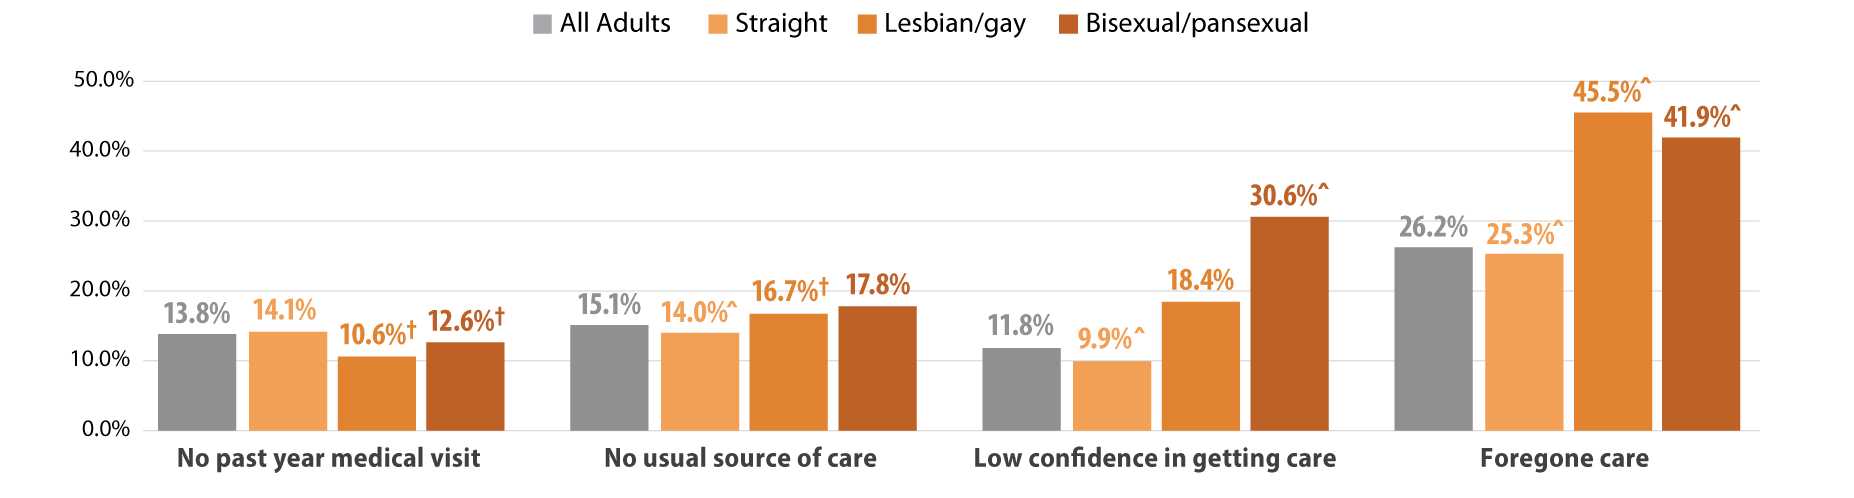
^ Rate significantly different from All Adults at the 95% confidence level.
† Estimate may be unreliable due to limited data (relative standard error greater than or equal to 30%).
Source: SHADAC analysis of the 2021 Minnesota Health Access Survey.
We found that Minnesotans who experienced SOGI-based discrimination were more likely to have low confidence in getting care and forgone care compared to those who did not experience discrimination (Figure 3). People who experienced discrimination had elevated barriers across all population groups including people identifying as straight, lesbian/gay, or bisexual/pansexual. However, low confidence in care was highest among bisexual/pansexual adults who reported SOGI-based discrimination (39.4%). Half of all adults with SOGI-based discrimination reported forgone care due to costs, while about two-thirds of bisexual/pansexual (69.0%) and lesbian/gay (66.1%) adults who reported SOGI-based discrimination had forgone care.
Figure 3. Experiences of gender-based discrimination associated with barriers to health care access
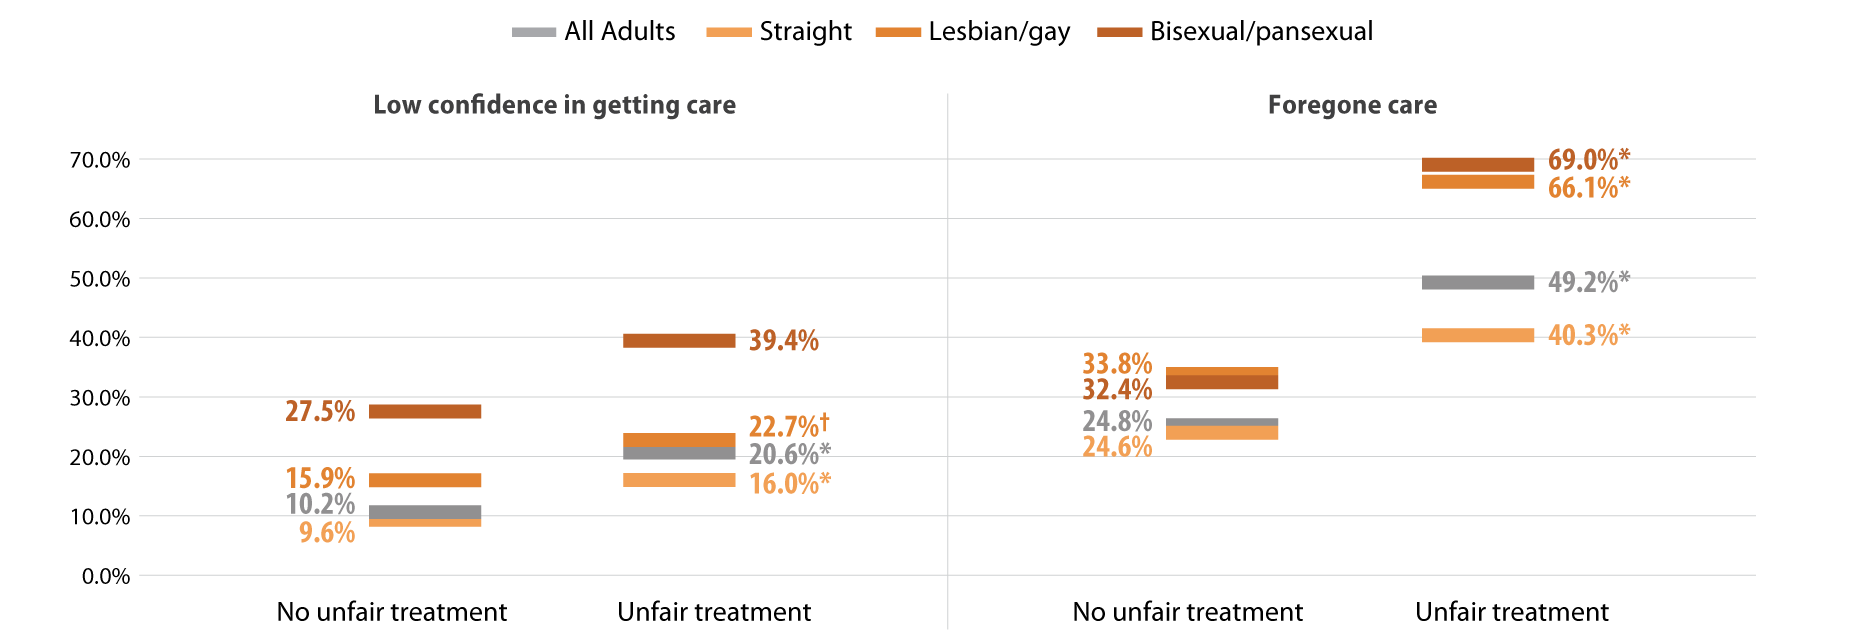
* Significant difference within a given subpopulation between rates of people who experienced unfair treatment and those who did not.
† Estimate may be unreliable due to limited data (relative standard error greater than or equal to 30%).
Source: SHADAC analysis of the 2021 Minnesota Health Access Survey.
Discussion
MethodsData are from the 2021 Minnesota Health Access (MNHA) survey, which is a biennial population-based survey on health insurance coverage and access conducted in collaboration with the Minnesota Department of Health. We limited the analysis to adults responding for themselves about experiences of discrimination and access (n=10,003); we excluded proxy reports (e.g., a household member answering for a spouse or roommate). Tests for statistical significance were conducted at the 95% confidence level. |
Within the health care setting, discrimination based on SOGI was prevalent among lesbian/gay and bisexual/pansexual adults. SOGI-based discrimination from health care providers was reported by over a third of lesbian/gay adults in Minnesota and over a quarter of bisexual/pansexual adults. Barriers to health care access, including low confidence in getting care and forgone care, were also high among lesbian/gay and bisexual/pansexual adults compared with the average rates seen among adults in Minnesota. Further, reports of SOGI-based discrimination correlated with even higher rates of barriers to access among lesbian/gay and bisexual/pansexual adults; a majority of these populations who reported discrimination also had forgone health care due to costs.
Discrimination by health care providers has substantial clinical implications. Across populations, discrimination negatively affects mental and physical health (Pascoe and Richman, 2009). Compared with straight adults, lesbian/gay and bisexual adults experience health disparities including mental and physical health, activity limitations, and chronic conditions (Gonzales and Henning-Smith, 2017). For LBGTQ adults, both discrimination and barriers to health care are associated with worse mental health, behavioral health, and health-related quality of life (Lee 2016 et al., Jung et al., 2023). One recent study suggests that delayed health care partially mediates the connection between discrimination and worse health status among LBGTQ women (Scott et al., 2022). Our work contributes evidence linking provider discrimination to forgone health care and lack of confidence in getting care.
The clinical impact of discrimination is likely to vary across the life course and across the spectrum of intersectional identities including LBGTQ and race/ethnicity. Compared with lesbians, bisexual women are more likely to report poor physical and mental health and disabilities; both groups of women face higher risks than straight women (Fredriksen-Goldsen 2023). Gay Black and Hispanic men face greater barriers to health care access than gay white men (Hsieh et al., 2017). Among older adults, one survey found that nearly four out of five LBGTQ people anticipate encountering discrimination in long-term care services (Dickson et al., 2022).
Differences in health care access and socioeconomic resources may exacerbate the influence of provider discrimination on health outcomes. Although studies have found that delays in health care among lesbian/gay and bisexual adults persist even with insurance coverage, their coverage may not provide comparable affordability of health care relative to straight adults (Jackson et al., 2016, Nguyen et al., 2018,Tabaac et al., 2020). Lesbian/gay and bisexual adults are less likely to have private coverage and more likely to have purchased a plan from the individual market, which may have higher premiums and deductibles. Furthermore, they are also more likely to experience lapses in coverage. These studies indicate that both cost concerns and previous bad health care experiences contribute to delays in care. Our results add to the growing body of literature documenting high rates of forgone care due to cost for lesbian/gay and bisexual/pansexual adults. Additionally, we document lack of confidence in getting health care among these populations and greater barriers to access among those who reported SOGI-based discrimination from a health care provider.
Conclusion
Reports of discrimination among lesbian/gay and bisexual/pansexual Minnesotans are troubling and require a response. The Affordable Care Act, which expanded Medicaid in willing states, also expanded non-discrimination protections based on sexual orientation and gender identity (KFF, 2014). However, these protections are limited in promoting health care access. Relative to other states, Minnesota offers a robust Medicaid program. Barriers to access may be even higher for LBGTQ people in states that did not expand Medicaid and states with fewer protective non-discrimination laws. Socioeconomic policies at the federal and state level are important for addressing gaps in health equity for many members of the LBGTQ community.
Greater availability of data including SOGI measures would strengthen efforts to better understand and address the health care needs of LBGTQ populations (SHADAC, 2021). Direct measures of discrimination are also important to monitor progress in providing equitable access to health care services (Lett et al., 2022). Ongoing research is needed to improve health equity and address barriers to health care for LBGTQ populations.
Check out our companion blog "Examining Gender-Based Discrimination in Health Care Access by Gender Identity in Minnesota".
References
Casey, L. S., Reisner, S. L., Findling, M. G., Blendon, R. J., Benson, J. M., Sayde, J. M., & Miller, C. (2019). Discrimination in the United States: Experiences of lesbian, gay, bisexual, transgender, and queer Americans. Health services research, 54 Suppl 2(Suppl 2), 1454–1466. https://doi.org/10.1111/1475-6773.13229
Dickson, L., Bunting, S., Nanna, A., Taylor, M., Spencer, M., & Hein, L. (2022). Older Lesbian, Gay, Bisexual, Transgender, and Queer Adults’ experiences with discrimination and impacts on expectations for long-term care: Results of a survey in the southern United States. Journal of Applied Gerontology, 41(3), 650-660.
Fredriksen-Goldsen, K. I., Romanelli, M., Jung, H. H., & Kim, H. J. (2022). Health, economic, and social disparities among Lesbian, Gay, Bisexual, and Sexually Diverse Adults: Results from a population-based study. Behavioral Medicine, 1-12.
Gonzales, G., & Henning-Smith, C. (2017). Health disparities by sexual orientation: results and implications from the Behavioral Risk Factor Surveillance System. Journal of Community Health, 42, 1163-1172.
Jackson, C. L., Agénor, M., Johnson, D. A., Austin, S. B., & Kawachi, I. (2016). Sexual orientation identity disparities in health behaviors, outcomes, and services use among men and women in the United States: A cross-sectional study. BMC Public Health, 16(1), 807. https://doi.org/10.1186/s12889-016-3467-1
Kates, J., & Ranji, U. (2014, February 21). Health Care Access and Coverage for the Lesbian, Gay, Bisexual, and Transgender (LGBT) Community in the United States: Opportunities and Challenges in a New Era. KFF. https://www.kff.org/racial-equity-and-health-policy/perspective/health-care-access-and-coverage-for-the-lesbian-gay-bisexual-and-transgender-lgbt-community-in-the-united-states-opportunities-and-challenges-in-a-new-era/
Lett E., Asabor E., Beltrán S., Cannon A.M., Arah O.A. (2022). Conceptualizing, Contextualizing, and Operationalizing Race in Quantitative Health Sciences Research. Ann Fam Med 20(2):157-163. https://doi.org/10.1370/afm.2792
Nguyen, K. H., Trivedi, A. N., & Shireman, T. I. (2018). Lesbian, gay, and bisexual adults report continued problems affording care despite coverage gains. Health Affairs, 37(8), 1306-1312.
Pascoe, E. A., & Smart Richman, L. (2009). Perceived discrimination and health: a meta-analytic review. Psychological bulletin, 135(4), 531.
Scott, S. B., Knopp, K., Yang, J. P., Do, Q. A., & Gaska, K. A. (2022). Sexual minority women, health care discrimination, and poor health outcomes: A mediation model through delayed care. LGBT Health. http://doi.org/10.1089/lgbt.2021.0414
SHADAC. (2021, October). A New Brief Examines the Collection of Sexual Orientation and Gender Identity (SOGI) Data at the Federal Level and in Medicaid. https://www.shadac.org/news/new-brief-examines-collection-sexual-orientation-and-gender-identity-sogi-data-federal-level
Tabaac, A. R., Solazzo, A. L., Gordon, A. R., Austin, S. B., Guss, C., & Charlton, B. M. (2020). Sexual orientation-related disparities in health care access in three cohorts of US adults. Preventive Medicine, 132, 105999.

