
Blog & News


State Health Compare: State-Level Data Resources on Measures of Health Equity (Part Two - Health Behaviors, Health Outcomes, Social and Economic Factors)
February 10, 2022:Health equity and social determinants of health (SDOH) are rapidly growing fields of public health research. SHADAC researchers believe that making strides toward achieving health equity depends equally on better understanding health disparities as well as on making concerted, measurable efforts toward reducing avoidable differences in populations’ health outcomes.
This blog, the second in a two-part series, provides a high-level overview of a range of state-level measures currently housed on SHADAC’s online data tool, State Health Compare, which may help states understand and track trends across indicators of health equity, such as health behaviors, health outcomes, and social and economic factors.
Health Behaviors
Achieving health equity across the nation means ensuring equal opportunities for individuals to live healthy lives, and part of this goal includes addressing disparities in social determinants of health such as drinking or smoking, as well as guaranteeing access to care and treatment for these behaviors.
Adult Smoking (2005-2010, 2011-2020)*
This measure shows the percent of adults who reported smoking, defined as adults who have smoked 100 or more cigarettes in their lifetime and who currently smoke some days or every day. The measure is broken down by race/ethnicity and educational attainment. Related Resource: SHADAC researchers used data from the Behavioral Risk Factor Surveillance System (BRFSS) to produce analyses focused on several different health behaviors, including Adult Smoking and E-cigarette Use in the United States. This blog, part of a spotlight series including binge drinking and obesity, looks at national and state-level rates at which adults with different racial/ethnic backgrounds smoke and vape in 2018 and 2017.
Adult E-Cigarette Use (2016-2020)
This measure shows the percent of adults who reported currently using e-cigarettes some days or every day. The measure is broken down by age, race/ethnicity and educational attainment. Related Resource: SHADAC researchers used data from the Behavioral Risk Factor Surveillance System (BRFSS) to produce analyses focused on several different health behaviors, including Adult Smoking and E-cigarette Use in the United States. This blog, part of a spotlight series including binge drinking and obesity, looks at national and state-level rates at which adults with different racial/ethnic backgrounds smoke and vape in 2018 and 2017.
Adult Binge Drinking (2005-2010, 2011-2020)*
This measure shows the percent of adults who reported binge drinking, defined as having on one occasion, four or more drinks for women or five or more drinks for men. The measure is broken down by race/ethnicity and educational attainment. Related Resource: SHADAC researchers used data from the Behavioral Risk Factor Surveillance System (BRFSS) to produce analyses focused on several different health behaviors, including Adult Smoking and E-cigarette Use in the United States. This blog, part of a spotlight series including smoking/e-cigarette use and obesity, looks at national and state-level rates at which adults with different racial/ethnic backgrounds smoke and vape in 2018 and 2017.
Health Outcomes
Closing the persistent gaps in health outcomes (e.g., higher rates of preventable conditions, disease prevalence, or premature death) between certain populations or geographic regions is an important step toward health equity.
Health Status (2005-2017, 2017-2020)*
Specifically, this measure on State Health Compare shows the percent of the adult population who report being in either poor or fair health. Estimate breakdowns are available by education level and race and ethnicity.
Adult Unhealthy Days (2011-2020)
Data users can examine this measure in a variety of ways. Overall, the measure captures the average composite number of days in the past 30 days that an adult’s mental or physical health was not good. Users can also individually examine the average number of mentally and physically unhealthy days in the past 30 days. Additionally, for each variation of this measure, users can make comparisons by age, health insurance coverage type, disability status, educational attainment, household income categories, and race and ethnicity are all available. Related Resource: Combining several years of data (2018-2020) from the Behavioral Risk Factor Surveillance System (BRFSS), SHADAC researchers produced one-page infographics that show how all 50 states and D.C. compare to the U.S. average in measures of people’s self-reported physical and mental health, and how people’s physical and mental health varies depending on their race and ethnicity, level of income, and age within each state.
Activities Limited due to Health Difficulty (2005-2010, 2011-2020)*
Similar to the “Adult Unhealthy Days” measure, estimates for “Activities Limited due to Health Difficulty” show the average number of days in the previous 30 days when a person indicates their activities are limited due to mental or physical health difficulties.
Chronic Disease Prevalence (2005-2010, 2011-2018)*
This measure captures the percent of adults who reported having one or more common chronic conditions such as diabetes, cardiovascular disease, heart attack, stroke, or asthma. Comparisons across rates can be made by race/ethnicity and educational attainment.
Cancer Incidence (2000-2018)
Estimates for this measure provide an age-adjusted rate per 100,000 people of breast, cervical, lung and colorectal cancer occurrence, and can be viewed by race/ethnicity subcategories.
Premature Death (2000-2019)
This measure provides a composite estimate of the average number of years lost due to premature death (deaths that occur before the average age of death within a given population) prior to age 75. Estimates are available by race/ethnicity breakdowns.
Suicide Deaths (1999-2020)
Estimates for this measure provide the age-adjusted rate of suicide deaths per 100,000 people. The data are available to view by age, race/ethnicity, sex, method, and metropolitan status subcategories. Related Resource: For the past several years, SHADAC researchers have produced an annual report looking at the alarming trend of rising suicide deaths in the U.S. Particularly concerning is the accelerated rate at which suicide deaths have increased across the nation in recent years, as well as the steep increase in deaths for children age 10-14. SHADAC also held a webinar discussing this growing public health issue, highlighting concerning trends and variations in suicide deaths by a variety of breakdowns.
Social and Economic Factors
A number of factors, from social to structural and economic to educational, can significantly impact goals of health equity, as well as present serious roadblocks in achieving more equitable and ideal health outcomes.
Children Considered to be Poor (2008-2019)
This measure details the percent of children considered to be poor, as defined by falling below 100% of the Federal Poverty Guidelines (FPG) set to measure the minimum amount of total income that a family needs for food, clothing, transportation, shelter and other necessities. This measure can be broken down by race/ethnicity.
Unemployment Rate (2000-2020)
Estimates for this measure represent the percent of the civilian labor force (age 16 and older) that was unemployed in the past year. A person is considered “unemployed” if they do not have a job, have actively looked for work in the prior 4 weeks, and/or are currently available for work. Breakdowns for this measure are available by race/ethnicity. Related Resource: SHADAC researchers recently produced a new analysis examining unemployment by racial/ethnic breakdowns—an important lens for analyzing unemployment as a social determinant of health, with unemployment often varying widely across racial/ethnic categories.
Unaffordable Rents (2012-2019)
The Unaffordable Rents measure is a state- and national-level indicator of housing affordability that measures the percent of rental households that spent more than 30 percent of their household’s monthly income on rent. This measure is available to be broken down by a significant number of categories, including disability status, household income, Medicaid enrollment, metropolitan status, and race (white/non-white). Related Resource: An analysis by SHADAC looked at the percent of cost-burdened rental households in each state in 2017, examining unaffordable rents overall while also analyzing unaffordable rents among rental households. SHADAC researchers also created state infographics for the five states with the highest percentages of unaffordable rents among rental households that had a Medicaid enrollee.
Adverse Childhood Experiences (2016-2020)
A more recent measure on State Health Compare, adverse childhood experiences, or ACEs, provides an estimation of the percent of children who experience events between the ages of 0-17 that have the potential to leave lasting traumatic impressions, such as violence, abuse, or neglect; witnessing violence in the home or community; or having a family member attempt or die by suicide. ACEs also include experiencing pervasive conditions that undermine a child’s sense of safety and stability, such as growing up in a household with substance misuse, mental health problems, and instability due to parental separation or household members being in jail or prison. Users can make comparisons in rates by subcategories of age, health insurance coverage type, education levels, poverty levels, and race/ethnicity.
Notes
For a full overview of all available state-level measures, please visit the “Explore Data” page on State Health Compare, or take a look at our one-page guide to State Health Compare measures and their data sources.
All measures marked with an “*”: This indicates a break in series due to survey changes in either data processing or implementation methodology.
Blog & News
State Health Compare: State-Level Data Resources on Measures of Health Equity (Part One - Coverage, Affordability and Cost of Care, Access to Care, and Quality of Care)
December 22, 2021:Health equity and social determinants of health (SDOH) are rapidly growing fields of public health research. SHADAC researchers believe that making strides toward achieving health equity depends equally on better understanding health disparities as well as on making concerted, measurable efforts toward reducing avoidable differences in populations’ health outcomes.
This blog, the first in a two-part series, provides a high-level overview of a range of state-level measures currently housed on SHADAC’s online data tool, State Health Compare, which may help states understand and track trends across indicators of health equity, such as health insurance coverage, health care access and affordability, and quality of care.
Insurance Coverage
One of the essential steps towards achieving health equity is providing comprehensive and affordable health insurance coverage in order to provide reasonable and increased access to health care services. State Health Compare provides annually updated state-level measures of health insurance coverage across a number of populations, including populations that have been historically marginalized.
Coverage Type (2020 only)*
This measure shows the rates of different types of health insurance coverage (Medicare, employer-sponsored insurance [ESI], Medicaid, individual, as well uninsurance) for 2020 only. Users can view this single-year measure by a limited set of breakdowns such as age, health status, and poverty level. Related Resource: In light of the data quality challenges noted for the 2020 American Community Survey (ACS), SHADAC instead analyzed estimates of national-level health insurance coverage for 2020 using the Current Population Survey (CPS). A recent blog looks at U.S. trends in rates of the uninsured, public and private coverage changes, and breakdowns by age, income level, race/ethnicity, and state Medicaid expansion status.
Coverage Type (2008-2019)
This measure shows the rates of different types of health insurance coverage, including Medicare, employer-sponsored insurance (ESI), Medicaid, and individual coverage, as well as no insurance coverage. Users can view this measure by a variety of breakdowns, including: age, citizenship, disability status, education, family income, health status, limited English proficiency, marital status, poverty level, race/ethnicity, sex, and work status. Related Resource: As part of our fall data release coverage, SHADAC produces an annual three-part blog series looking at health insurance coverage data from the American Community Survey (ACS). The first blog looks at state-level information about health insurance coverage by type, including uninsurance and private and public coverage for 2019.
Health Care Affordability
While having health insurance coverage is a critical step in eliminating health disparities, achieving equity also requires that everyone has sufficient resources to afford and access needed care or are adequately protected from health care costs by adequate and comprehensive health insurance coverage.
People with High Medical Care Cost Burden (2010-2012, 2013-2017, 2017-2020)*
This measure highlights the percent of individuals in families where out-of-pocket health care spending, including premiums, has exceeded 10 percent of annual income. Breakdowns by employer coverage, income, and race/ethnicity are available for each state.
Adults Who Forgo Needed Medical Care (2005-2010, 2011-2020)*
Data for this measure indicates the percent of adults in each state who could not get needed medical care due to cost. Breakdowns by education level and race/ethnicity are available for all states. Related Resource: SHADAC recently updated a blog focusing on racial/education inequities in access and ability to afford medical care, using the latest estimates (2019) for this measure along with estimates for Adults with No Personal Doctor. The original blog, Affordability and Access to Care in 2018: Examining Racial and Educational Inequities across the United States (Infographic), looked at the effects of rising health costs on delaying or skipping needed care.
Access to Health Care
Much like the ability to afford health care, individuals’ ability to access care has a number of associations with overall physical, social, and mental health status of populations. Individuals with no or weak connections to the health care system are less likely to get timely and adequate health care when needed.
Adults with No Personal Doctor (2005-2010, 2011-2020)*
This measure shows the percent of adults without a personal doctor and offers breakdowns by education level and race/ethnicity. Related Resource: SHADAC recently updated a blog focusing on racial/education inequities in access and ability to afford medical care, using the latest estimates (2019) for this measure along with estimates for Adults Who Forgo Needed Medical Care. The original blog, Affordability and Access to Care in 2018: Examining Racial and Educational Inequities across the United States (Infographic), looked at the effects of rising health costs on delaying or skipping needed care.
Broadband Internet Access (2016-2019)
Estimates for this measure show the percent of households that have a broadband internet subscription, which is an increasingly essential means of finding and accessing care and communicating with health care providers. Related Resource: SHADAC recently produced two new blogs aimed at measuring the impact of disparities in access to broadband internet across the states in light of coronavirus. The first blog looks at disparities in state-level broadband access by income, rurality, coverage, and disability status; the second examines the role broadband access plays in eliminating access barriers to healthcare services, such as enabling telehealth visits during the COVID pandemic.
Physicians Who Accept New Medicaid Patients (2014-2017)
State Health Compare’s newest measure, Physicians Who Accept New Medicaid Patients, provides a measure of the percent of physicians who reported accepting payments from Medicaid patients among the total number of physicians who accept new patients. Multiple years of data for this measure have been pooled together in order to provide reliable state-level estimates, and the measure can be broken down by the ratio of mid-level providers, setting, and share of Medicaid patients. Related Resource: In addition to producing the only state-level estimates available for this measure, SHADAC also published a factsheet for the Medicaid and CHIP Payment Access Commission (MACPAC) that analyzed physician acceptance of new Medicaid patients at the national and state levels, and found significant variations in rates of acceptance by state and by various patient, physician, and practice characteristics.
Quality of Care
Achieving health equity not only includes making strides toward increasing health insurance coverage and access to affordable health care but also ensuring that all populations receive high-quality care.
Adult Cancer Screenings (2005-2010, 2012-2020)
This measure shows the percentage of adults who have received the recommended cancer screenings, such as pap smears, colorectal cancer screenings, and mammograms, in the past year. Breakdowns for these estimates are available by education level and race/ethnicity categories.
Adult Flu Vaccinations (2017-2019)
One of the most recent additions to State Health Compare, this measure provides an estimate of the rate of adults (18+) who received a flu vaccine in the past twelve months, with breakdowns available by age, chronic disease status, coverage type, education, household income category, metropolitan status, personal doctor status, race/ethnicity, and sex. In order to provide reliable state-level estimates for smaller subpopulations, multiple years of data for this measure have been pooled together. Related Resource: Using this measure, SHADAC researchers produced a set of 50-state infographics showing State-level Flu Vaccination Rates among Key Population Subgroups as the best available proxy for predicting and understanding possible vaccination patterns for COVID-19. Each individual state infographic highlights vaccination rates for individual states compared with a number of demographic categories, including age, race/ethnicity, household income level, insurance status, chronic conditions, access to care, and educational attainment.
Notes
For a full overview of all available state-level measures, please visit the “Explore Data” page on State Health Compare, or take a look at our one-page guide to State Health Compare measures and their data sources.
All measures marked with an “*”: This indicates a break in series due to survey changes in either data processing or implementation methodology.
Blog & News

A New Brief Examines the Collection of Sexual Orientation and Gender Identity (SOGI) Data at the Federal Level and in Medicaid
October 2021:Thirteen million people identify as part of a sexual or gender minority (SGM) in the United States, with an estimated 1.17 million who have Medicaid as their primary source of health insurance coverage.[1],[2] While the COVID crisis shed a unique light on the need for more equitable health data collection across all populations, one area in which efforts are still falling short is sexual orientation and gender identity (SOGI) data – especially for those covered by Medicaid. However, change is happening, and states are leading the way.
A new State Health and Value Strategies brief, authored by SHADAC researchers, documents a few examples of SOGI data collection efforts occurring at the federal level and in Medicaid, and highlights the efforts of an Oregon community stakeholder process that identified several key areas for SOGI data improvement.
 SOGI Data at the Federal Level
Unfortunately, there is no current federal data standard for sexual orientation and gender identity. The data standard from the Department of Health and Human Services (HHS), released in 2011, defines the category of “sex” only as biological sex and makes no mention of gender or gender identity. Additionally, when SOGI data collection efforts have been made over the past decade, certain aspects have been more routinely measured than others. For instance, most of the research to-date has focused on how to collect sexual orientation, and very little continues to be known about the best way to collect gender identity. A review in 2016, for example, found that of the 12 federal surveys that collect various aspects of SOGI information, only half of those collect information on gender identity.
SOGI Data in Medicaid
The collection of SOGI data in Medicaid is even less common than in federal surveys. SHADAC’s review of state Medicaid applications identified only two states that provided applicants an opportunity to select something other than “male” or “female” when asked to indicate their sex/gender (these terms were used interchangeably to refer to biological sex). Connecticut’s paper application has an open-text write-in option for “gender.” Oregon asks applicants to indicate their “sex assigned at birth” as well as their “gender identity.”
Improving the Collection of SOGI Data – The Oregon Model
There are still many unresolved methodological and conceptual issues when it comes to the collection of SOGI information, and very limited research assessing the validity of SOGI data specifically collected via the Medicaid application process. But one state leading the way in this effort is Oregon.
In 2018, the Oregon Health Authority (OHA) Office of Equity and Inclusion convened a SOGI Data Collection Workgroup, composed of stakeholders who interact with the Lesbian, Gay, Bisexual, Transgender, Queer, and other (LGBTQ+) community and health systems, many of whom also identify as LGBTQ+ themselves, to develop a set of SOGI data standards. The group recommended a key set of five demographic questions and response options, some open-ended for the respondent to be able to write an answer and some with the ability to check more than one categorical box, if appropriate. Options were also given for the respondent to say that they either did not want to answer or did not know what the question was asking. The workgroup also identified that a set of additional questions were needed in order to ensure respectful communication.
Soon these standards will be put into practice. A bill requiring OHA and the Oregon Department of Human Services to expand their existing race, ethnicity, language and disability data collection standards to include SOGI was recently passed by the state legislature. The state plans to convene a rule-making advisory committee in the winter of 2022 to finalize SOGI standards using the work group’s draft standards as a starting point.
Looking Forward
There continues to be very limited research assessing the validity of SOGI data specifically collected via the Medicaid application process. Absent any type of federal standard, states looking to explore different options to address their SOGI data collection gaps may need to modify SOGI questions depending on a variety of factors including the age, cultural background, and language preferences of their target population; as well as be mindful of the evolving terminology used to identify gender identity. Oregon serves as an excellent model for how to undertake a thoughtful community stakeholder process that can inform efforts to establish new data collection on a topic that is fluid and rapidly changing, yet vitally important for the health of Medicaid populations.
[1] Conron, K.J. & Goldberg, S.K. (April 2020). LGBT people in the US not protected by state non-discrimination statutes. UCLA School of Law, The Williams Institute. https://williamsinstitute.law.ucla.edu/wp-content/uploads/LGBT-ND-Protections-Update-Apr-2020.pdf
[2] 3. Conron, K.J. & Goldberg, S.K. (January 2018). Over half a million LGBT adults face uncertainty about health insurance coverage due to HHS guidance on Medicaid requirements. UCLA School of Law, The Williams Institute. https://williamsinstitute.law.ucla.edu/wp-content/uploads/LGBT-Medicaid-Coverage-US-Jan-2018.pdf
Blog & News
Collecting Race, Ethnicity, and Language (REL) Data on Medicaid Applications: 50-State Review Shows Wide Variation in How States Gather this Information
May 25, 2021:
A new version of this SHVS brief was published in November 2022 to provide up-to-date information on Medicaid REL data collection among the states and extend the analysis to include the District of Columbia and the five territories.
 Medicaid is a vital source of health insurance coverage for low-income children, adults, and individuals with disabilities; however, many individuals in Medicaid experience significant health disparities. An essential first step in any effort to reduce health disparities and address health equity in Medicaid is to collect and monitor data on disparities by race, ethnicity, and language.
In this brief prepared for State Health and Value Strategies, SHADAC researchers Emily Zylla and Elizabeth Lukanen document how all 50 states are collecting information about race, ethnicity, and language (REL) on their Medicaid applications (both paper and online). Key findings from this analysis include:
Race/Ethnicity Question
|
Minimum Standards -Self-identification as the preferred means of obtaining information about an individual’s race and identity -Allowing respondents to select multiple responses (as opposed to a “multi-racial” category -Starting with two categories of ethnicity: Hispanic/Latino and not Hispanic or Latino -Providing a minimum of five race response options: American Indian or Alaska Native; Asian; Black or African American; Native Hawaiian/Other Pacific Islander; White |
- The majority of states’ applications (44 on paper and 27 online) have two separate questions to ascertain race and ethnicity, while the paper applications of six states (Arizona, Colorado, Massachusetts, New York, Oregon, and Washington) asked some version of a combined race/ethnicity question.
- When race and ethnicity were asked separately, the number of ethnicity categories presented on states’ paper applications ranged from two to eight in both paper and online applications. Half of all states (25) offered six ethnicity options on their paper applications: Mexican, Mexican-American, Chicano/a, Puerto Rican, Cuban, and Other. However, the majority of states’ online applications only offered two ethnicity options: Hispanic/Latino and Not Hispanic/Latino.
Race Response Options
- Most states collect race/ethnicity information with multiple detailed response options. The number of race categories (including subpopulation groupings) presented on states’ paper applications varied considerably, from 5 to 37 on paper applications and from 5 to 20 on online applications.
- States did not necessarily offer the same race categories online as they did on paper.
- Across all 50 states there were 62 variations of racial response options offered on paper and online applications.
- The majority of states offered some type of additional response option beyond the fixed response options such as “other,” “multiracial,” “unknown,” or “decline to answer.”
Language Preferences
- 44 states collect information on primary or preferred language on their paper applications, and all 33 of the states’ online forms reviewed collect this information.
- 18 states asked applicants to separately indicate both their preferred spoken and written language on their paper forms, and 13 states asked applicants to separately indicate both their preferred spoken and written language on their online forms.
- Most application forms or online screens start with a note (often in multiple languages) indicating that translation services are available and free of charge. Many states (37) also provided paper Medicaid applications in languages other than English, most commonly Spanish.
|
State Spotlight: Oregon |
Considerations for States
As states look to improve the completeness of their REL data in Medicaid and consider making changes to either their paper or online applications, the authors recommend that states:
- Keep in mind that individuals may be more likely to complete the race/ethnicity question if they recognize options that correspond to their racial and ethnic identities.
- To improve the granularity of data, a state currently using broad racial and ethnic categories may wish to consider further breaking out some of those categories to represent locally relevant populations.i
- Consider the characteristics of their unique population as well as the state’s analytic capacity.
Further Reading
Access the full brief for more information, including state-specific information on Medicaid REL data collection.
A forthcoming companion brief will provide similar information on the collection of information on sex, gender, and disability.
i Wilson, Geniene, Hasnain-Wynia, Romana, Hauser, Diane, Calman, Neil S. Implementing Institute of Medicine Recommendations on Collection of Patient Race, Ethnicity, and Language Data in a Community Health Center. Journal of health care for the poor and underserved. 2013; 24(2):875-884. doi:10.1353/hpu.2013.0071
Blog & News
Expert Perspective: States’ Reporting of COVID-19 Health Equity Data (State Health & Value Strategies Cross-Post)
September 14, 2020:The following content is cross-posted from State Health and Value Strategies. It was first published on April 22, 2020.
Authors: Emily Zylla, Lacey Hartman & Lindsey Theis - SHADAC
Throughout the coronavirus pandemic SHADAC has been tracking which states are regularly reporting data that could help shed light on the health equity issues of this crisis. Collecting disaggregated demographic data on the impact of COVID-19 is one way to advance health equity during response efforts. We have found that all states are reporting some data on the coronavirus (COVID-19) outbreak, but the type and granularity of information varies considerably across states. In this expert perspective we provide updated interactive maps that explore the current status of all 50 states and the District of Columbia’s reporting of COVID-19 case and death data breakdowns by age, gender, race, ethnicity, and health care workers; and provide an update on the status of states’ reporting of hospitalization and testing data by demographic categories. We also highlight examples of states that are undertaking new, or additional, COVID-19 related data collection, reporting, or research activities to understand health disparities across populations. Finally, we summarize new federal guidance related to COVID-19 data reporting.
Current Status of COVID-19 Health Equity Reporting
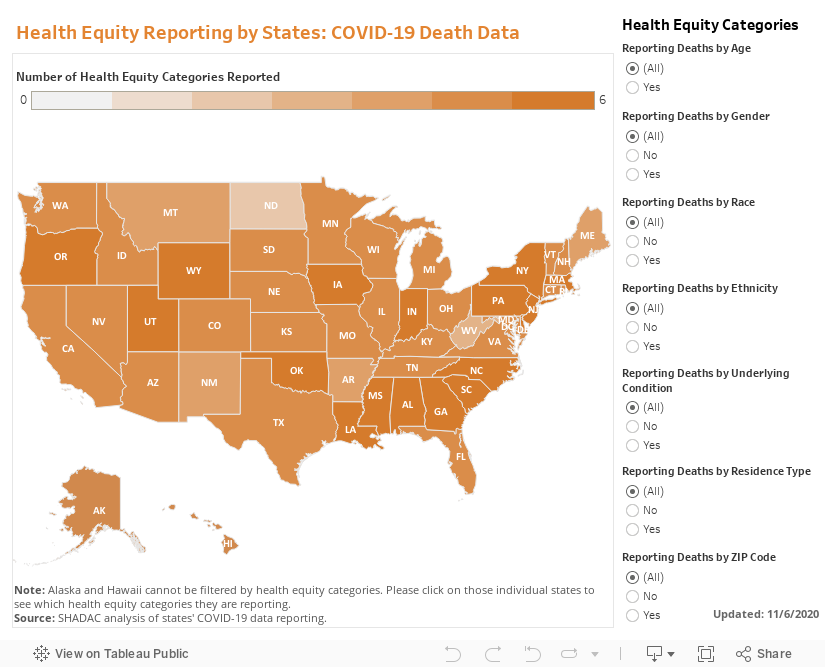
The number of states reporting disaggregated COVID-19 case and mortality data has increased significantly since the start of the pandemic. All states now report race or ethnicity data for either COVID-19 cases or mortalities, a marked improvement from back in April when just over half (27) of states were reporting COVID-19 cases by race, and only 22 states were reporting COVID-19 deaths by race. Additionally, at the beginning of the epidemic, only three states reported information about how the distribution of cases by race/ethnicity compared to the state’s underlying population distribution. To date, 38 states are reporting their data in this way, which is helpful for understanding the extent to which COVID-19 is disproportionately impacting certain populations.
At the start of the pandemic, 13 states were reporting COVID-19 cases by residence type, and only six states were reporting deaths by residence type. Today, all states report cases by residence type, and 47 states report deaths by residence type. Similarly, the number of states reporting the number of health care workers with positive COVID-19 cases has increased from 10 to 26, and the number of states reporting COVID-19 deaths by underlying conditions has increased from 4 to 17.
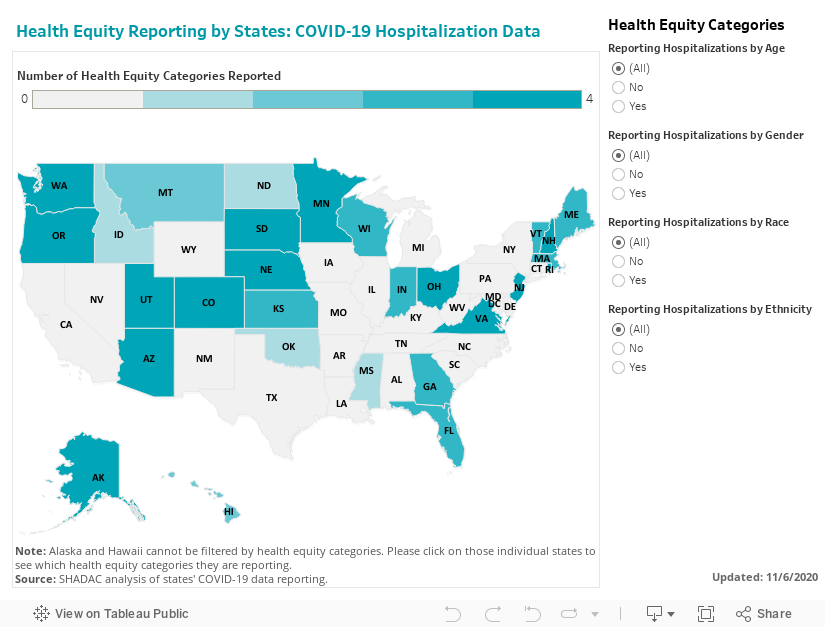
We expect that as states work to comply with the new federal reporting guidance (see below), the number of states reporting disaggregated case and testing data by various indicators will continue to increase. The number of states reporting disaggregated hospitalization and testing data, however, remains low, with just over half (26) of states reporting hospitalization data breakdowns and only eight states reporting some type of testing data breakdowns.
The maps below show how states are reporting disaggregated data for positive COVID-19 cases (Figure 1) and COVID-19 mortality data (Figure 2) and can be filtered to highlight which states are reporting by each health equity category. States marked by a darker shade of color are reporting more data breakdown categories than lighter-shaded states. Clicking on a state provides a link to each state’s data-reporting website along with more detailed information about which breakdowns a state is reporting.
Figure 1
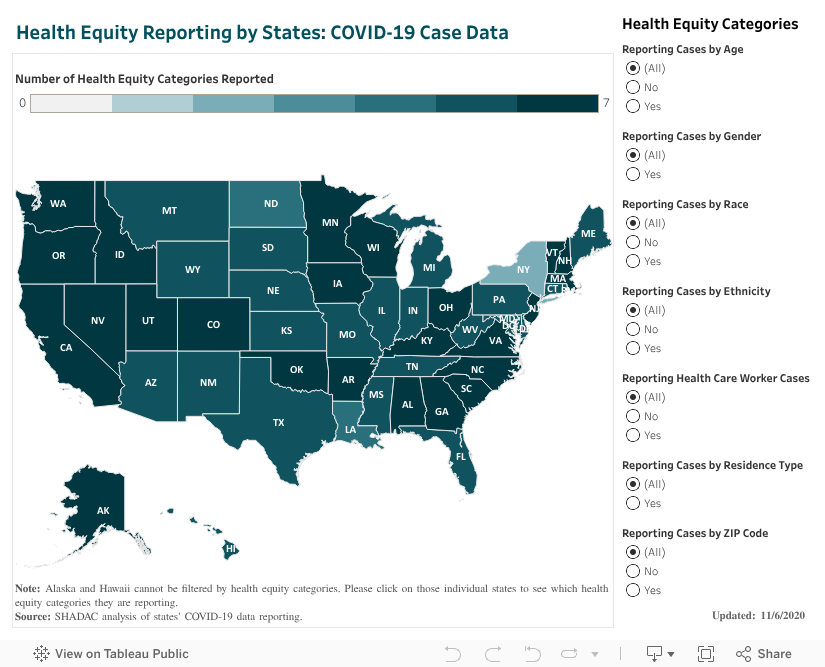
Figure 2
Hospitalizations
In our scan, we identified 26 states that are reporting hospitalization data for some subpopulations, but of those only 18 are reporting hospitalization data by race or ethnicity. (Figure 3.)
Figure 3
Testing
Our scan revealed eight states that are providing testing information by age and gender, and only five—Delaware, Illinois, Indiana, Kansas, and Nevada are also disaggregating testing data by race and ethnicity.
New COVID-19 Related Health Equity Data Activity
In addition to the newly required demographic data required above, several states are exploring, or beginning to report, additional data. For example:
· On September 8th, California became the first state in the nation to require the collection of sexual orientation and gender identity data for all COVID-19 patients.
· Pennsylvania announced it will work with a new data collection platform to collect sexual orientation and gender identity data.
· Minnesota is reporting language needs for positive cases interviewed and language by county of residence
· Massachusetts signed into law an act addressing COVID-19 data collection, requiring the Department of Public Health to compile, collect, and report several demographic factors, including whether an individual hospitalized speaks English as a second language.
A number of states have also formed health equity task forces, several of which are charged with looking at what additional data could be collected and reported. For example:
Colorado: A COVID-19 Health Equity Response Team, headed by the Office of Health Equity, was formed to look at inequities and ways to prevent gaps from widening during the pandemic. One of the Response Team’s tasks is to ensure racial and ethnicity COVID-19 data are accessible, transparent and used in decision-making.
Indiana: A legislative task force, led by the Indiana Black Legislative Caucus and in collaboration with the Interagency State Council on Black and Minority Health, the Indiana State Department of Health Office of Minority Health, and the Indiana Minority Health Coalition, was charged with studying racial disparities in health care and health care outcomes as it relates to COVID-19. The Task Force recommended the collection, stratification, analysis and reporting of race, ethnicity and preferred language data; and recommended action plans and annual reports of race, ethnicity, and preferred language outcomes.
Louisiana: A COVID-19 Health Equity Task Force examined how health inequities are affecting communities that are most impacted by the coronavirus. The Task Force’s Subcommittee on COVID-19 Data and Analysis made several recommendations in its report, including: establishing standardized protocols to ensure that information is consistently collected across the multiple testing sites, especially those pertaining to racial and ethnic identity; ensuring data collection occurs in collaboration with trusted organizations, e.g. tribal organizations and faith-based organizations or nonprofits within the Asian community; creating a data warehouse where harmonized data can be easily extracted for analysis; and allocating resources allocated to the Louisiana Department of Health to accomplish these goals.
Michigan: The Michigan Coronavirus Task Force on Racial Disparities serves as an advisory board within the state's Department of Health and Human Services. Among several charges, the Task Force will: study racial disparities of COVID-19 in Michigan and recommend action to overcome the disparities; recommend actions to increase transparency in reporting data regarding the racial and ethnic impact of COVID-19 and remove barriers to accessing physical and mental health services; and ensure stakeholders are informed, educated, and empowered with information on the racial disparities of COVID-19.
New Hampshire: The Governor’s COVID-19 Equity Response Team was charged with developing a recommended strategy to address the disproportionate impacts of the COVID-19 pandemic. Initial recommendations included: Adopting and following best practices (outlined in the report) for equitable data collection, analysis, dissemination, and utilization; dedicating staff with specific expertise in equitable data best-practice methodologies; and developing internal protocols that require the use of a vetted and approved Equity Review Tool analysis for all programmatic and policy work.
Ohio: The Minority Health Strike Force was charged with addressing the disproportionate impact of COVID-19 on minority populations in the state. The strike force was comprised of four subcommittees: data and research; education and outreach; health care; and resources. The groups’ Blueprint report included data-specific recommendations to improve data collection and reporting, have state agencies develop dashboards to monitor inequities and disparities, and consider the need for sufficient samples to identify disparities in groups with small population sizes. The Governor’s subsequent Executive Response included a commitment to: collect state-level health care quality information stratified by race, ethnicity, and language data; identify the contributing and confounding factor affecting the health disparities; identify and targeting the resources where interventions may be best applied; adopt of standards by state agencies to achieve a normalized set of data that uses the same categorization scheme; and establish evaluation criteria of impacts to inform policy.
Pennsylvania: The Pennsylvania COVID-19 Response Task Force on Health Disparity is charged with identifying obstacles that cause disparity for marginalized populations. The group collaborated with community members, stakeholders, and legislators to send recommendations to the Governor for addressing issues related to a higher incidence of COVID-19 among minorities. The group recommended instituting a statewide standard around racial/ethnic data collection that mirrors the standards in the Affordable Care Act, and disaggregating Asian health data.
Tennessee: The Tennessee Department of Health, Office of Minority Health, launched a statewide Health Disparities Task Force to: examine existing data, monitor trends, and hear from those living, working and serving Tennessee communities to generate responsive solutions and policies to reduce health disparities.
Vermont: A Racial Equity Task Force will undertake projects designed to promote racial, ethnic and cultural equity, including evaluating structures of support for racially diverse populations, including a focus on the racial disparities in health outcomes highlighted by COVID-19. It will submit recommendations to the Governor on the COVID-19 project by August 15.
CARES Act Reporting Requirements
In March 2020 Congress passed, and the President signed, the Coronavirus Aid, Relief, and Economic Security (CARES) Act. The statute required “every laboratory that performs or analyzes a test that is intended to detect SARSCoV-2 or to diagnose a possible case of COVID-19” to report the results from each such test to the Secretary of the Department of Health and Human Services (HHS), and authorized HHS to prescribe the form and manner of such reporting. On June 4, HHS released new guidance outlining the data elements required for reporting, which included, among other elements:
· Patient age
· Patient race
· Patient ethnicity
· Patient sex
· Patient residence zip code
· Patient residence county
· If the patient is employed in health care
· Is the patient a resident in a congregate care setting (including nursing homes, residential care for people with intellectual
and developmental disabilities, psychiatric treatment facilities, group homes, board and care homes, homeless shelter,
foster care or other)
· If the patient is hospitalized
· If the patient is pregnant
The guidance also indicates that additional data elements may be requested by state, local, or federal health departments at any time. If required data elements are not available, providers, laboratories and public health departments are encouraged to leverage resources like state, regional, or national Health Information Exchanges or Networks to obtain missing, required information. Reporting of these data elements must begin no later than August 1, 2020. While this guidance applies to all laboratories, it does not require states or local public health departments to report COVID-19 mortality data by any specific demographic breakdowns.

