
Blog & News
Hest, Robert
Lanigan, Lindsey


Exploring Cost and Coverage Rates in Employer-Sponsored Insurance (Infographic)
September 5, 2023:Throughout the United States, a majority of Americans and their families receive health insurance coverage through their employer. In 2021, the number of people covered by this type of coverage—known as employer-sponsored insurance or ESI—exceeded 169 million. While a fuller picture of the coverage landscape will be available later this fall as agencies such the U.S. Census Bureau release more health insurance data, in this blog and infographic, SHADAC researchers use recently released data from the Medical Expenditure Panel Survey-Insurance Component (MEPS-IC) to analyze private-sector ESI and provide an initial snapshot of estimates for 2022 on a national level and within the states.
Key Findings (2022 vs. 2021)
 Employee Access to Coverage
- The offer of employer-sponsored insurance coverage was extended to a large majority of private-sector workers. In 2022, 85.6% of employees in the U.S. worked in establishments that offered health insurance coverage, a rate that was statistically unchanged from 2021 (85.7%).
Employee Coverage Costs
Premiums
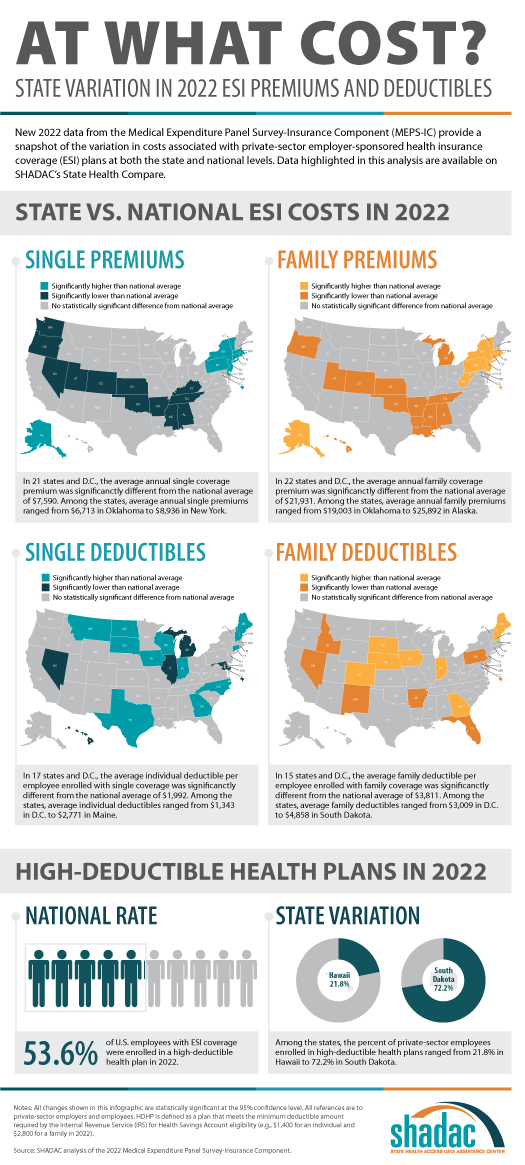
- The average annual premium for single coverage significantly increased to $7,590 in 2022, a $210 or 2.8% increase from 2021.
- Among the states, average annual single premiums ranged from $6,713 in Oklahoma to $8,936 in New York.
- For those enrolled in family coverage, average annual premiums also significantly increased. In this case, premiums increased to $21,931 in 2022, a $550 or 2.6% increase from 2021.
- Among the states, average annual family premiums ranged from $19,003 in Oklahoma to $25,892 in Alaska.
Deductibles
- For single coverage, the 2022 average individual deductible was $1,992, unchanged from 2021 ($2,004).
- Among the states, average individual deductibles ranged from $1,343 in D.C. to $2,771 in Maine.
- Among those enrolled in family coverage, the average deductible per employee enrolled was $3,811 in 2022. This was also unchanged from 2021 ($3,868).
- Among the states, average family deductibles ranged from $3,009 in D.C. to $4,858 in South Dakota.
High-Deductible Health Plans*
- In 2022, the share of employees enrolled in high-deductible health plans (HDHPs) decreased significantly in 2022 to 53.6% – a decrease of 2.1 percentage points from 2021.
- Among the states, the percent of private-sector employees enrolled in high-deductible health plans ranged from 21.8% in Hawaii to to 72.2% in South Dakota.
Key Takeaways
With so many Americans relying on an employer for health insurance coverage, measures of ESI coverage and cost remain important indicators of the financial and health burdens many individuals and families face. These measures will be of greater importance going forward as some current Medicaid enrollees may transition to employer coverage during the 2023-2024 unwinding of the Medicaid continuous coverage requirement. SHADAC is monitoring the unwinding process through a variety of avenues, including: federal surveys, state dashboards, and state-based marketplace data.
In 2022, as in previous years, premiums continued to rise, though premium increases were small compared to the relatively high rate of inflation in 2022. Average deductibles were unchanged from 2021, which represents a break from the long-running trend of increasing deductibles. Additionally, the share of private sector employees enrolled in high-deductible plans decreased by a small but statistically significant margin, which represented the first decrease since 2013. With regard to coverage, a large majority of workers were employed in establishments that offered health insurance coverage, and this was unchanged from 2021.
Notes and Sources
* High-deductible health plans (HDHP) are defined as plans that meet the minimum deductible amount required for Health Savings Account (HSA) eligibility ($1,400 for an individual and $2,800 for a family in 2022).
Data are from the 2022 Medical Expenditure Panel Survey–Insurance Component (MEPS-IC), produced by the Agency for Healthcare Research and Quality (AHRQ).
Health insurance coverage estimates through 2021 are available on SHADAC’s State Health Compare web tool at statehealthcompare.shadac.org, and estimates for 2022 will be added soon.
Blog & News

New State Health Compare estimates on Adverse Childhood Experiences aim to improve understanding of health inequities
August 28, 2023:SHADAC has posted updated estimates of the prevalence of adverse childhood experiences (ACEs) to State Health Compare. These new estimates combine six years of data from the National Survey of Children’s Health (NSCH) to enable more precise and granular estimates for smaller racial and ethnic subpopulation groups that often are under-researched due to data limitations. For instance, the new ACEs estimates include both U.S.- and state-level rates for American Indian/Alaska Native children, Asian children, and Native Hawaiian and Other Pacific Islander children, as well as Black/African American children, Hispanic/Latino children, and White children.
Earlier in 2023, SHADAC researchers Colin Planalp and Andrea Stewart published an issue brief on ACEs, explaining the relationship between potentially traumatic childhood experiences and long-term health impacts. Over the past quarter-century, an established and growing body of research has linked exposure to ACEs with a litany of health conditions that can last into adulthood, including physical health impacts, such as heart disease and diabetes, mental health conditions, and substance use disorders.
These new data build on SHADAC’s earlier work in two important ways. First, while Planalp and Stewart’s issue brief combined four years of NSCH data to allow for disaggregation of racial and ethnic groups at the U.S. and state levels, our decision to combine six years of NSCH data resulted in additional precision, which supports equity-focused analysis for demographically small populations. While that approach entails tradeoffs, such as making the data a bit less recent, we believe the advantages outweigh the disadvantages, especially for assessing the relationship between ACEs and health equity.
Second, the referenced issue brief reported estimates for one or more ACEs—a useful measure for examining the prevalence of ACEs, but this measure has limitations for understanding the implications of ACEs. Research suggests that ACEs carry a “dose effect,” meaning that exposure to one ACE carries some health risk, but exposure to multiple ACEs during childhood entails a substantially higher risk of associated health burdens. For the updated SHC estimates pooling six years of data, we were able to produce three estimates: Percent of children with zero reported ACEs, percent of children with one reported ACE, and percent of children with multiple (i.e., two or more) ACEs.
As with SHADAC’s earlier work on the topic, these new estimates of ACEs prevalence illustrate clear health disparities. For instance, American Indian/Alaska Native children had the highest reported exposure to multiple ACEs, at almost four in 10 children, while Asian children had the lowest, at less than one in 10 children (see table below).
Percent of Children Exposed to Two or More ACEs by Race/ethnicity, 2016-2021
| Race/ethnicity group | Percent |
|---|---|
| American Indian/Alaska Native | 36.5% |
| Asian | 5.9% |
| Black/African American | 27.4% |
| Hispanic/Latino | 19.0% |
| Native Hawaiian/Other Pacific Islander | 19.0% |
| White | 16.4% |
| Other/Multiple Races | 24.6% |
Sources: SHADAC analysis of 2016-2021 National Survey of Children’s Health
Together with research linking ACEs to long-term health burdens, these new estimates on SHADAC’s State Health Compare bolster our understanding of how childhood experiences influence health equity: By intervening to reduce the prevalence of ACEs and eliminate disparities in their prevalence, the U.S. might not only improve the lives of children now but improve their health well into adulthood and enhance health equity across our society.
Related Reading
Supporting Families: Associations between Neighborhood Support and Child Health Outcomes Blog
The Kids Aren't Alright: Adverse Childhood Experiences and Implications for Health Equity, Issue Brief
Neighborhood Support Matters for Child Health, Blog
Blog & News
Supporting Families: Associations between Neighborhood Support and Child Health Outcomes
August 24, 2023:Background
The circumstances of peoples’ lives have great influence over their health, often much more than genetics or access to health care—a concept known as “social determinants of health.” One such social determinant is social capital, which includes the networks of relationships that people rely on for help and to help others to exist and function in society.
We wanted to understand how one measure of social capital—living in a supportive neighborhood—may affect people’s health status and other risk factors. Our study focused on children, using data from the National Survey of Children’s Health (NSCH), which asks parents about their kids’ health, certain risk factors, and questions about their perceptions of social support in their neighborhoods.
Parents reported the extent to which they agreed—from “strongly disagree” to “strongly agree”—with three related questions about giving and receiving help in their neighborhoods. Children were defined as living in a supportive neighborhood if their parents agreed with all three questions and “strongly agree” with at least one of them:
- People in this neighborhood help each other out.
- We watch out for each other's children in this neighborhood.
- When we encounter difficulties, we know where to go for help in our community.
Study approach
The NSCH includes nationally representative data for children age 0-17 in all 50 states. This survey provides important information on child and family characteristics, as well as parental perceptions of neighborhood support. In the NSCH, children with special health care needs are identified with a five-item screener based on whether they have health needs such as prescription medication or specialized therapies for a condition expected to last longer than 12 months. We assessed which groups of children were more likely to live in supportive neighborhoods, and how this support correlated with child health and access to health care. We pooled 2020-2021 data (n=88,891) to enhance our ability examine the relationship between neighborhood support and the health status of children with greater precision and reliability.
To understand how supportive neighborhoods relate to children’s health, we focused on five child health measures including access to and use of health care, and exposure to a set of health risk factors known as adverse childhood experiences (ACEs). The measures were based on parents’ responses:
Health status
- Parent-reported child health status, measured as fair/poor vs. excellent/very good/good
- Parent-reported oral health status, measured as fair/poor vs. excellent/very good/good
Health care access and use
- Emergency room (ER) visit in the past year (one or more)
- Any past-year forgone health care in the past year (medical, dental, vision, or mental health care)
ACEs
- Exposure to two or more ACEs. This composite measure was based on parent recollection for a list of potentially traumatic experiences in the child’s household, such as difficulty affording basic necessities, divorce, death of a parent, exposure to violence in the home or neighborhood, and living with someone experiencing mental illness or substance abuse.
Findings
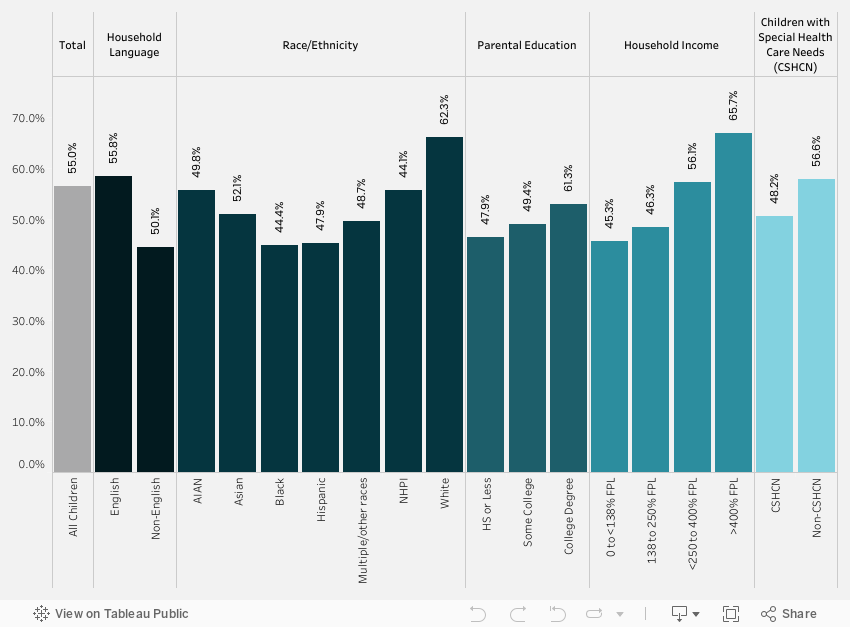
We found that slightly over half (56.4%) of all children lived in neighborhoods that their parents reported as supportive (Figure 1). The lowest rates of children living in supportive neighborhoods were reported for subgroups of children who were black (44.8%) or Hispanic (45.3%); who lived in households in which English was not the primary language (44.5%); who had family incomes below the federal poverty level (45.6%); or whose parents had an education of high school or less (46.3%). Children with special health care needs were also less likely to live in supportive neighborhoods (50.5%). The differences in children’s neighborhood support by race/ethnicity, household language, income, education, and special health care needs were significant and consistent in our tabulation of population rates and multivariate analysis.
Figure 1. Neighborhood support by child characteristics
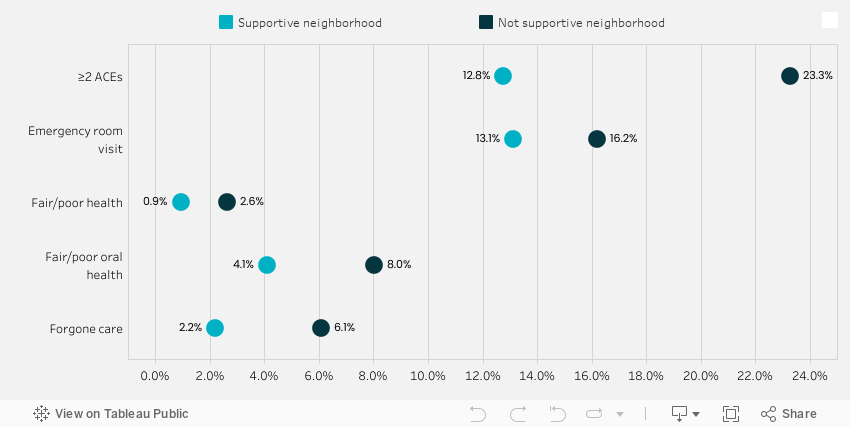
Importantly, we also found that children living in supportive neighborhoods had fewer ER visits, better access to health care (less forgone health care); better health status (less likely to have fair/poor health and oral health); and a lower prevalence of having two or more ACEs (Figure 2). Exposure to multiple ACEs is a risk factor for a number of long-term health conditions. The significant association between neighborhood support and better child outcomes shown in Figure 2 remained consistent in multivariate analysis.
Figure 2. Rates of child outcomes by neighborhood support
Conclusions
Our study highlights the importance of one measure of social capital—living in supportive neighborhoods—for a range of child outcomes including ER use, forgone care, overall and oral health status, and ACEs. This research bolsters the arguments for policies that support social networks and supports in the communities where children live, such as school and community health resources.
For children, community resources are important for their long-term outcomes. Strong neighborhoods support population health in nuanced ways that go beyond a neighborhood’s more obvious features, such as parks where people can exercise and grocery stores where people can buy healthy food. For example, previous research has shown that living in supportive neighborhoods with social networks to care for kids can mitigate the negative impact of traumatic experiences on child mental health. Our study found that neighborhood support is also associated with a reduced likelihood of ACEs and a range of beneficial child health outcomes.
This analysis was originally presented at the Academy Health Annual Research Meeting in Seattle, WA, on 6.26.2023.
Related Reading
New State Health Compare estimates on Adverse Childhood Experiences aim to improve understanding of health inequities Blog
The Kids Aren't Alright: Adverse Childhood Experiences and Implications for Health Equity, Issue Brief
Neighborhood Support Matters for Child Health, Blog
Blog & News

Interventions Likely Prevented Childhood Poverty from Rising During the Pandemic
July 20, 2023:Research has shown that since the start of the COVID-19 public health crisis, aggressive government interventions, aimed at reducing broader economic fallout as well as individual-level hardship, have been largely sucessful.1 To preempt a potential increase in poverty due to pandemic-related job loss, income loss, and health insurance coverage loss, the federal government implemented policies such as a temporary Child Tax Credit (CTC), COVID-19 rescue payments, requirements for states to maintain current Medicaid enrollment and coverage, and increased SNAP (food stamp) allotments.1,2 Evidence suggests that these targeted actions may have contributed to a small but statistically significant decrease in nationwide childhood poverty between 2019 and 2021, falling from 19.1% to 18.7%, as seen in data available on SHADAC’s State Health Compare tool.
| Childhood poverty is defined as children whose household incomes are below 100% of the Federal Poverty Guidelines, which was $30,000 in 2021, for a family of four.3 |
In this blog, SHADAC presents 2021 estimates of childhood poverty at the national and state level based on our analysis of the U.S. Census Bureau’s American Community Survey (ACS) Public Use Microdata Sample (PUMS) file and compares them to 2019 data, as 2020 childhood poverty estimates were not released due to pandemic impacts on data collection. (Please see a previous blog for more technical detail.) We also highlight notable differences in childhood poverty estimates for different racial and ethnic populations.
Highlights from 2021 Data
Compared to the pre-COVID-era figures previously reported by SHADAC, 2021 estimates for childhood poverty were significantly lower both at the overall national level and in five particular states — Arizona, Connecticut, Missouri, Tennessee, and Utah — while no states saw any significant increases in their childhood poverty rates.3 These data highlight the surprising fact that childhood poverty declined at a time when many expected it to rise for the reasons highlighted above.
Childhood poverty rates remain highest in southern states, specifically in Mississippi, followed by Louisiana, New Mexico, the District of Columbia (D.C.), and Alabama. Consistent with 2019 data, states in the Northwest, Northeast, and Midwest regions tend to have the lowest rates of childhood poverty, with New Hampshire having the lowest rate at 9.0%, followed by Utah, Vermont, Minnesota, and North Dakota.
| 5 states with the lowest rates | 5 states with the highest rates | |||
| New Hampshire | 9.0% | Mississippi | 29.4% | |
| Utah | 9.1% | Louisiana | 27.7% | |
| Vermont | 9.7% | New Mexico | 27.2% | |
| Minnesota | 10.2% | District of Columbia | 27.1% | |
| North Dakota | 10.3% | Alabama | 23.8% | |
Current survey data only allow for demographic disaggregation by race and ethnicity, specifically for African American/Black, Hispanic/Latino, non-Hispanic White, and Other/Multiple Race populations. In 2021, estimates show that one-third of children (33.9%) who identified as African American/Black were living in poverty. In addition, a quarter of children (25.7%) who identified as Hispanic/Latino were living in poverty, while 16.4% of children who identified as being of Other/Multiple races and 11.6% of those who identified as White were living in poverty, respectively.
Figure 1. Percent of children considered to be poor (<100% FPG) by state, 2021
Understanding Poverty Trends Pre- and Post-Pandemic
Despite concerns that the economic consequences of the COVID-19 pandemic would increase rates of childhood poverty, data show the opposite – a small but statistically significant decline. Combined with other research that uses measures of economic well-being, this falling poverty rate suggests that targeted pandemic-era government actions likely succeeded in their efforts to prevent further hardship during this latest public health crisis.
These positive data trends are welcome news, especially given that childhood poverty can have lasting negative effects. For example, children living in poverty are twice as likely to be exposed to adverse childhood experiences, according to a February 2023 SHADAC brief on Adverse Childhood Experiences (ACEs). Childhood poverty can also contribute to both a greater likelihood of disease onset in adulthood and limited chances for socioeconomic mobility or educational opportunity.4
Conclusions
Specific pandemic-era interventions implemented by the federal government likely contributed to a drop in childhood poverty rates between 2019 and 2021. Although programs such as the Child Tax Credit were short-lived and enacted in response to the COVID-19 public health crisis, their success in helping to reduce overall childhood poverty rates bears consideration as longer-term mechanisms to address this issue. Additionally, while overall poverty rates for children declined during this time period, evidence showing disparities in childhood poverty rates by race and ethnicity remains – likely influenced by factors such as systemic racism, social marginalization, and community-level disinvestment.4 For these reasons among others, continued research, monitoring, and advocacy efforts are vital in the ongoing fight against childhood poverty.
About the Data
The measure used for these estimates, “Percent of children considered to be poor (<100%FPG),” can be accessed through SHADAC’s online data tool, State Health Compare. These estimates were produced through SHADAC’s analysis of the American Community Survey (ACS) Public Use Microdata Sample (PUMS).
References
1. Collyer, S., Hardy, B., & Wimer, C. (2023, March 1). The antipoverty effects of the expanded Child Tax Credit across states: Where were the historic reductions felt? Brookings Institute. https://www.brookings.edu/research/the-antipoverty-effects-of-the-expanded-child-tax-credit-across-states-where-were-the-historic-reductions-felt/
2. United States Census Bureau. (2023, May 2). The Impact of the 2021 Expanded Child Tax Credit on Child Poverty. https://www.census.gov/library/working-papers/2022/demo/SEHSD-wp2022-24.htm
3. State Health Access Data Assistance Center. (2023, April 18). FPG vs. FPL: What’s the Difference? SHADAC.https://www.shadac.org/news/fpg-vs-fpl-whats-difference
4. Woolf, S. H. (2017). Progress In Achieving Health Equity Requires Attention to Root Causes. Health Affairs.https://www.healthaffairs.org/doi/10.1377/hlthaff.2017.0197
Blog & News

Analyzing Forgone Care by Coverage Type: New on State Health Compare
June 29, 2023:For most Americans, having health insurance is an important first step to being able to access and afford health care when it is needed.
As shown in recent data published on SHADAC’s State Health Compare, adults with health insurance coverage were at least 79% less likely to report having forgone (gone without) medical care when they needed it because of cost than adults without health insurance coverage. Whereas 63 percent of adults without health coverage reported forgone care, no more than 14 percent of those with coverage reported forgone care. This statistic illustrates the ability of health insurance coverage to protect against unexpected health care costs.
However, these data indicate that health insurance coverage’s ability to protect against unexpected health care costs varies by state and by type of health insurance coverage. The chart below shows the percent of adults (age 18+) who could not get medical care when needed due to cost by state and source of health insurance coverage. In the U.S., adults with some types of coverage such as Medicare (5 percent) or employer/military coverage (6 percent) were less likely to have gone without care because of cost compared with other types of coverage, such as individual coverage (10 percent) or Medicaid/CHIP coverage (14 percent).
It is important to note that the size of these differences in the protective power of health insurance coverage varied substantially by state. For example, where 11 percent of Georgia adults with employer coverage went without care, just 3 percent of employer-covered adults in the District of Columbia went without care. And similar state differences existed for other types of coverage:
- For adults with Medicare coverage, 9 percent of Louisianans had forgone care versus 3 percent of Vermonters.
- For adults with individual coverage, 16 percent of Nevadans had forgone care versus 3 percent of Vermonters.
- For adults with Medicaid/CHIP coverage, 25 percent of Oklahomans had forgone care versus 7 percent of South Dakotans.
- For adults with no health insurance coverage, 77 percent of Nevadans had forgone care versus 44 percent of South Dakotans.
These state differences highlight the inconsistency in the quality of health insurance coverage across the U.S., often related to differences in states’ markets for private health insurance coverage (e.g., individual coverage or employer coverage), differences in state Medicaid and CHIP programs, and differences in health care costs across the states.
Differences by coverage type call attention to variation in the ability of different types of health insurance coverage to protect covered adults from the risks of expensive or unexpected health care needs. However, these differences also highlight disparities in the underlying economic and health vulnerabilities of adults covered by different types of coverage.
Accessing BRFSS Coverage Data on State Health Compare
The data presented here come from SHADAC analysis of the 2021 Behavioral Risk Factor Surveillance System (BRFSS), a survey conducted in partnership between states and the Centers for Disease Control, and are available on SHADAC’s State Health Compare web tool.
Data on detailed health insurance coverage types were collected among all participating states in the BRFSS for the first time in 2021. These new data have allowed State Health Compare to include breakdowns by detailed coverage type for all eight BRFSS measures that feature 2021 data and are the first source of information about these important measures of access and affordability of care, outcomes, and health behaviors for adults with specific types of coverage (e.g., Medicaid/CHIP).
BRFSS measures to explore further:
Notes: All differences described in this analysis are statistically significant at the 95% confidence level. Estimates are representative of the civilian non-institutionalized population 18 years and over and are based on SHADAC analysis of the 2021 Behavioral Risk Factor Surveillance System public use files. Florida data are not available in 2021 because the state was unable to collect sufficient data, and 2021 national data do not include Florida. Other state-level data were not available due to suppression where the number of sample cases was too small.

