
Blog & News


2017 ACS: More States Saw Declines in Private and Public Coverage, Fewer Saw Increases, than in 2016
September 13, 2018:The U.S. Census Bureau released the full state files for the 2017 American Community Survey (ACS) today, including state-level information about health insurance coverage by coverage type.
Coverage by Type, 2016-2017: Nationally, Private Coverage Down and Public Coverage Stable
The ACS found a 0.2 percentage-point national decrease in health insurance coverage between 2016 and 2017, from 8.6% to 8.7%.[1][2] This decrease was driven by a national decrease in private coverage, which also fell by 0.2 percentage points between 2016 and 2017, from 67.8% to 67.6%.[3] The national rate of public coverage remained statistically unchanged from 2016 to 2017 at 35.5%.[4]
In the States
The national overall decrease in insurance coverage in 2017 was mirrored by significant overall coverage decreases in 14 states, although three states did see significant increases in coverage. There was variation among states in the extent to which there were changes in rates of public and private coverage in particular, and in whether these changes represented increases or decreases.
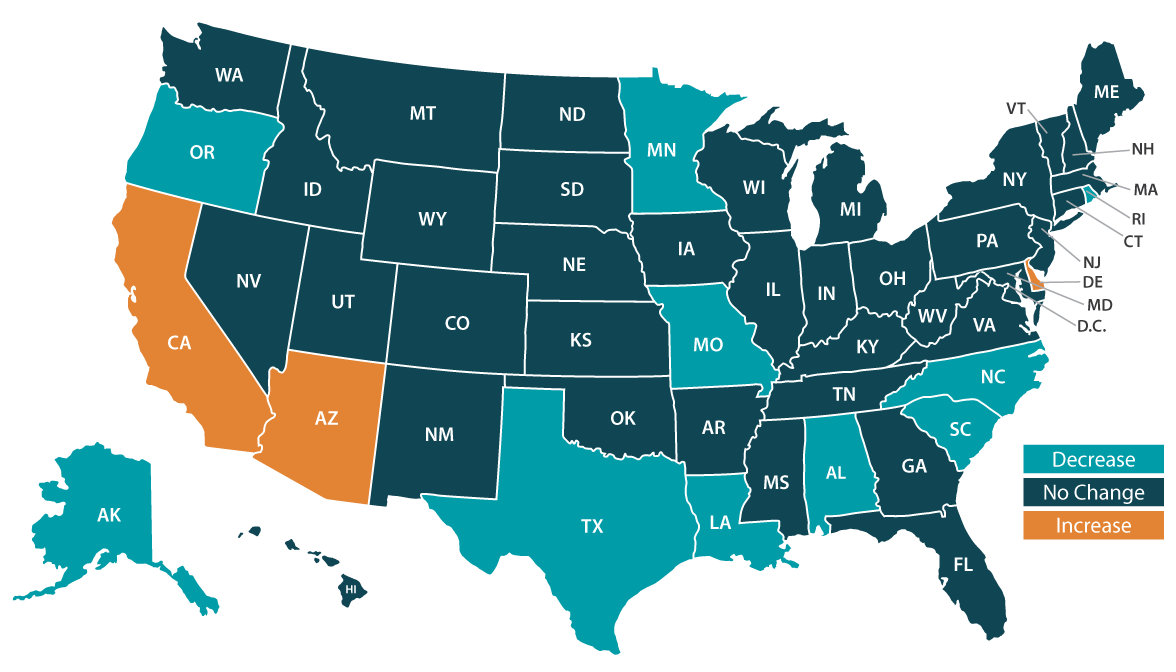
Private Coverage Rates by State, All Ages, 2016-2017: Three States Saw Increases, 10 Saw Decreases
- Three states (Arizona, California, and Delaware) experienced significant increases in private coverage rates in 2017, representing a change from 2016, when private coverage increased significantly in 13 states. Delaware saw the largest increase in private coverage from 2016 to 2017, growing 2.2 percentage points from 71.4% to 73.6%.
- Private coverage decreased significantly in 10 states (Alabama, Alaska, Louisiana, Minnesota, Missouri, North Carolina, Oregon, Rhode Island, South Carolina, and Texas) from 2016 to 2017, an uptick from 2016, when five states and the District of Columbia experienced significant decreases in private coverage. Alaska saw the largest 2017 decrease in private coverage, with its rate falling 4.1 percentage points from 67.3% to 63.2%.
- 38 states (including DC) saw no significant change in rates of private coverage.
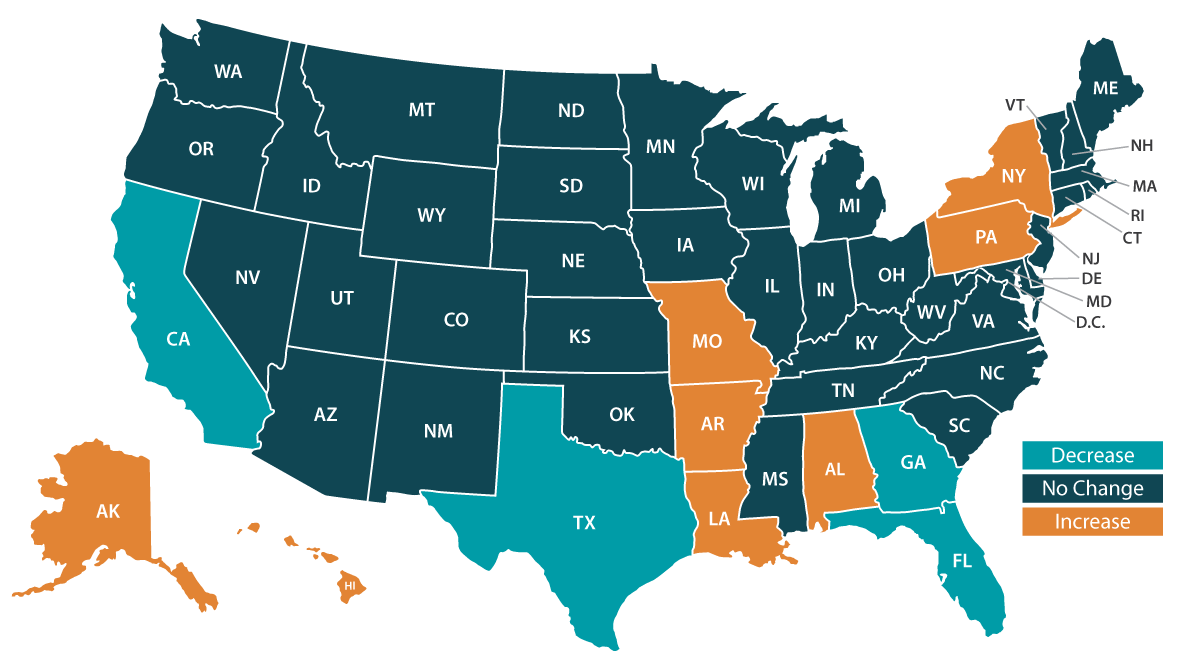
Public Coverage Rates by State, All Ages, 2016-2017: Eight States Saw Increases, Four Saw Decreases
- Public coverage increased significantly in eight states (Alabama, Alaska, Arkansas, Hawaii, Louisiana, Missouri, New York, and Pennsylvania) in 2017, representing a downward shift from 2016, when 29 states experienced significant increases in public coverage. Alaska had the largest percentage-point increase (+5.3) in public coverage in 2017, moving from 29.4% to 34.7%.
- Four states (California, Florida, Georgia, and Texas) saw decreases in public coverage from 2016 to 2017, again representing a change from 2016, when no state experienced a decrease in public coverage. Georgia had the largest drop in public coverage, decreasing 0.6 percentage points from 31.3% to 30.7%.
- 39 states (including DC) saw no change in public coverage rates in 2017.
Private and Public Coverage Rates by State, All Ages, 2017: Ongoing State Variation
State variation is seen not only in the prevalence and direction of public and private coverage changes between 2016 and 2017 but also in levels of public and private coverage when looking at the 2017 estimates on their own.
- North Dakota continued to have the highest rate of private coverage in 2017 (as in 2016) at 79.8%.
- New Mexico (as in 2016) had the lowest rate of private coverage in 2017 at 54.4%.
- New Mexico also had the highest rate of public coverage in 2017 at 49.2%.
- Utah had the lowest rate of public coverage in 2017 (as in 2016) at 21.4%.
Access the full 2017 ACS 1-year tables on American FactFinder.
More to Come
Stay tuned for more granular details about insurance coverage changes in the states from 2016 to 2017 via customized SHADAC tables examining coverage at the state and county level.
Related Reading
2017 ACS: Uninsured Rate Increased Nationally and in 14 States (Infographic)
Census Bureau Experts Will Share Insights during September 18th Webinar
On Tuesday, September 18th, SHADAC will host a webinar to examine the new 2017 ACS and CPS estimates, with technical insight provided by researchers from SHADAC and from the U.S. Census Bureau, which administers both surveys.
Speakers will discuss the new national and state estimates, and attendees will learn:
- When to use which estimates from which survey
- How to access the estimates via Census reports and American FactFinder
- How to access state-level estimates from the ACS using SHADAC tables
Attendees will have an opportunity to ask questions after the speaker presentations.
[1] The uninsurance estimates provided are rounded, while percentage-point changes are calculated using unrounded numbers; thus the national uninsured rate increased by 0.2 percentage points.
[2] All changes described in this document are significant at the 90% level. (A previous iteration of this blog used 95% confidence intervals for state estimates.) All estimates are for all ages.
[3] Private coverage includes individually-purchased and employer-sponsored coverage.
[4] Sum of public and private coverage estimates exceeds 100% because survey respondents may report more than one type of coverage.

