
Blog & News


2018 ACS: National Uninsurance Increased alongside Eight States; Three States Saw Decreases (Infographic)
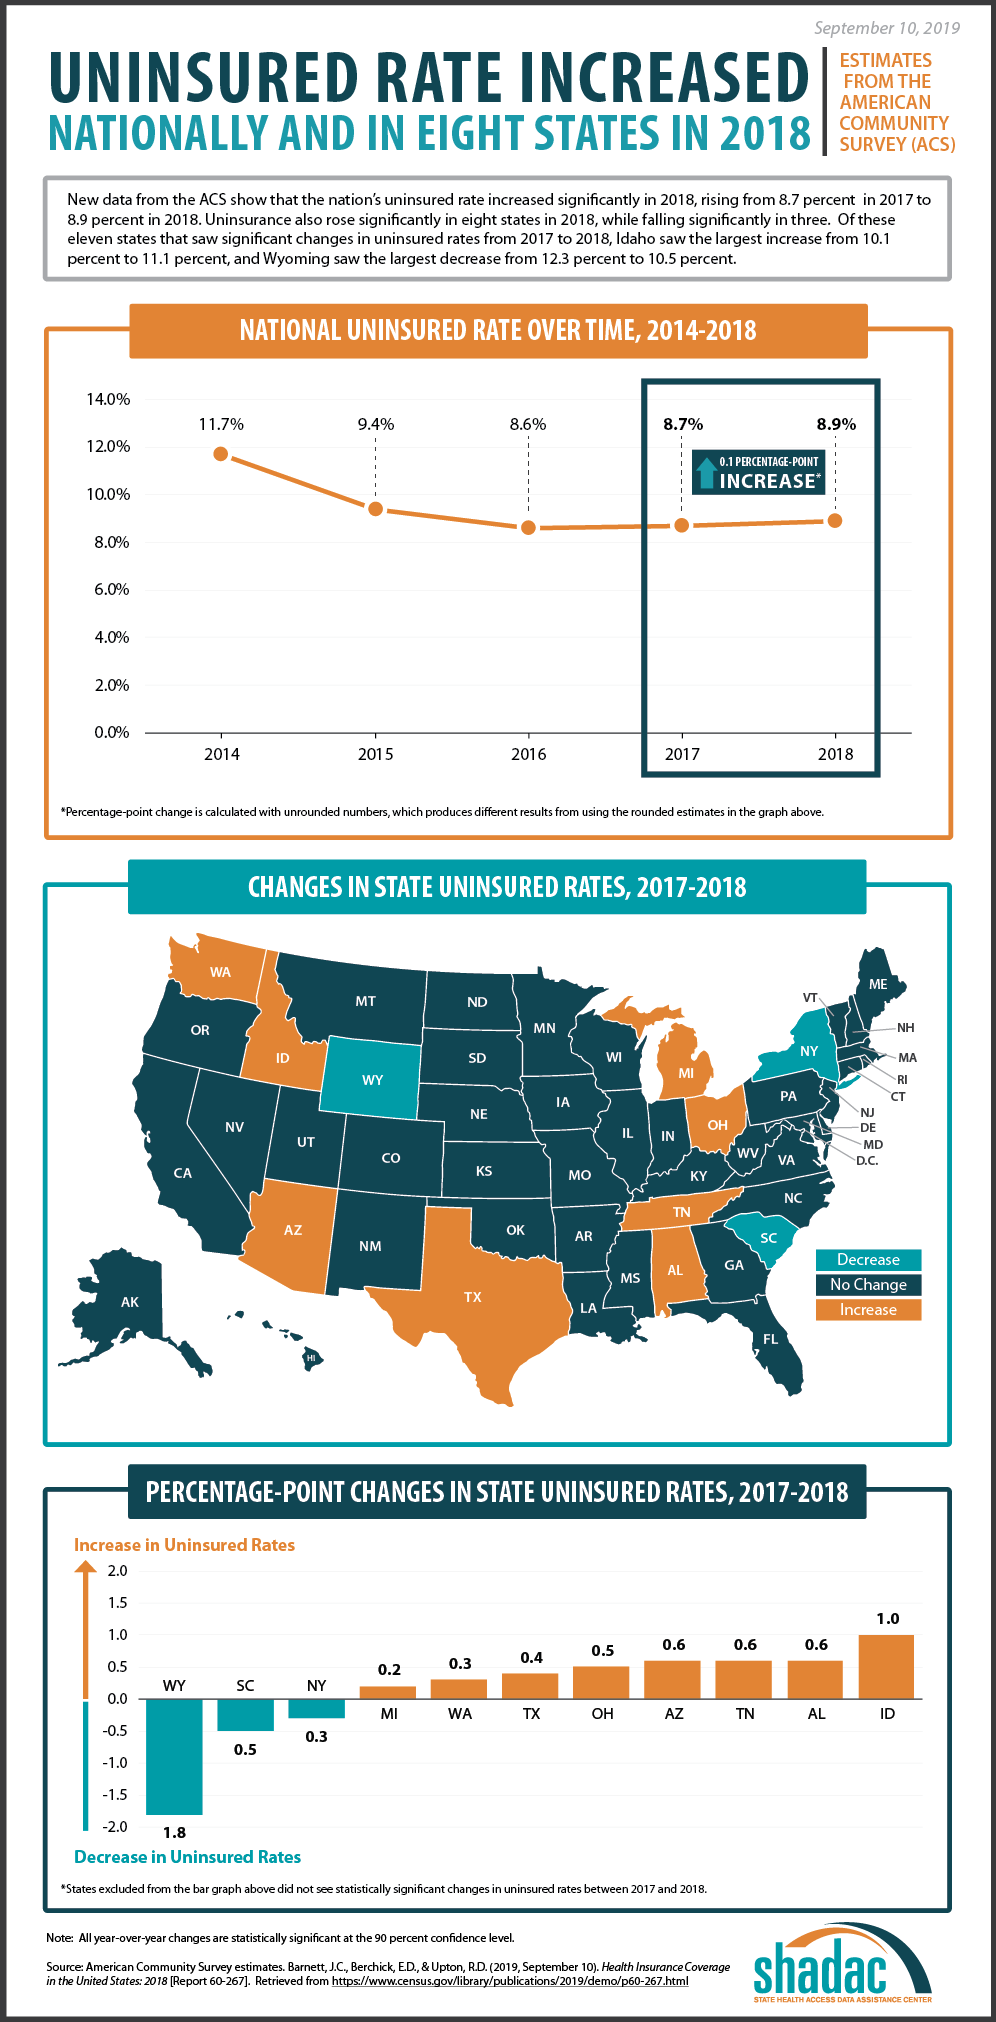
September 10, 2019:New health insurance coverage estimates from the U.S. Census Bureau’s American Community Survey (ACS) show that the rate of uninsured individuals in the United States increased by 0.1 percentage points in 2018, representing 535,000 more Americans without health insurance coverage as compared to 2017. Rates of uninsurance also increased significantly in eight states, and rates decreased significantly in just three states.
Changes in Uninsurance from 2017 to 2018
Nationally, uninsurance increased from 8.7 percent to 8.9 percent from 2017 to 2018, according to new estimates from the ACS.
Eight states saw significant increases in uninsurance from 2017 to 2018, including Alabama, Arizona, Idaho, Michigan, Ohio, Tennessee, Texas, and Washington (Table 1). Among these states, Idaho saw the largest increase in uninsurance, at 1.0 percentage points.
Michigan and Washington experienced the smallest increases in uninsurance, at 0.2 and 0.3 percentage points. 2018 increases in uninsurance in Ohio and Tennessee follow previous increases in uninsurance in these states from 2016 to 2017.
| State | 2017 Percent Uninsured | 2018 Percent Uninsured |
Percentage-Point Change, 2017-2018* |
| Idaho | 10.1 | 11.1 | 1.0 |
| Alabama | 9.4 | 10.0 | 0.6 |
| Tennessee | 9.5 | 10.1 | 0.6 |
| Arizona | 10.1 | 10.6 | 0.6 |
| Ohio | 6.0 | 6.5 | 0.5 |
| Texas | 17.3 | 17.7 | 0.4 |
| Washington | 6.1 | 6.4 | 0.3 |
| Michigan | 5.2 | 5.4 | 0.2 |
| United States | 8.7 | 8.9 | 0.1 |
| New York | 5.7 | 5.4 | -0.3 |
| South Carolina | 11.0 | 10.5 | -0.5 |
| Wyoming | 12.3 | 10.5 | -1.8 |
*Differences are calculated with unrounded numbers, which may produce different results from using the rounded values in the table.
Source. U.S. Census Bureau analysis of the American Community Survey. Health Insurance Coverage in the United States: 2018 [Report P60-267]. Table 6: Percentage of People Without Health Insurance Coverage by State: 2017 and 2018 [Excel file]. Retrieved from https://www.census.gov/data/tables/2019/demo/health-insurance/p60-267.html
Three states—New York, South Carolina, and Wyoming—each experienced statistically significant decreases in uninsurance from 2017 to 2018.
Of these states, Wyoming saw the largest drop in uninsurance at 1.8 percentage points. South Carolina also experienced a 0.5 percentage-point drop in uninsurance from 11.0 percent to 10.5 percent, reversing the significant increase experienced by the state from 2016 (10.0 percent) to 2017 (11.0 percent). New York also experienced a slightly smaller decrease of 0.3 percentage points in uninsured rates, from 5.7 percent in 2017 to 5.4 percent in 2018.
Uninsurance Levels in 2018
Texas continued to have the highest uninsured rate in 2018 at 17.7 percent—a 0.4 percentage-point increase from 17.3 percent in 2017.
The state with the lowest uninsured rate for 2018 was again Massachusetts, holding steady at 2.8 percent.
Among states that expanded Medicaid, Arizona, Michigan, Ohio, and Washington, saw increases in uninsurance, while only New York saw a decrease. State-level uninsured rates among expansion states ranged from a low of 2.8 percent in Massachusetts to a high of 12.6 percent in Alaska.
Overall, among states that did not expand Medicaid, Alabama, Idaho, Texas, and Tennessee each experienced an increase in uninsurance, while South Carolina and Wyoming experienced significant decreases. Individual state uninsured rates among non-expansion states ranged from a low of 5.5 percent in Wisconsin to a high of 17.7 percent in Texas.
SHADAC and Census Bureau Experts Will Share Insights during October 1st Webinar
On Tuesday, October 1st at 12:00 PM Central Time (1:00 PM Eastern), SHADAC will host a webinar to examine the new 2018 ACS and CPS estimates, with technical insight provided by researchers from SHADAC and from the U.S. Census Bureau, which administers both surveys.
Speakers will discuss the new national and state-level estimates, and attendees will learn:
- When to use which estimates from which survey
- How to access the estimates via Census reports and the new data.census.gov site
- How to access state-level estimates from the ACS using SHADAC tables
Attendees will have an opportunity to ask questions after the speaker presentations.
Notes
All differences described here are significant at the 90% confidence level.
All estimates are from the 2017 and 2018 American Community Surveys, as published here: https://www.census.gov/data/tables/2019/demo/health-insurance/p60-267.html

