Blog & News
Covid-19 Vaccine Hesitancy in the U.S. has Reached a Plateau: Evidence from the Household Pulse Survey
April 1, 2022:Previous analysis produced by SHADAC using data from the Household Pulse Survey (HPS) showed promising evidence of a reduction in COVID-19 vaccine hesitancy during the first three months of 2021. However, though this report highlighted an overall decline in hesitancy, it also showed disparities in the level of hesitancy between demographic and socioeconomic groups. In an effort to continually illuminate barriers to vaccine receipt, this blog provides an updated look at vaccine hesitancy among U.S. adults (age 18 and older) using HPS data from January through October 2021.
|
The Household Pulse Survey is an ongoing weekly tracking survey designed to measure the impact of the COVID-19 pandemic. These data provide multiple snapshots of COVID-19 vaccine hesitancy and are the only data source to do so at the state level over time. Click on any graphic throughout this blog to view it in full-screen mode. |
The HPS allows respondents to identify multiple reasons for not receiving all vaccine doses.
For the survey period of January 6-July 5 the reasons listed on the survey form included:
| 1) Concerned about possible side effects 2) Plan to wait and see if it is safe and may get it later 3) Think other people need it more than I do right now 4) Don't know if a vaccine will work |
5) Don't trust the vaccine
6) Don't trust the government
7) Don't believe I need a vaccine
8) Don't like vaccines
|
9) Concerned about the cost of a COVID-19 vaccine 10) My doctor has not recommended it 11) Other reason |
For the survey period of July -October 11 the reasons listed on the survey form changed to include:
| 1) Concerned about possible side effects 2) Plan to wait and see if it is safe and may get it later 3) Don't know if a vaccine will protect me 4) Don't trust the vaccine |
5) Don't trust the government
6) Don't believe I need a vaccine
7) Don't think COVID-19 is that big of a threat
8) My doctor has not recommended it
|
9) Concerned about the cost of a COVID-19 vaccine 10) Hard for me to get a vaccine 11) Experienced side effects from 1st dose of vaccine 12) Believe one dose is enough to protect me |
Because the reasons for not receiving a vaccine changed between these two periods, they will be reported separately in our analysis.i
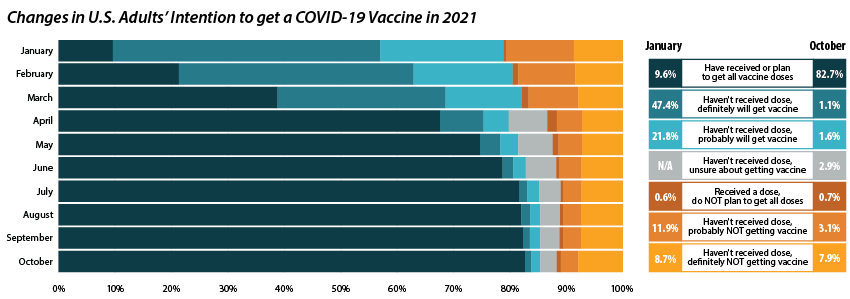
Share of adults who received or plan to receive all COVID-19 vaccine doses plateaued at the end of 2021.
From July through October 2021, the percent of people who have received or plan to receive all COVID-19 doses plateaued at around 80.0 percent.ii,iii This was after an initial jump from 9.6 percent in January to 67.6 percent in April. The initial increase drew mainly from the “Definitely planning to receive a vaccine” and “Probably going to receive a vaccine” groups. The percent of people who “Received a dose, but do not plan to receive all doses,” “Haven’t received a dose and are unsure about getting a vaccine,” “Haven’t received a dose and are probably not getting a vaccine,” and “Haven’t received a dose and definitely are not getting a vaccine” has also remained stable over the same period. Collectively, these four groups, which we define as being “hesitant,” dropped from a rate of 21.1 percent in January to 14.8 percent in July, where it’s remained since.
Vaccine Hesitancy varied by state, but nearly all states saw a reduction.
Nationally, 14.6 percent of adults reported being hesitant about the COVID-19 vaccine in October 2021. This varied across states, from a high of 28.9 percent in Wyoming to a low of 5.4 percent in the District of Columbia (D.C.).
The national rate of adult vaccine hesitancy decreased from 14.8 percent in July to 14.6 percent in October—a 0.2 percentage-point (PP) decrease. This overall decrease, though not significantly large, was reflected in 26 states plus D.C., which also saw promising reductions in vaccine hesitancy. Twenty-four states did not show reductions in hesitancy over that time period.
Concerns over possible side effects remains the top reason reported for vaccine hesitancy.
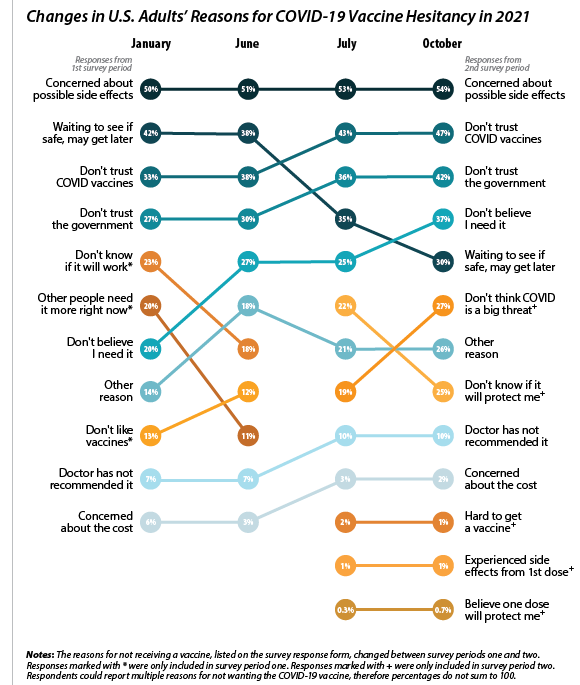 Of the 21.1 percent of people who reported hesitancy in January, nearly half (48.3 percent) cited “Concerns over possible side effects” as a reason.iv This continued to be the most reported reason for hesitancy, with 53.8 percent who were hesitant in October citing it as a reason. The percent of people reporting “Plan to wait and see if it is safe” declined over the 10-month period, from 42.1 percent in January to 30.4 percent in October, and dropped from the second to the fourth most reported reason behind “Don’t trust COVID-19 vaccine” and “Don’t trust the government.” This shift in reasoning behind vaccine hesitancy highlights a major barrier to vaccination goals, as establishing trust is a potentially more difficult and imprecise process than quelling fears of side effects.
When examining survey responses from January and October 2021, our analysis found that both the number of reasons for hesitancy (2.5 per person and 2.9 per person, respectively) and the most common reason for hesitancy (“concerns over possible side effects”) remained statistically unchanged between the two survey periods. Our analysis also found that the rankings of the reasons for hesitancy held within subpopulations by region, race/ethnicity, and income, as highlighted in the following sections.
Disparities in vaccine hesitancy improved over time, though many remain.
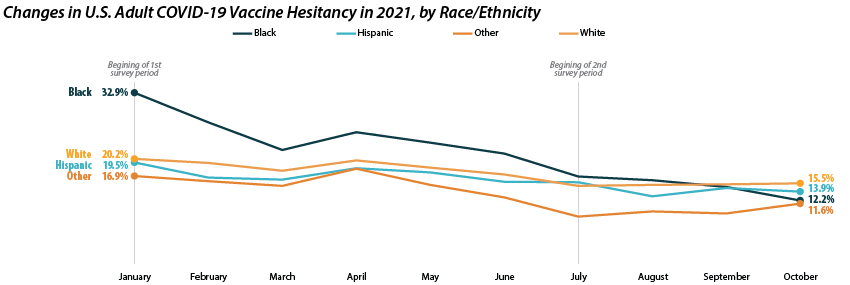
As with our previous analysis of the HPS, both overall hesitancy and disparities in vaccine hesitancy between demographic and socioeconomic groups has improved, though unevenly. The most notable reduction comes among Black adults, who registered a high of 32.9 percent in January and dropped down to 12.2 percent in October. This decline in vaccine hesitancy essentially closed the gap between Black adults and other racial/ethnical groups. Unfortunately, the rate of decline seems to have reached a plateau among certain demographics. For example, among White adults the hesitancy rate stabilized at around 15.0 percent between July and October.
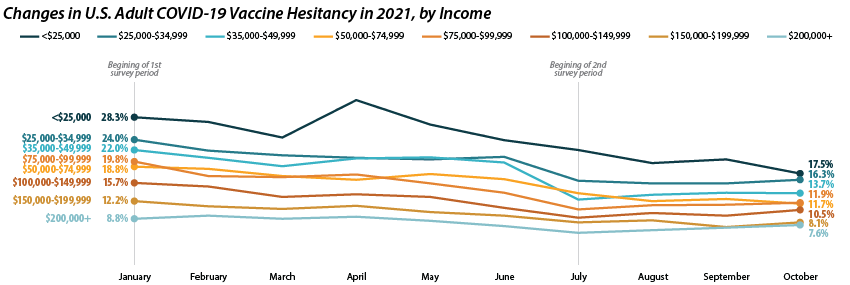
Similar patterns appear when looking within and across income level. Those making less than $25,000 reported the highest level of hesitancy in January at 28.3 percent, but have shown a marked reduction down to 17.5 percent in October. This has significantly closed the gap in hesitancy between this group and those at higher income levels. However, once again, changes within subgroups appear to have reached a stable level of hesitancy. Among those making $50,000-$74,999 this appears to be around 12.0 percent, while for those making $150,000 or more, this appears to be around 7.0 percent.
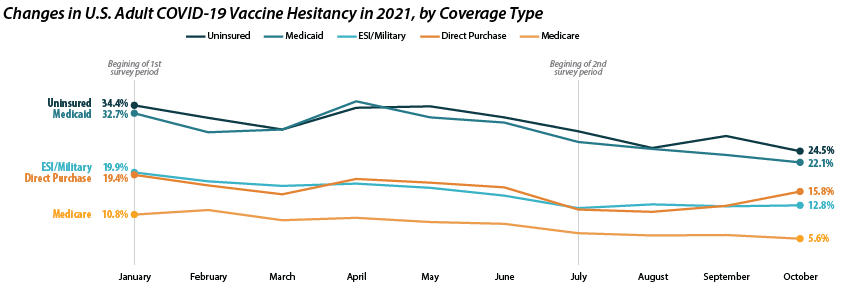
Patterns of reduced vaccine hesitancy followed by rate leveling continued to be true among groups with fewer connections to the health care system, as proxied by insurance status. Hesitancy rates have fallen generally across all insurance statuses; however, the uninsured and those with Medicaid coverage continue to have the highest rates of hesitancy, at 24.5 percent and 22.1 percent in October as compared to those with ESI/Military, Direct Purchase, or Medicare coverage.
Note: All changes and differences in this post are statistically significant at the 95% confidence level unless otherwise noted.
Related Reading
SHADAC Blog: Vaccine Hesitancy Decreased During the First Three Months of the Year: New Evidence from the Household Pulse Survey
SHADAC Blog Series: Measuring Coronavirus Impacts with the Census Bureau's New Household Pulse Survey: Utilizing the Data and Understanding the Methodology
i U.S. Census Bureau. (2021, November 3). 2021 Household Pulse Survey User Notes [Phase 3.2]. https://www2.census.gov/programs-surveys/demo/technical-documentation/hhp/Phase3-2_2021_Household_Pulse_Survey_User_Notes_11032021.pdf
ii This only includes primary series doses and excludes booster doses.
iii This percentage is higher than administratively reported COVID-19 vaccine receipt. The differences are due to both the inclusion of those who “Plan to receive all vaccine doses” and the known discrepancies between administrative and survey data.
iv The HPS allows those who are “Probably going to receive a vaccine” to report reasons for hesitancy; however, this group is not included in our definition of “hesitant.”


