It is increasingly clear that health is determined not just by biological and clinical factors but to a greater extent by socio-demographic factors. With this in mind, we need data for monitoring the social determinants of health just as we do for monitoring biological and clinical determinants. The U.S. Census Bureau recently released estimates from the 2016 National Survey of Children’s Health (NSCH), providing a data source that is ideal for precisely this purpose. The NSCH provides traditional measures of health status and access to care among children along with rich data on the social factors that determine health including family, neighborhood, school, and social context.
SHADAC is highlighting state-specific findings from the 2016 NCSH on measures that illustrate where states are closer to achieving a culture of health and where improvements can be made. As additional years of NCSH data are released, we will be able to monitor trends in these indicators to track progress in developing a culture of health over time.
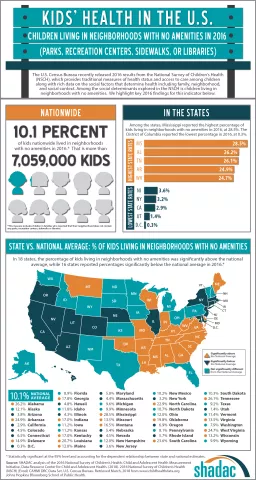
According to 2016 data from the NSCH, 10.1% of children nationwide (approximately 7,059,000 children) lived neighborhoods with no amenities in 2016, defined as a neighborhood without any parks, recreation centers, sidewalks, or libraries.
Among the states, the highest percentages of children living in neighborhoods with no amenities were found in Mississippi (28.5%), Alabama (26.2%), Tennessee (26.1%), Arkansas (24.9%), and West Virginia (24.7%). The lowest percentages were found in the District of Columbia (0.3%), Utah (1.4%), California (2.9%), New York (3.2%), and New Jersey (3.6%).
In all, 18 states were statistically above the national average of 10.1% of children living in neighborhoods with no amenities, and 16 were below the national average.[1]
Click on the infographic for additional state-level information about children living in neighborhoods with no amenities.
Additional Kids’ Health Data Highlights
Kids' Health in the U.S.: Difficulties Making or Keeping Friends in 2016
Kids' Health in the U.S.: Parental Attendance at Kids' Activities in 2016
Kids’ Health in the U.S.: Living in Supportive Neighborhoods in 2016
Kids’ Health in the U.S.: Living in Working Poor Households in 2016
Kids’ Health in the U.S.: Trouble Affording Nutritious Meals in 2016
More about the NSCH
The NSCH was administered three times prior to 2016 – in 2003, 2007, and 2011/12. However, the 2016 NSCH is different because it integrated the NSCH with the National Survey of Children with Special Health Care Needs (NS-CSHCN) and introduced a number of new survey items, establishing a new baseline. Going forward, the NSCH will be administered annually. The survey is administered online and via mail, and survey results are weighted to represent the population of non-institutionalized children ages 0-17 who live in housing units nationally and in each state.
The full 2016 NSCH public-use file (PUF) is available on the Census Bureau’s NSCH page.
[1] Statistically significant differences are calculated at the 95% level and account for the dependent relationship between state and national estimates.