SHADAC | State Health Access Data Assistance Center
CONNECT WITH US
VISIT STATE HEALTH COMPARE
  • ABOUT US
    Contact Us
    Featured Projects
    Our Team
  • OUR EXPERTISE
    State and Federal Health Policy
    Medicaid and CHIP Policy
    Delivery and Payment System Reform
    Health Coverage and Access to Care
    Health Care Cost and Affordability
    Health Equity
    Social Determinants
    Quantitative and Qualitative Evaluation
    Data Analytics and Visualization
    State and Federal Surveys
    Population Health
  • BLOG & NEWS
    SHADAC Blog
    Newsletter
    In the Media
    Social Media
  • PUBLICATIONS
    Reports & Briefs
    Journal Articles
    Presentations
    Infographics
    Emerging Research Topics
  • STATE PROFILES
  • ABOUT US
    Contact UsFeatured ProjectsOur Team
  • OUR EXPERTISE
    State and Federal Health PolicyMedicaid and CHIP PolicyDelivery and Payment System ReformHealth Coverage and Access to CareHealth Care Cost and AffordabilityHealth EquitySocial DeterminantsQuantitative and Qualitative EvaluationData Analytics and VisualizationState and Federal SurveysPopulation Health
  • BLOG & NEWS
    SHADAC BlogNewsletterIn the MediaSocial Media
  • PUBLICATIONS
    Reports & BriefsJournal ArticlesPresentationsInfographicsEmerging Research Topics
  • STATE PROFILES
ADVANCED SEARCH
DIG DEEPER
  • to
Search By Category
SHADAC | State Health Access Data Assistance Center
  • Search
  • View Menu
  • State Health Compare

Blog & News

Print
author
SHADAC Staff

p 612.624.4802
e shadac@umn.edu

facebook
twitter
linkedin
google plus

Kids' Health Data Highlight: Trouble Affording Nutritious Meals in 2016 (Infographic)

March 29, 2019:

It is increasingly clear that health is determined not just by biological and clinical factors but to a greater extent by socio-demographic factors. With this in mind, we need data for monitoring the social determinants of health just as we do for monitoring biological and clinical determinants. The U.S. Census Bureau recently released estimates from the 2016 National Survey of Children’s Health (NSCH), providing a data source that is ideal for precisely this purpose. The NSCH provides traditional measures of health status and access to care among children along with rich data on the social factors that determine health including family, neighborhood, school, and social context.

In the coming weeks, SHADAC is highlighting state-specific findings from the 2016 NCSH on measures that illustrate where states are closer to achieving a culture of health and where improvements can be made. As additional years of NCSH data are released, we will be able to monitor trends in these indicators to track progress in developing a culture of health over time.

Access to Nutritious Food

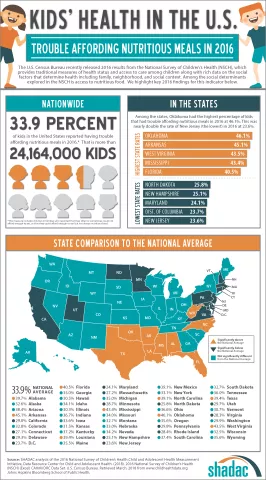
According to 2016 data from the NSCH, 33.9% of children nationwide (approximately 24,164,000 children) had trouble affording nutritious meals in 2016.[1]

The five states with the highest percentages of children who had trouble affording nutritious meals in 2016 were Oklahoma (46.1%), Arkansas (45.1%), West Virginia (43.5%), Mississippi (43.4%), and Florida (40.5%).

The five states with the lowest percentages of children who had trouble affording nutritious meals in 2016 were New Jersey (23.6%), the District of Columbia (23.7%), Maryland (24.1%), New Hampshire (25.1%), and North Dakota (25.8%).

In all, the percentage of children that had trouble affording nutritious meals was statistically below the national average in 14 states and statistically above the national average in nine states.

Click on the infographic for additional state-level information about children’s access to nutritious meals.

Additional Kids’ Health Data Highlights

Kids' Health in the U.S.: Difficulties Making or Keeping Friends in 2016

Kids' Health in the U.S.: Parental Attendance at Kids' Activities in 2016

Kids'Health in the U.S.: Living in Neighborhoods with No Amenities in 2016

Kids’ Health in the U.S.: Living in Supportive Neighborhoods in 2016

Kids’ Health in the U.S.: Living in Working Poor Households in 2016

More about the NSCH

The NSCH was administered three times prior to 2016 – in 2003, 2007, and 2011/12. However, the 2016 NSCH is different because it integrated the NSCH with the National Survey of Children with Special Health Care Needs (NS-CSHCN) and introduced a number of new survey items, establishing a new baseline. Going forward, the NSCH will be administered annually. The survey is administered online and via mail, and survey results are weighted to represent the population of non-institutionalized children ages 0-17 who live in housing units nationally and in each state.

The full 2016 NSCH public-use file (PUF) is available on the Census Bureau’s NSCH page


[1] This estimate includes children in families who reported that they often or sometimes could not afford enough to eat or that they could afford enough to eat but not always nutritious food.

facebook
twitter
linkedin
google plus
Health Insurance Coverage and the Uninsured
Robert Wood Johnson Foundation
University of Minnesota
The State Health Access Data Assistance Center (SHADAC) is a program of the Robert Wood Johnson Foundation and a part of the Health Policy and Management Division of the School of Public Health at the University of Minnesota.
©2002-2023 Regents of the University of Minnesota. All rights reserved. The University of Minnesota is an Equal Opportunity Employer.
  • Contact Us
  • Employment
  • Privacy Policy

Stay Up To Date

Join our mailing list to receive the SHADAC newsletter and news and events announcements from SHADAC.


SUBSCRIBE
  • SHADAC on Twitter
  • Email SHADAC
  • Contact Us
  • Employment
  • Privacy Policy