The cost of health care continues to grow nationwide, with U.S. health care spending reaching $3.5 trillion, or an average of $10,739 per person, in 2017.[1] As these expenditures have grown, the cost of health insurance has grown as well, such that Americans are increasingly enrolling in health plans with large deductibles and other cost sharing in order to avoid the expense of rising premiums. Rising enrollment in these health plans, combined with the ongoing problem of “surprise medical bills” (bills from providers who are out of network unbeknownst to consumers) across all plan types, has increased the health care cost burden for many Americans and has drawn increasing attention to the affordability of health care for consumers.[2]
Exploring Health Care Affordability at the State Level with State Health Compare
SHADAC’s State Health Compare includes a measure “Had Trouble Paying Medical Bills” that assesses changes and patterns in health care affordability across the country by tracking the percent of Americans that had difficulty paying off medical bills or that were paying off medical bills over time. The measure is available at both the state and national level for 2011-2016 and can be broken down by age and insurance coverage type.
This post highlights states that experienced changes in the percent of residents by age that had trouble paying medical bills between 2015 and 2016 and shows the substantial amount of variation across states on this measure.
Trouble paying medical bills among the states, 2015-2016: Some rate increases, no decreases
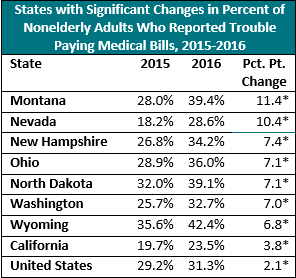
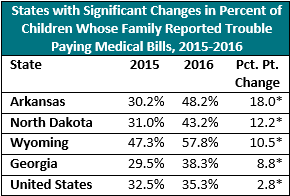
Nationally, the percent of nonelderly adults (age 19-64) reporting trouble paying medical bills increased from 29.2% in 2015 to 31.3% in 2016 (2.1 points). This pattern was mirrored among children (age 0-18), who experienced an increase of 2.8 points, from 32.5% in 2015 to 35.3% in 2016.
Eight states experienced statistically significant increases in the share of nonelderly adults reporting trouble paying medical bills between 2015 and 2016, as shown below. Montana had the largest increase at 11.4 points (from 28.0% in 2015 to 39.4% in 2016), followed by Nevada at 10.4 points (from 18.2% to 26.8%), and New Hampshire at 7.4 points (from 26.8% to 34.2%). No state experienced a statistically significant decrease in the percent of non-elderly adults reporting trouble paying medical bills.
Among children, four states saw significant increases in the share reporting trouble paying medical bills, also shown below. The largest of these increases was in Arkansas, which experienced a rise of 18.0 points from 30.2% to 48.2% between 2015 and 2016. No state saw a significant decrease in the percent of children whose family reported trouble paying medical bills.
Among elderly adults (65+), only Alabama and Montana experienced significant increases in the share reporting trouble paying medical bills. Those states saw increases of 8.4 and 7.1 percentage points, respectively. No state saw a significant decrease in the percent of elderly adults reporting trouble paying medical bills.
2016: Large variation across states in percent with trouble paying medical bills
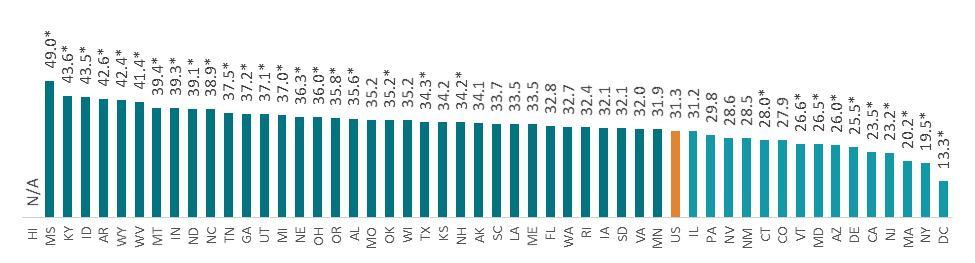
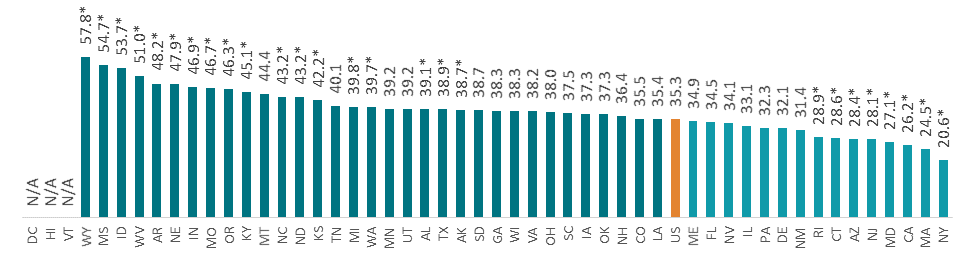
As shown below, there was substantial variation across states in 2016 in the percent that had trouble paying medical bills among nonelderly adults, children, and elderly adults. In general, states with median incomes registering below the national median[3] tend to have higher shares of residents reporting trouble paying medical bills, regardless of age group, and vice versa.
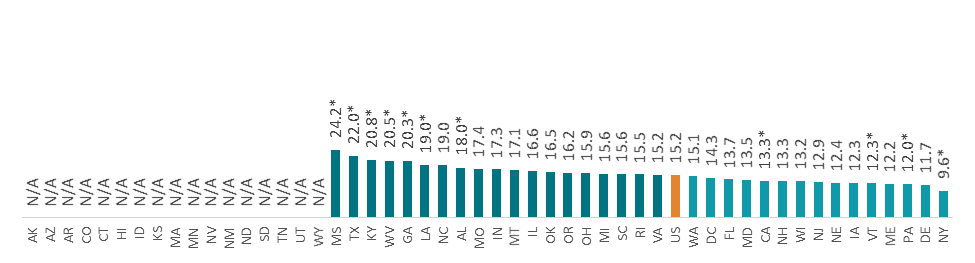
The percent of nonelderly adults who had trouble paying medical bills ranged from 13.3% in the District of Columbia to 49.0% in Mississippi (a difference of 35.7 points); the percent of children in families that had trouble paying medical bills ranged from 20.6% in New York to 57.8% in Wyoming (a difference of 37.2 points); and the percent of elderly adults who had trouble paying medical bills ranged from 9.6% in New York to 24.2% in Mississippi (a difference of 14.6 points).
Percent That Had Trouble Paying Medical Bills by State, 2016
Nonelderly Adults (Age 19-64)
Children (Age 0-18)
Elderly Adults (Age 65+)
Notes and Definitions
“Had Trouble Paying Medical Bills” is defined as the rate of individuals that had trouble paying off medical bills during past twelve months or were currently paying off medical bills among the civilian non-institutionalized population.
The source of the estimates is SHADAC analysis of NHIS data, National Center for Health Statistics (NCHS). The NHIS sample is drawn from the Integrated Health Interview Survey (IHIS, MN Population Center and SHADAC). Data were analyzed at the University of Minnesota's Census Research Data Center because state identifiers were needed to produce results and these variables were restricted.
Estimates were created using the NHIS survey weights, which are calibrated to the total U.S. Civilian non-institutionalized population for estimates broken down by age, and to the civilian non-institutionalized population age 18 to 64 for estimates broken down by coverage type.
Though SHADAC goes to great effort to produce as many state-level estimates as possible for our measures, due to sample size restrictions many state estimates of this measure are suppressed when broken down by subgroup. Namely, estimates are suppressed if the number of sample cases was too small or the estimate had a relative standard error greater than 30 percent.
Other State Health Compare estimates that use data from the NHIS
Had Trouble Paying Medical Bills is one of eight State Health Compare measures that SHADAC produces using data from the NHIS listed below. State Health Compare is the only source for state-level estimates of these measures.
- Made Changes to Medical Drugs
- Trouble Paying Medical Bills
- No Trouble Finding Doctor
- Told that Provider Accepts Insurance
- Had Usual Source of Medical Care
- Had General Doctor or Provider Visit
- Had Emergency Department Visit
- Spent the Night in a Hospital
[1] Centers for Medicaid & Medicaid Services (CMS). 2018. National Health Expenditure Data: Historical. Retrieved from https://www.cms.gov/research-statistics-data-and-systems/statistics-trends-and-reports/nationalhealthexpenddata/nationalhealthaccountshistorical.html
[2] Pollitz, K. (2016, March 17). Surprise Medical Bills. Kaiser Family Foundation. Retrieved from https://www.kff.org/private-insurance/issue-brief/surprise-medical-bills/
[3] See U.S. Census Bureau, Table S1903. Median Income in the Past 12 Months (In 2016 Inflation-Adjusted Dollars): 2016 American Community Survey 1-Year Estimates. Retrieved from https://factfinder.census.gov/bkmk/table/1.0/en/ACS/16_1YR/S1903/010000…|0100000US.04000
* Difference from the U.S. significant at the 95% confidence level
N/A indicates that data were suppressed because the number of sample cases was too small or the estimate had a relative standard error greater than 30%
Universe: Civilian non-institutionalized population
Source: SHADAC analysis of the National Health Interview Survey (NHIS) data, National Center for Health Statistics (NCHS)