As states have urgently strategized responses to the sudden arrival of the initial wave of the coronavirus pandemic and begun to prepare for the possibility of a second wave in the fall, states’ per-capita public health funding is a metric that has garnered new attention. Estimates for this measure not only reveal a state’s prioritization of investment in public health infrastructure, but also levels of preparedness for health emergencies such as COVID-19. With this understanding, a number of media outlets have used the public health spending rankings chart provided by SHADAC’s State Health Compare to publish articles which highlight the challenges that states on the lower end of the public health spending spectrum now face in attempting to respond to the COVID-19 crisis.
In light of this information, and with the release of the latest estimates for public health spending for 2019, SHADAC has just recently updated our brief on estimates of state-provided funding for the State Health Compare measure, “Public Health Funding.” Though this updated brief highlights state public health funding data from 2015–2019, data is available on the State Health Compare website for every year, starting in 2005 (with the exception of data year 2006 for which no estimates are available).
The Big Picture: Wide Variation between States
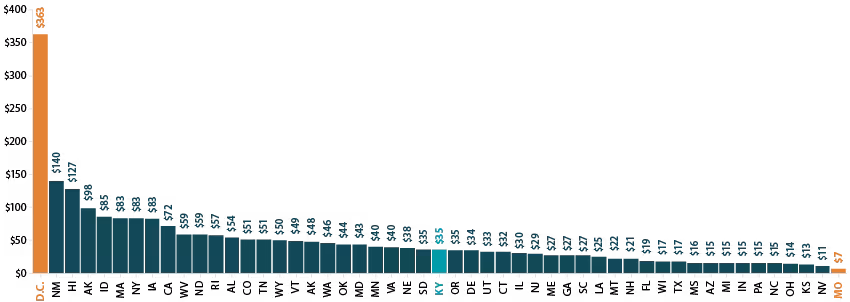
There is a wide gap between state public health funding among states, with 2019 state-provided funding ranging from $7 per capita in Missouri to $363 per capita in the District of Columbia (D.C.). In 2019, the median state, Kentucky spent $35 per capita in public health funding.
Per Person Public Health Funding, 2019
Top States for State Public Health Funding
Eight states occupied the top five funding spots over the course of five years, from 2015 through 2019 (the most recent five years for which data are available): Alaska, D.C., Hawaii, Idaho, New Mexico, New York, North Dakota, and West Virginia. Alaska, D.C., and Hawaii were among the top five states for each of the five years. In 2019, the top five states for per-capita state public health funding were Alaska, D.C., Hawaii, Idaho, and New Mexico.
Bottom States for Public Health Funding
Eight states also occupied the bottom five funding spots at various times over the five-year period (2015 through 2019). Arizona, Indiana, Kansas, Mississippi, Missouri, Nevada, North Carolina, and Ohio moved among the bottom five positions for state-provided public health funding during this time period. Both Missouri and Nevada consistently ranked among the bottom five states for each year of this period. In 2019, the bottom five states with regard to public health spending were: Kansas, Missouri, Nevada, North Carolina, and Ohio.
About the Estimates
Estimates of state funding for public health come from data collected by Trust for America's Health (TFAH), which obtains its calculations using budget documents that are publicly available through state government websites. Depending on which information is available, TFAH uses executive budget documents listing actual expenditures, estimated expenditures, or final appropriates; appropriations bills enacted by the state's legislature; and documents from legislative analysis offices to calculate public health spending. TFAH defines "public health" broadly to include most state-level health funding with the exception of Medicaid, CHIP, or comparable health coverage programs. SHADAC standardizes these estimates of state public health funding to the estimated population of each state to create per-capita estimates.
Why the Variation among States on this Measure?
According to Trust for America's Health, comparisons of public health funding levels across states are difficult because every state allocates and reports its budget in different ways, and states vary widely in the budget details they provide. Non-methodological sources of inter-state variation in state public health funding may also include the relative performance of individual state economies (since state public health funding is often cut during economic downturns) as well as the relative tax bases of individual states along with state population counts.
Explore Additional Public Health Data at State Health Compare
Visit State Health Compare to explore national and state-level estimates for the following public health indicators:
- Weight Assessment in Schools
- School Nutrition Standards Stronger than USDA
- School Required to Provide Physical Activity
- Smoke Free Campuses
- Cigarette Tax Rates
State Health Compare also features a number of other indicator categories, including: health insurance coverage, cost of care, access to and utilization of care, care quality, health behaviors, health outcomes, and social determinants of health.