Resource: Minnesota’s Community and Uninsured Profile
The Minnesota Community and Uninsured Profile is a resource for health insurance navigators, policymakers, researchers, and the public to explore various characteristics of the uninsured in Minnesota and to inform outreach and action. The concept for this profile was originally developed as part of “Minnesota’s Uninsured and the Communities in Which They Live,” a project funded by the Blue Cross and Blue Shield of Minnesota Foundation.
With continued Foundation support, SHADAC is releasing its seventh update of the profile.
Minnesota Community and Uninsured Profile (2020–2024) *UPDATED DATA*
This updated profile provides rates and counts of Minnesotans at the ZIP Code (i.e., Census-defined ZIP Code), county, economic development region (EDR), MNSure rating area, legislative district (senate and house), and state level using the latest estimates (2024) from the United States Census Bureau's American Community Survey (ACS). The profile features characteristics of the total population and uninsured population within a select community. Characteristics include: demographics, educational attainment, employment status, among others. The profile also includes other community characteristics that can influence access to health insurance and health, such as industry type, household type, internet use, and more.
A unique feature of the profile is a Minnesota-specific, 2024 version of the Center for Disease Control’s (CDC) Social Vulnerability Index (SVI), which based on the CDC’s 2020 methodology. Social vulnerability refers to demographic and/or socioeconomic factors (such as poverty, employment/transportation/housing access, household characteristics, etc.) that suggest a community may need support to better prepare for, respond to, and recover from public health crises; SVI is a place-based measure meant to identify and quantify communities experiencing social vulnerability on a scale that ranges from “Least Vulnerability” to “Most Vulnerability” allowing for quick understanding of vulnerability as well as the ability to compare between communities and over time.
Download and explore the profile here or by clicking on the 'Download' button below.

The Excel workbook includes six tabs:
- Purpose: Describes the purpose of the profile and includes an acknowledgement to the funder and the groups who informed the original design.
- How to Use: Describes how to identify a community of interest and explore data on the uninsured and the community within the profile.
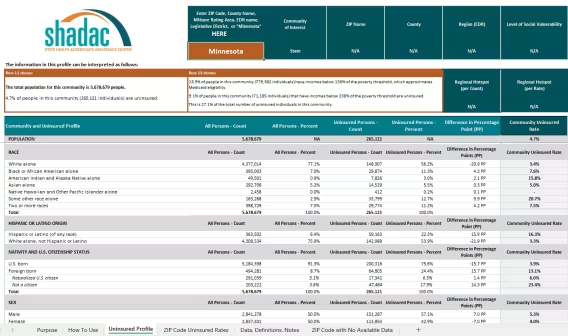
- Community and Uninsured Profile: Profile of the characteristics of the uninsured and the community in which they live at the ZIP Code, county, MNsure rating area, economic development region (EDR), or state level. It also includes regional hotspot status, defined as areas with the highest count or rate of uninsured. As mentioned above, the profile features the level of social vulnerability associated with the ZIP Code.
- ZIP Code Uninsured Rates: Sortable spreadsheet including all the reported Census-defined ZIP Codes, counties, and regions, the number and percent of uninsured within those communities, as well as the regional hotspot status and level of social vulnerability.
- Data, Definitions, and Notes: Provides all the definitions for the profile tab as well as the data source and notes.
- ZIP Code with No Available Data: Sortable spreadsheet including all of the reported Census-defined ZIP Codes that were suppressed if the total number of uninsured for that area was less than 50 or the relative standard error (standard error/estimate) for that area was greater than 30%. While we want to be able to provide data for all ZIP Codes in the state, suppressing when there is not enough total data or the data’s standard error is high both helps to reduce any misinterpretation and works to protect individuals’ privacy.
Community and Uninsured Profile Video Tutorial
This video was produced with a previous iteration of this resource and provides a tour of that version of the Community and Uninsured Profile.
Interactive Map of Minnesota: Visualize Uninsurance Data, Social Vulnerability Index (SVI), and More
We have also created an interactive map designed to be used alongside the profile. This map allows users to view uninsurance data in Minnesota by ZIP code easily and visually. Clicking on one of the regions will reveal a pop-up with more details about that area, including the ZIP code, its total population, number and rate of uninsured, and more (see images below).
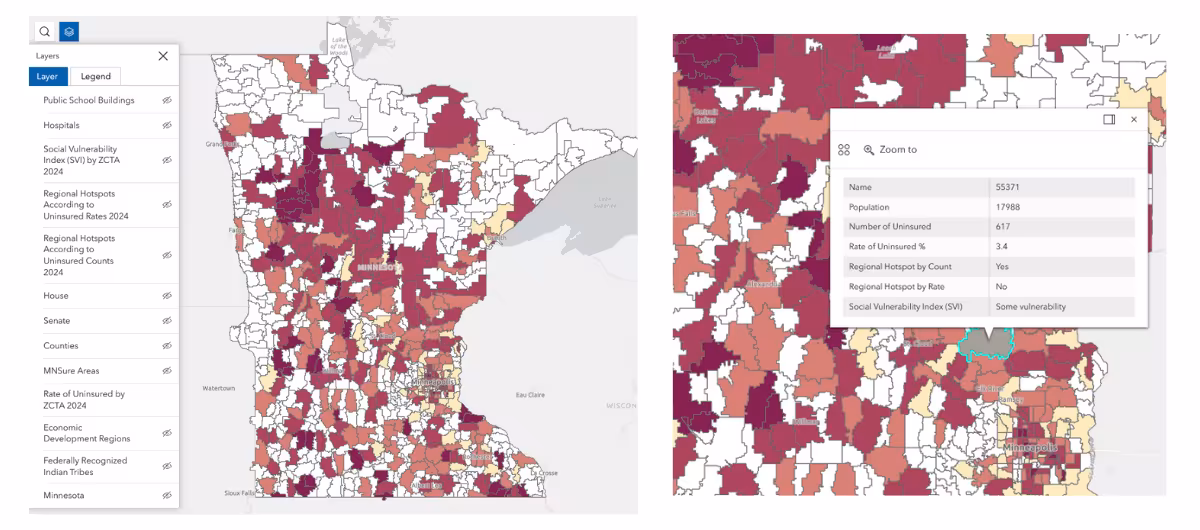
The map also has layers that can display social vulnerability index (SVI) by ZIP code, regional hotspots, MNSure areas, the location of public school buildings and hospitals, and more.
Click here to start exploring the interactive map.
We would greatly appreciate your feedback on the community and uninsured profile. Share your suggestions with us here.