
Cost and affordability of health care are understandably at the forefront of consumer concerns as studies show rising health care spending across the nation. SHADAC’s work on these subjects ranges from studies involving primary data collection to assess costs of care, such as care coordination costs; to secondary data analyses of individuals who forgo needed medical care or make changes to prescription drugs due to cost; and of increasing premiums and deductibles in our annual employer-sponsored insurance report. SHADAC staff have also modeled the projected use and cost of Medicaid spending on long-term services and supports for Medicaid enrollees.
Blog & News


State and Federal Relief Prevented Deep Backslide in Health Care Affordability in California in 2020 (CHCF Cross Post)
May 18, 2022:The following content is cross-posted from California Health Care Foundation. It was first published on May 18, 2022.
Author: Colin Planalp, Research Fellow, SHADAC
 In 2020, the start of the COVID-19 pandemic meant the imposition of incredible burdens on every corner of US society, particularly the health care system and the people it serves. There were well-founded fears that the pandemic, and the concurrent economic crisis, could make health insurance and health care unaffordable for even more people — already a long-standing problem in California.
In response to the pandemic, the US government enacted historic relief programs, including multiple instances of direct cash payments to a majority of US families. Those federal policies coincided with California health insurance reforms that, while developed before the pandemic, were implemented in 2020.
This analysis of the California Health Insurance Survey (CHIS) shows that Californians were largely protected from experiencing a major erosion in their ability to pay for health insurance and care. Despite this overall positive finding, the 2020 CHIS data on health care affordability continued to demonstrate clear inequities by income and race/ethnicity.
Key Findings
California’s uninsured rate declines, yet cost remains top reason for lacking health insurance. The rate of Californians under 65 without health insurance reached a historic low of 7.0% in 2020. However, 51.9% of uninsured people said they lacked coverage because it was too expensive.
Rate of going without needed care due to cost dropped in 2020. Among the 8.6% of Californians who reported forgoing needed medical care in 2020, 32.0% said it was concerns about the cost that caused them to go without care. That rate was significantly lower than the rate of 43.6% in 2019.
Fewer Californians reported difficulty paying medical bills. From 2019 to 2020, the rate of Californians reporting that they’ve had trouble paying medical bills in the past year declined significantly, from 13.3% to 11.1%. However, when breaking out the data by income, only those with higher incomes saw statistically significant improvement. Californians with lower incomes — 200% to 299% of federal poverty guidelines (FPG), 100% to 199% FPG, and below 100% FPG — reported no significant changes.
Less trouble affording necessities due to medical bills in 2020. In 2020, the rate of Californians who reported having trouble paying for basic necessities (such as food or clothing) because of medical bills declined significantly to 31.0% from 39.8% in 2019. Rates of trouble paying for necessities due to medical bills also declined across most income levels.
Practice of using credit card debt to finance medical bills declined. In 2020, the rate of Californians who reported taking on credit card debt to finance medical bills declined significantly, from 56.5% in 2019 to 44.3%. That finding held consistent for Californians across income levels — except for those with the lowest incomes.
Racial and ethnic disparities persisted in 2020. Although California experienced significant improvements in some measures of health care and insurance affordability in 2020, certain long-standing inequities persisted. For example, Black people reported the highest rate of trouble paying medical bills in 2020, at 14.0%, followed closely by Latinos/x, at 12.7%. Asians, Black people, and Latinos/x also reported similarly high rates of trouble paying for necessities due to medical bills (39.4%, 36.2%, and 33.1%, respectively).
Together, these findings provide some encouraging news. In a year of massive economic upheaval that would typically have caused serious financial problems for many Californians, they instead reported improvements in health care and insurance affordability. However, improvements were likely due, at least in part, to federal programs that were mostly designed to be temporary. Some have already expired. Additionally, the historically high inflation of 2021 and 2022 have since strained people’s finances.
But the fact that California experienced such measurable improvements in health insurance and health care affordability during a broad and deep recession shows that those problems don’t have to be intractable. In the future, it will be key to monitor these measures as policymakers in California and at the federal level consider initiatives to protect people against unaffordable health care and insurance costs, which remain a long-term challenge.
SHADAC Expertise
Health Care Cost and Affordability
Health care cost and affordable health care are understandably at the forefront of consumer concerns as studies show rising health care spending across the nation. For over a decade, SHADAC has monitored and produced reports on health care cost and affordability trends through primary data collection and secondary data analysis. SHADAC’s work on these subjects ranges from studies involving primary data collection to assess costs of care, such as care coordination costs; to secondary data analyses of individuals who forgo needed medical care or make changes to prescription drugs due to cost; and of increasing premiums and deductibles in our annual employer-sponsored insurance report. SHADAC staff have also modeled the projected use and cost of Medicaid spending on long-term services and supports for Medicaid enrollees.
Related SHADAC Work:
Click on any title below to learn more about the project.
 Affordability and Access to Care: Examining Inequities Across the United States
Various SHADAC analyses examine Americans’ health care costs, access to care, and ability to afford medical care. Many of our analyses explore inequities related to race/ethnicity and education, often using measures from SHADAC’s State Health Compare, including: Adults Who Forgo Needed Medical Care, Health Insurance Coverage by Type, and Adults with No Personal Doctor. The graphic to the right, featured in one of our analyses using 2018 BRFSS data, explored inequities in health care cost and access based on race/ethnicity and education. In one of our latest publications on the topic of health care cost and affordable health care, researchers analyze Forgone Care by Coverage Type, which revealed that 63% of adults without health coverage reported forgone care while no more than 14% of those with coverage reported forgone care. Find the full analysis here; explore this and other data on State Health Compare.
State and Federal Relief Prevented Deep Backslide in Health Care Affordability in California in 2020
There were well-founded fears that the pandemic, and the concurrent economic crisis, could make health insurance and health care unaffordable for even more people — already a long-standing problem in California. This analysis of the California Health Insurance Survey (CHIS) shows that Californians were largely protected from experiencing a major erosion in their ability to pay for health insurance and care. Despite this overall positive finding, the 2020 CHIS data on health care affordability continue to demonstrate clear inequities by income and race/ethnicity.
Employer-Sponsored Insurance: A National-Level Look at Cost and Coverage Rates
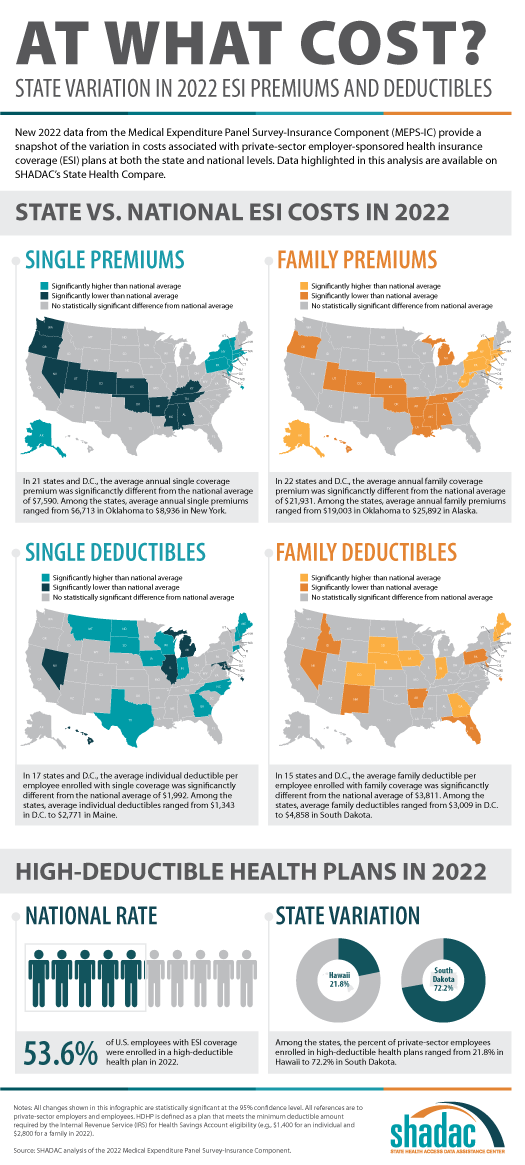
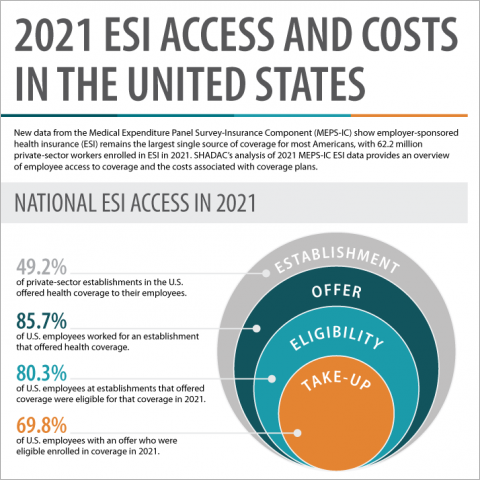 Throughout the United States, a majority of Americans and their families receive health insurance coverage through their employer. In 2021, the number of individuals enrolled in this type of coverage – known as employer-sponsored insurance or ESI – exceeded 62.2 million. In this blog, infographic, and companion documents, SHADAC researchers use data from the Medical Expenditure Panel Survey-Insurance Component (MEPS-IC) to analyze the private-sector ESI landscape in 2021 on a national level and within the states. We used the following year's data from the same source and compared 2022 vs 2021 in terms of employee access to coverage, health care cost for employees, and more in this blog and accompanying infographic.
Past Work
2018 State-Level Estimates of Medical Out-of-Pocket Spending for Individuals with Employer-Sponsored Insurance Coverage
As part of SHADAC’s work monitoring trends in coverage, access, and affordability, this brief highlights the affordability of coverage for those with employer-sponsored health insurance (ESI). Using data from the Current Population Survey (CPS), SHADAC estimated family out-of-pocket costs for people with employer coverage across all 50 states and the District of Columbia (D.C.). Additional analysis looked at family median out-of-pocket costs by state and estimated the high medical cost burden where family out-of-pocket spending is greater than 10% of household income.
Minnesota Health Care Home Care Coordination Cost Study
The Minnesota Department of Human Services and Health contracted with SHADAC to conduct a study of the costs of Health Care Home care coordination for adults. In order to estimate the cost of care coordination, SHADAC used a case study approach and developed a list of activities (or “ingredients”) that define care coordination and collected information about the costs associated with each of these activities at six non-acute, primary care clinics.
Blog & News

Affordability and Access to Care in 2018: Examining Racial and Educational Inequities across the United States (Infographic)
December 17, 2019: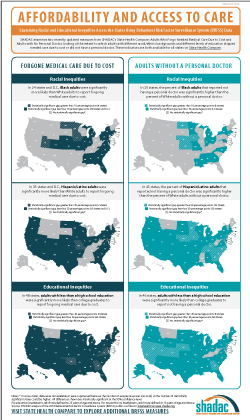 The Centers for Medicare and Medicaid Services (CMS) recently reported that the cost of health care spending in the United States increased by 4.6 percent last year to reach an all-time high of approximately $3.6 trillion.1 This report comes amidst a number of other concerning health care cost-related trends, such as the largest single-year increase for single-coverage premiums in 2018 from $6,368 to $6,715 (5.4 percent) for workers enrolled in employer-sponsored insurance (ESI) and an increase in average household spending on health care (out of pocket expenses, cost-sharing for ESI, and payroll taxes for Medicare, etc.) rising to a record $1.04 trillion.2
Rising expenses such as these have contributed to the record number of Americans (25 percent) who reported in 2019 that either themselves or a family member skipped or delayed needed medical care due to cost, according to the results from a new Gallup poll released earlier this month.3
This post examines Americans’ access and ability to afford medical care, focusing on inequities related to race/ethnicity and education, and using two recently updated measures from SHADAC’s State Health Compare: Adults Who Forgo Needed Medical Care and Adults with No Personal Doctor. These measures come from a SHADAC analysis of 2018 data from the CDC’s Behavioral Risk Factor Surveillance System (BRFSS).
Racial and educational inequities persist in adults’ reported ability to afford needed medical care
Significant inequities in adults’ ability to afford medical care by race/ethnicity emerged when we examined the updated data for 2018. At the national level, our analysis showed that Hispanic/Latino adults were nearly twice as likely as White adults to forgo needed medical care due to cost (20.2 percent versus 10.5 percent), and African Americans/Black adults were 1.5 times as likely to report forgoing care compared to White adults (16.0 percent versus 10.5 percent). Hispanic/Latino adults were also significantly more likely to report forgoing medical care than White adults in 35 states and D.C., and this gap was greater than 20 percentage points in Maryland (31.4 percent versus 7.4 percent) and Missouri (34.4 percent versus 11.1 percent). Black adults were significantly more likely to report going without care than White adults in 24 states and D.C., and this gap was greater than 10 percentage points in four states: Iowa (16.2 percentage points), North Dakota (15.5 percentage points), Utah (11.5 percentage points), and Minnesota (10.2 percentage points).
Nationwide, Americans with less than a high school degree were almost three times as likely to report going without needed medical care due to cost as compared to those with a bachelor’s degree (21.1 percent versus 7.4 percent) in 2018. Adults with less than a high school education were significantly more likely to report forgone care due to cost compared to adults with college degrees in 2018 in all but two states—Montana and Vermont—and in the District of Columbia (D.C.). For four states this gap was greater than 20 percentage points in 2018—Georgia (21.1 percentage points), Maryland (20.9 percentage points), Oklahoma (21.2 percentage points), and Virginia (21.2 percentage points).*
Racial/ethnic minorities and adults without a high school diploma less likely to have a personal doctor
Nationally, Hispanic/Latino and Black adults were both significantly more likely to report not having a regular doctor as compared to their White counterparts. Our analysis revealed that Hispanic/Latino adults were more than twice as likely as White adults to report not having a personal doctor (38.8 percent versus 18.4 percent), and Black adults were nearly 25 percent more likely to report not having a personal doctor compared with White adults (22.8 percent versus 18.4 percent).*
These inequities in access to care by race/ethnicity were present in a large majority of states. A significant gap between Hispanic/Latino and White adults with no personal doctor was present in 43 states, and Hispanic adults were more than three times as likely to report not having a personal doctor in five states (Connecticut, Maryland, Nebraska, New Jersey, and North Carolina). This significant gap also persisted between Black and White adults in 20 states, as we found that Black adults were more than twice as likely to not have a personal doctor in three states—Connecticut (22.8 percent versus 10.8 percent), Iowa (31.2 percent versus 15.1 percent), and Rhode Island (21.2 percent versus 9.9 percent).*
Nationally, adults with less than a high school degree were more than twice as likely to not have a regular doctor as those with an undergraduate degree or greater (32.4 percent versus 15.7 percent). This pattern was consistent across nearly the entire nation, as adults with less than a high school education were significantly more likely than college graduates to report not having a personal doctor in 46 states. The gap between less than high school graduates and college graduates was larger than 20 percentage points in eight states (California, Colorado, Georgia, Maryland, Nebraska, Nevada, New Jersey, and Utah).
Note
* Data were not available or were suppressed for some states because the number of sample cases was too small, so this number could be higher if data were available in all states. For education breakdowns, adults are defined as 25 years of age and above. For race/ethnicity breakdowns, adults are defined as 18 years of age and above. All differences are statistically significant at the 95% level.
Explore Additional BRFSS Data at State Health Compare
Visit State Health Compare to explore national and state-level estimates for the following measures that also come from the BRFSS:
Income Inequality
Sales of Opioid Painkillers
Adult Cancer Screenings
Chronic Disease Prevalence
Activities Limited due to Health Difficulty
Adult Obesity
Adult Binge Drinking
Adult Smoking
Adult E-Cigarette Use (New Measure)
State Health Compare also features a number of other indicator categories, including: health insurance coverage, cost of care, access to and utilization of care, care quality, health behaviors, health outcomes, and social determinants of health.
Related Reading
Now Available on State Health Compare: Eleven Updated Measures and One Brand New Measure
Educational Attainment and Access to Health Care: 50-State Analysis
Fifty-State Analysis Finds Lower Access to Care among Adults with Less Education
[1] Hartman, M., Martin, A.B., Benson, J., & Catlin, A. (2019, December 5). National Health Care Spending in 2018: Growth Driven by Accelerations in Medicare and Private Insurance Spending. HealthAffairs. [E-published ahead of print.] https://doi.org/10.1377/hlthaff.2019.01451
[2] State Health Access Data Assistance Center (SHADAC). (2019, August 14). State-level Trends in Employer-Sponsored Health Insurance, 2014-2018. Retrieved from https://www.shadac.org/ESIReport2019
Murad, Y. (2019, December 5). U.S Health Spending Rose to $3.6 Trillion in 2018, Propelled by Health Insurance Tax. Morning Consult. Retrieved from https://morningconsult.com/2019/12/05/u-s-health-spending-rose-to-3-6-trillion-in-2018-propelled-by-health-insurance-tax/
[3] Saad, L. (2019, December 9, 2019). More Americans Delaying Medical Treatment Due to Cost. Retrieved from https://news.gallup.com/poll/269138/americans-delaying-medical-treatment-due-cost.aspx

