
Blog & News


2018 ACS: Private Coverage Changes Split Evenly among States, Public Coverage Changes Experience Greater Variability than in 2017
September 26, 2019:The U.S. Census Bureau released partial state files for the 2018 American Community Survey (ACS) today, which included state-level information about health insurance coverage by coverage type.
The State Story
The overall national decrease in insurance coverage in 2018 (from 91.3% in 2017 to 91.1% last year) was mirrored by significant overall coverage decreases in eight states, although three states did see significant increases in coverage. There was variation among states in the extent to which there were changes in rates of public and private coverage in particular, and in whether these changes represented increases or decreases.
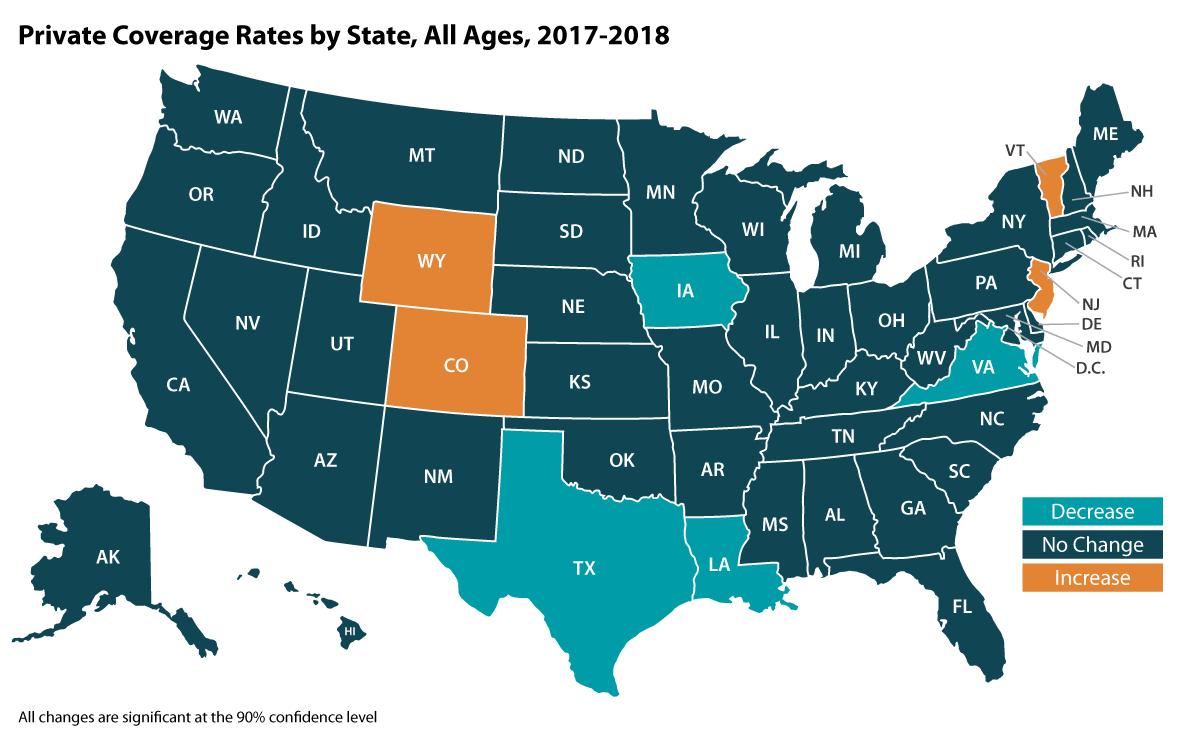
Private Coverage Rates by State, All Ages, 2017-2018: As Many States (Four) Saw Increases as Saw Decreases (Four)
- Four states (Colorado, New Hampshire, Vermont, and Wyoming) experienced significant increases in private coverage rates in 2018, echoing a similar trend in 2017, when private coverage increased significantly in just three states. Vermont saw the largest increase in private coverage from 2017 to 2018, growing by 3.4 percentage points, from 66.5% to 69.9%.
- Private coverage decreased significantly also in just four states from 2017 to 2018 (Iowa, Louisiana, Texas, and Virginia), a decrease from 2017, when ten states experienced significant decreases in private coverage. Louisiana saw the largest 2018 decrease in private coverage, with its rate falling 1.2 percentage points, from 60.3% to 59.1%.
- 42 states (including D.C.) experienced no significant change in rates of private coverage from 2017 to 2018.[1]
Public Coverage Rates by State, All Ages, 2017-2018: 11 States Saw Increases while Two States Saw Decreases
- There were more changes in public coverage rates than private coverage rates in 2018. Thirteen states saw significant changes from 2017 to 2018, as public coverage increased significantly in 11 states (Georgia, Iowa, Louisiana, Maine, Maryland, Michigan, Montana, Nebraska, Pennsylvania, South Carolina, and Virginia), and decreased significantly in two states (Alabama and Vermont). There were more state increases between 2017 and 2018 (11 states) than between 2016 and 2017 (eight states), and there were fewer state decreases between 2017 and 2018 (two states) than between 2016 and 2017 (four states).
- Louisiana saw the largest percentage-point increase (1.8 percentage points) in public coverage in 2018, rising from 42.6% to 44.4%.
- Vermont had the largest drop in public coverage, decreasing 3.6 percentage points from 44.4% to 40.6%.
- 37 states (including D.C.) saw no change in public coverage rates in 2018.[1]
Access the 2018 ACS 1-year tables here.
More to Come
This year’s data release of health insurance coverage estimates from the Current Population Survey (CPS) and American Community Survey (ACS) has been staggered, with nationwide uninsurance data from the CPS and ACS released on September 10th, estimates by coverage type at the national and state level released today, September 26th, and further state-level breakdowns by age, race/ethnicity, education level, and more, will be available next month on October 17th. Stay tuned for more granular details about insurance coverage changes in the states from 2017 to 2018 via customized SHADAC tables examining coverage at the state and county level.
Related Reading
Census Bureau Experts Will Share Insights during October 1st Webinar
At noon on Tuesday, October 1st, SHADAC will host a webinar to examine the new 2018 ACS and CPS estimates, with technical insight provided by researchers from SHADAC and from the U.S. Census Bureau, which administers both surveys.
Speakers will discuss the new 2018 national and state estimates, and attendees will learn:
- When to use which estimates from which survey
- How to access the estimates via Census reports and the new dissemination site: data.census.gov (replacing the now-retired American FactFinder)
- How to access state-level estimates from the ACS using SHADAC tables
Attendees will have an opportunity to ask questions after the speaker presentations.
Notes
All changes described in this document are significant at the 90% level. All estimates are for all ages. Private coverage includes individually purchased and employer-sponsored coverage.
[1] Estimates in both private and public coverage were not available for Delaware in 2017, so this state has not been counted in any category as there is no way to measure a year-over-year change.

