The Opioid Epidemic in the United States
For over two decades, the United States has experienced a crisis of substance abuse and addiction that is illustrated most starkly by the rise in deaths from drug overdoses. Since the year 2000, over 1 million people died from drug overdoses in the United States.[1] The annual number of drug deaths exceeded 100,000 for the first time in 2021, beginning a disturbing trend that has continued in both 2022 and 2023.[2],[3],[4] The annual overdose death rate from any kind of drug in the U.S. has more than tripled from 8.9 to 31.3 deaths per 100,000 people from 2003 to 2023.[5]
Despite an apparent plateau in drug overdose deaths more recently, 2023 was still the third year in a row with over 30 drug overdose deaths per 100,000 people and had the third highest number of drug deaths in a single year in the U.S. (behind only 2021 and 2022).
The vast majority of these deaths—about 80,000—involved opioids.[6] This includes deaths involving a number of different types of opioids, like prescription painkillers, heroin, and, most prevalently in recent years, synthetic opioids such as fentanyl. Fentanyl and related synthetic opioids alone accounted for roughly 22.2 deaths per 100,000 in 2023.[4],[5] Additionally, SHADAC research using 2022 data found that the majority of methamphetamine, cocaine, and prescription opioid overdose deaths involved fentanyl or similar synthetic opioids. “Not only has fentanyl become the dominant substance driving today’s crisis of drug overdose deaths, but it has also become the center of gravity around which other drugs orbit,” says SHADAC senior researcher Colin Planalp.[1]
For the past 10 years, SHADAC researchers have been tracking trends such as these in the ongoing U.S. opioid crisis. Our goal is to make data and analysis available to state policymakers and anyone who helps to influence the policymaking process—including researchers, journalists, and the public—so they can understand the nuances of the opioid epidemic in individual states and can develop evidence-based, tailored solutions to address the issues. Our researchers have developed a number of resources in a variety of formats, including blogs, briefs, infographics, webinars, interactive maps, and state-level data sets for researchers interested in exploring drug and/or opioid data or conducting further analysis. Find these, along with a brief history of the opioid epidemic, below.
History and Background of the Opioid Epidemic
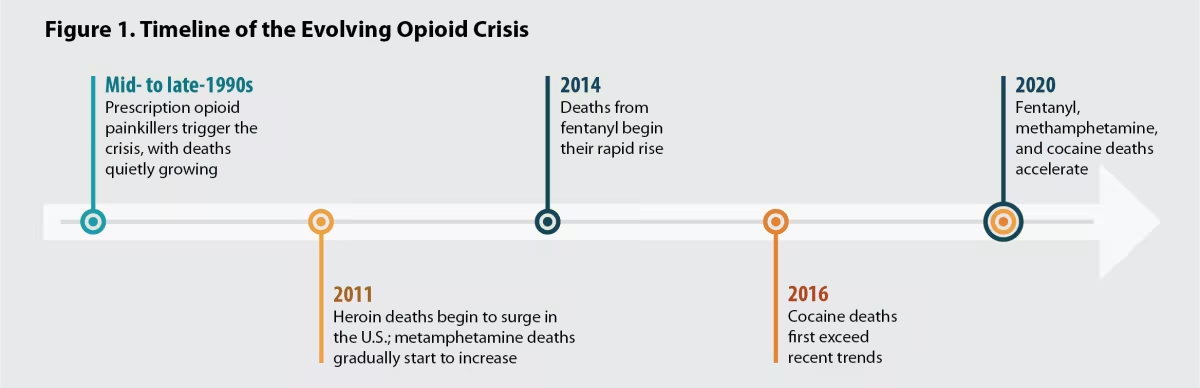
The opioid crisis is widely considered to have its roots in the mid-to late-1990s, when a confluence of factors—including the beginning of the “Pain as the 5th Vital Sign” campaign and the U.S. Food and Drug Administration’s approval of Purdue Pharma’s blockbuster OxyContin—led the U.S. health care system to greatly increase prescribing of opioid painkillers.[7]
For more than a decade, the steadily increasing rate of overdose deaths involving prescription opioids continued with little notice. But that changed around 2011 when the CDC declared deaths from prescription painkillers an “epidemic.” In the years that followed, the U.S. health care and public health systems took steps to rein in prescribing of opioid painkillers. The CDC developed guidelines aimed at reducing risky prescribing patterns, and many states implemented legal restrictions in addition to the voluntary, well-meaning attempts made by many health care providers to be more cautious in prescribing opioid painkillers. The leveling-off of prescription opioid overdose deaths after 2011 suggest some degree of success, though it was limited, and rates never declined in any large or durable way.
Around the same time that prescription opioid deaths peaked, data on drug overdose deaths show that the opioid crisis made a distinct shift. Deaths began to climb first from heroin, an illegal opioid that has been trafficked for decades by criminal enterprises, then from fentanyl and similar synthetic opioids that criminal enterprises also began to traffic. Heroin rose in popularity as individuals who were addicted to prescription opioids suddenly found themselves cut off from a substance on which they had become chemically dependent and sought out a substitute.[8] Seeking to exploit a growing market for illicitly trafficked opioids, drug traffickers eventually turned instead to fentanyl as it is easier to produce in large quantities than heroin, has a higher potency (up to 50 times stronger than heroin), and is easier and cheaper to smuggle than its counterpart.[9],[10] Resultantly, death rates from heroin began to recede, while those from fentanyl have only continued to surge.
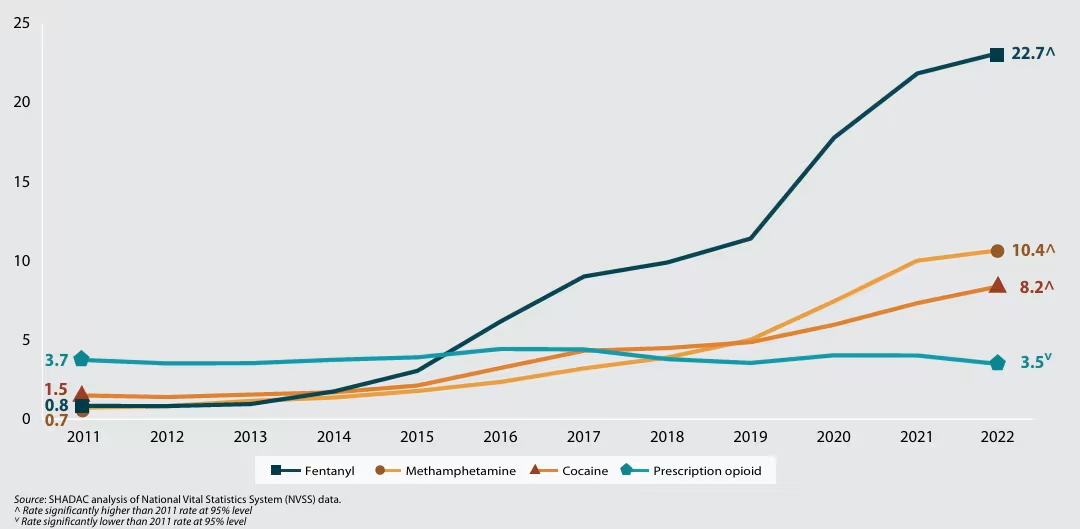
Figure 2. Fentanyl, Prescription Opioid, Methamphetamine, and Cocaine Overdose Death Rates, 2011–2022
Over a Decade in Review
In the 15 years since the U.S. Centers for Disease Control and Prevention (CDC) first declared overdoses from prescription painkillers an “epidemic” in 2011, the opioid epidemic and overdose crisis has evolved markedly and rapidly from a problem tied mostly to prescription opioid painkillers to one dominated by the meteoric rise of the synthetic opioid fentanyl.
Overall, death rates from all types of opioids have risen over more than a decade. Beginning in 2011, the overdose death rate for all opioids was 7.3 per 100,000 people. By 2023, that figure had more than tripled, climbing to 24.0 per 100,000 people. Looking at all types of drugs involved with or adjacent to the opioid crisis, including heroin, cocaine, and psychostimulants, overdose death rates have more than doubled during the same period, growing from 13.2 deaths per 100,000 people in 2011 to 31.3 per 100,000 people in 2023, with a rapid spike coinciding with the COVID-19 pandemic.
Figure 3. National Overdose Death Rates by Drug Type, 1999 to 2023
At the national level, data on opioid overdose deaths show multiple, evolving phases of the overdose epidemic. Let’s take a look at these phases a bit closer.
Pre-2011: Prescription Opioids Drive Overdose Deaths
Before 2011, the growth in opioid overdose deaths was driven primarily by natural and semi-synthetic opioids (i.e., prescription opioid painkillers).
Figure 4. National Overdose Death Rates by Drug Type, 1999 to 2011
The overdose death rate for natural and semi-synthetic opioids largely plateaued after 2011, varying year to year between around 3 and 4 deaths per 100,000 people since then.
Figure 5. National Overdose Death Rates by Drug Type, 1999 to 2023
2011 to 2015: Heroin Deaths Climb
It was beginning around 2011 that deaths from heroin began to increase more rapidly, with heroin having the highest overdose death rate in 2015.
Figure 6. National Overdose Death Rates by Drug Type, 2011 to 2015
Deaths from heroin peaked in 2016 and 2017 (4.9 deaths per 100,000) before the rate started to decline beginning in 2018. By 2023, the overdose death rate for heroin had dropped to 1.2 deaths per 100,000 people—its lowest point since they first spiked in 2011.
Figure 7. National Overdose Death Rates by Drug Type, 2011 to 2023
2016 and Beyond: Deaths from Fentanyl, Other Synthetic Opioids Drive Opioid Crisis
Since around 2013, deaths from synthetic opioids such as fentanyl have grown precipitously. The year 2016 marked a watershed, when the death rate from fentanyl and other synthetic opioids exceeded that of prescription opioids. Increases in synthetic opioid overdose deaths continued year over year, with an especially sharp spike between 2019 and 2021. The synthetic opioid overdose death rate peaked in 2022 at 22.7 per 100,000 people.
Figure 8. National Overdose Death Rates by Drug Type, 2015 to 2023
Latest Opioid Research from SHADAC
Changing Dynamics in the Opioid Crisis Since the COVID-19 Pandemic
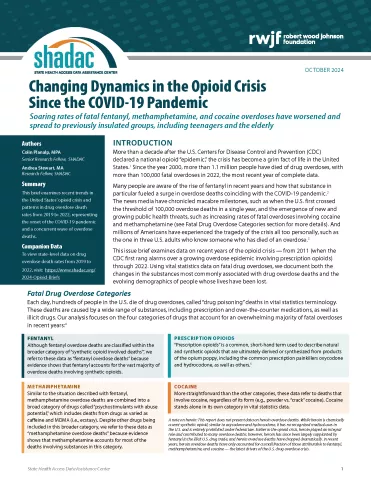
In this brief from SHADAC, published in October 2024, we examine changes in drug overdose death rates, and the types of drugs that cause these fatal overdoses, during the pandemic period (2019-2022). We also look at the history of the opioid epidemic: its beginnings, factors that influenced its evolution, and what it looks like now.
With this brief focusing on the four most common causes of drug overdoses—fentanyl, prescription opioids, methamphetamine, and cocaine—just some of the findings from this pandemic period include:
- Fatal overdoses from fentanyl increased 99%
- Fatal overdoses from methamphetamine increased 108%, and
- Fatal overdoses from cocaine increased 69%
While overdose death rates generally increased across all the measured racial and ethnic groups, “we […] found evidence of dramatic and growing disparities across racial and ethnic groups in rates of fatal overdoses, with the crisis increasingly harming American Indian and Alaska Native people and Black people during the pandemic era,” lead author and Senior Researcher Colin Planalp says.
In this brief, we explore these findings and more, including looking deeper at the impacts of the opioid crisis on different communities, demographics, and states. Click here to read the brief in full. The appendix for this piece is available here.
Access Opioid Data: Create and Download Opioid Maps, Charts, Data Tables, and More on State Health Compare
Many of the interactive trend lines, charts, and maps on this page were made using State Health Compare—SHADAC’s free and interactive data tool that allows users to explore a variety of health measures, download national and state-level data, and easily generate data visualizations.
Two of the currently available measures on SHC allow users to explore and download overdose and/or opioid data:
Opioid-Related and Other Drug Poisoning Deaths
This measure provides data on the number of opioid-related and other drug poisoning (overdose) deaths per 100,000 people. This data can be broken down by seven drug types/categories:
- All drugs
- All opioids
- Synthetic opioids
- Heroin
- Natural and semi-synthetic opioids
- Psychostimulants
- Cocaine
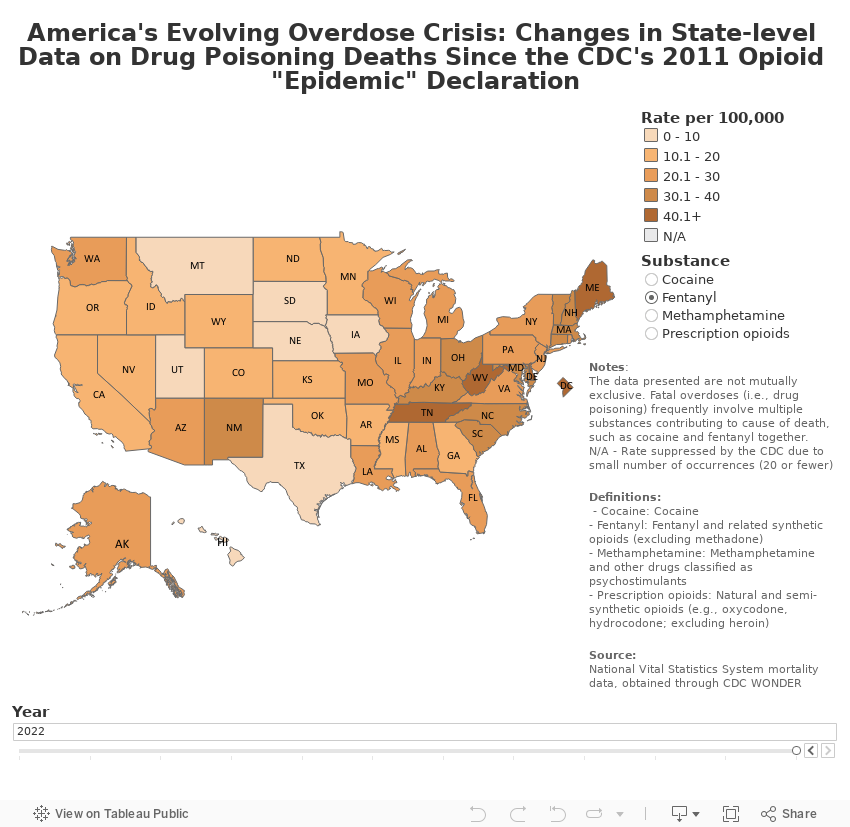
Data for this measure comes from the U.S. Centers for Disease Control and Prevention, National Center for Health Statistics via the CDC WONDER Database; estimates are available for each state, Washington D.C., and the nation from 1999 through 2023.
Sales of Opioid Painkillers
This measure includes data on sales of the prescription opioid painkillers oxycodone and hydrocodone. Prescription sales data are available for each state and the nation from 2000 through 2023 and are measured in annual kilograms of oxycodone and hydrocodone sold per 100,000 people. Data comes from the U.S. Drug Enforcement Agency's (DEA) Automated Reports and Consolidated Ordering System (ARCOS) Retail Drug Summary Reports.
Additional Opioid-Related Resources from SHADAC
Blogs
- What Are MOUD? A Review of Medications for Opioid Use Disorder, How They Work, and Issues with Access
- What Are Opioids? An Overview of Common Opioids and Differences Between Them
- During the Pandemic, Drug Overdoses Became the Third Leading Cause of Death for U.S. Adolescents
- UMN Opioid Advisory Task Force
- Charting two decades of the evolving opioid crisis
- 2020 U.S. alcohol-involved deaths climbed by 26.6%, and drug overdose deaths by 30.6%
- Drug overdose deaths grew by almost 30 percent in 2020
- Pandemic drinking may exacerbate upward-trending alcohol deaths
- After drop in 2018, newer data indicate a resurgence in drug overdose deaths
- 50-State Infographics Provide an Updated Overview of the Evolving Opioid Crisis
- Minnesota's Growing and Evolving Opioid Crisis
- National and State Trends in Opioid-Related Overdose Deaths from 2000 to 2017 (Briefs)
- SHADAC Researcher Colin Planalp Talks Trends in the Opioid Crisis with the University of Minnesota
- SHADAC Releases 50-State Analysis of the Evolving Opioid Crisis (Infographics)
- New Data on Drug Overdose Deaths Highlight the Need for State-Level Analysis
- The Changing Opioid Epidemic: State Trends, 2000-2016
- The Changing Opioid Epidemic: National Trends, 2000-2016
- The Opioid Epidemic: State Trends, 2000-2015
- The Opioid Epidemic: Exploring the Data on Overdose Deaths Nationwide from 2000 to 2015
- SHADAC Research in AJPH: Addressing Opioid Addiction through Cross-Sector Collaboration
- State Health Compare Updated to Include 2017 Opioid-Related Overdose Data and New Data on Overdose Deaths from Other Drugs
- Prescription Opioid Sales Data Added to State Health Compare
Briefs
Opioid and Related Drug Overdose Deaths
SHADAC has historically produced briefs that provide high-level information about opioids and opioid addiction. These present the historical context for the epidemic of opioid-related addiction and mortality in the United States, and examine trends in opioid-related mortality across the country, by state, and among population subgroups.
The Opioid Crisis in the Pandemic Era Brief
The Opioid Epidemic: National and State Trends in Opioid-Related Overdose Deaths, 2000-2016 (Briefs)
Opioid Use Prevention and Intervention Briefs
SHADAC researchers Carrie Au-Yeung and Lynn Blewett, along with Hennepin Healthcare researcher Tyler Winkelman, authored a Milbank Foundation policy brief that examines the federal and state policies changes put in place to improve access to medications for opioid use disorder (MOUD) during the COVID-19 pandemic, during which time MOUD became especially challenging to access because MOUD patients are typically required to have as many as six in-person clinic visits a week.
Issue Brief Examines Ohio Strategy to Improve Opioid Prescribing Through Payment Reform
A collaborative issue brief between SHADAC and the Center for Health Care Strategies (CHCS) with support from the Center for Medicare & Medicaid Innovation (CMMI). SHADAC Senior Research Fellow Colin Planalp profiled the innovative work in Ohio to link the state’s payment and delivery system reforms with another important policy priority: interventions to curtail the opioid crisis.
SHADAC Opioid Research in the Media
Much of our work on opioids and the opioid epidemic has been quoted or cited in the media and in other publications. Below is a sample of some of these media mentions:
- Opioid Overdose Deaths Plummet Nationwide: Trends Offer Hope for Sustained Recovery Spreaker (February 2026)
- Grieving mother urges parents to talk with kids as fentanyl overdoses soar in the US KENS 5 San Antonio (September 2025)
- Opioid deaths third highest cause of death in youth, UMN study says Minnesota Daily (March 2025)
- Opioid overdoses soared during the pandemic, spreading to previously less-affected groups including teenagers and the elderly UMN School of Public Health News (November 2024)
- Safe Opioid Prescribing, Storage Are Crucial Pharmacy Times (August 2024)
- CVS and Walgreens to pay a combined $10.7 billion settlement for alleged opioid prescription lapses NBC News (December 2022)
- Spotlight in Focus: Opioid Crisis Demands Psychedelic Innovation, Yesterday Psychedelic Spotlight (March 2022)
- Newest phase in opioid epidemic: Mix of opioids and stimulants like coke and meth Minnesota Reformer (January 2020)
- St. Paul experiences overdose spike over past few weeks The Center Square (January 2020)
- Cocaine overdoses rise as fentanyl is mixed in Omaha World-Herald (December 2019)
- The Drug in the Shadows Minnesota Alumni Magazine (December 2019)
- Not yesterday's cocaine: Death toll rising from tainted drug Kaiser Health News (November 2019)
- Cincinnati and Ohio at epicenter of spiking fatal ODs from fentanyl-laced cocaine Cincinnati Enquirer (November 2019)
- Tainted drugs: Alarming surge in cocaine deaths is US - as drug is cut with deadly opioid The Sun (November 2019)
- Death toll from tainted cocaine rising across the country NBC News (November 2019)
- Numbers suggest progress on opioid fight MPR News (July 2019)
- In crisis: What are opioids, really? Kanabec County Times (April 2019)
- Talking opioid crisis trends with UMN UMN News (March 2019)
- Overshadowed By Opioid Epidemic, Lack of Resources Hurts Pittsburghers Addicted to Meth WESA Blog (February 2019)
- Study: Rising concerns that synthetic opioids contaminate other drugs, too MPR News (February 2019)
- Prescription Opioid Sales in New York from 2000 to 2017 Patch (November 2018)
Infographics
Alongside the 2017 and 2018 editions of our opioid overdose briefs, SHADAC produced a series of two-page infographics for each of the 50 states, as well as the U.S., that highlight key findings for trends in drug overdose deaths. These two-page profiles examine state-level variations in opioid overdose deaths by opioid drug type, as well as by two types of non-opioid illicit drugs that are commonly involved in opioid overdoses: cocaine and psychostimulants. The infographics also show how each state's overdose rates compare to the national average and provide a high-level comparison of all 50 states' overdose rates broken down by each drug type.
Webinars
Overdose Crisis in Transition: Changing Trends in a Widening Drug Death Epidemic
A webinar hosted by SHADAC on November 24, 2020, focused on analyzing and discussing changes in overdose deaths in more recent years, especially in 2018. Using the latest available data, Senior Research Fellow Colin Planalp detailed changing trends—both in terms of substances and subpopulations of concern—across the nation and among the states.
A webinar hosted by SHADAC on September 4, 2019, examined the U.S. opioid epidemic through national and state-level data on drug overdose deaths, including opioids such as prescription painkillers, heroin, and synthetic opioids, and non-opioids (but related drugs) such as cocaine and psychostimulants (e.g., methamphetamine). Senior Research Fellow Colin Planalp detailed changing trends in the opioid crisis and how the specifics vary across states—both in the scale of the epidemic and differences in the top substances of concern.
Exploring the New State-Level Opioid Data on SHADAC's State Health Compare (Webinar)
A webinar hosted by SHADAC on September 5, 2018, explored opioid data at the state level between 2000 and 2016. Senior Research Fellow Colin Planalp discussed trends in overdose deaths by drug type (heroin, prescription painkillers, etc.) and, using data from State Health Compare, also looked at which states have the highest rates of opioid-related deaths and which states have experienced the largest increases in overdose death rates.
Interactive Maps
For the 50-state analysis on drug overdoses we produced in 2019, SHADAC also created a map that houses a two-page overview on overdose data overall and by drug type for each state, allowing readers to see where each state ranks in number of overdose deaths.
Click on a state below to see each state's infographics.
Opioid and Non-Opioid Illicit Drug Overdose Rates for all 50 States, 2000-2018

For the two national and state-level opioid trend briefs we produced in 2016, SHADAC also created two slider maps featuring heroin-related and non-heroin opioid-related overdose deaths from 2000 to 2015.
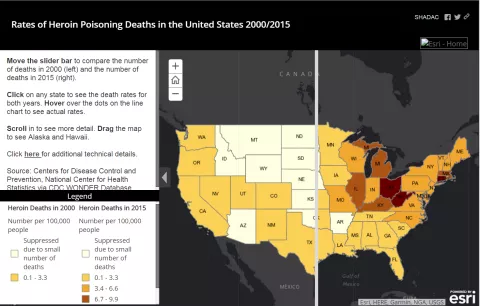
Heroin-Related Overdose Deaths, 2000-2015
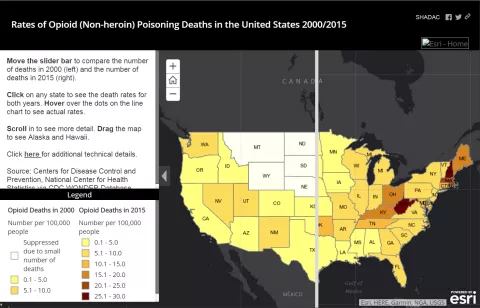
Non-heroin Opioid-Related Overdose Deaths, 2000-2015
Sources
[1] Planalp, C., Stewart, A. (2024, October). Changing Dynamics in the Opioid Crisis Since the COVID-19 Pandemic. SHADAC. https://www.shadac.org/publications/changing-dynamics-opioid-crisis-covid-19-pandemic
[2] Spencer, M., Miniño, A., Warner, M. (2022, December). Drug Overdose Deaths in the United States, 2001–2021. NCHS Data Brief, No 457. National Center for Health Statistics. https://www.cdc.gov/nchs/data/databriefs/db457.pdf
[3] Spencer, M., Garnett, M., Miniño, A. (2024, March). Drug Overdose Deaths in the United States, 2002–2022. NCHS Data Brief, No 491. National Center for Health Statistics. https://www.cdc.gov/nchs/data/databriefs/db491.pdf
[4] Garnett, M., Miniño, A. (2024, December). Drug Overdose Deaths in the United States, 2003–2023. NCHS Data Brief, No 522. National Center for Health Statistics. https://www.cdc.gov/nchs/data/databriefs/db522.pdf
[5] SHADAC analysis of Opioid-Related and Other Drug Poisoning Deaths, National Center for Health Statistics via CDC WONDER Database. State Health Compare, SHADAC, University of Minnesota. Accessed 2026. https://statehealthcompare.shadac.org/trend/197/opioidrelated-and-other-drug-poisoning-deaths-per-100000-people-by-drug-type#0/1/162/10,11,12,13,14,1,2,3,4,5,6,7,8,15,24,25,27,32,37,42,76/233
[6] Centers for Disease Control and Prevention (CDC). (2025, June 9). Understanding the Opioid Overdose Epidemic. https://www.cdc.gov/overdose-prevention/about/understanding-the-opioid-overdose-epidemic.html
[7] Planalp, C., Hest, R., Lahr, M. (2019, June). The Opioid Epidemic: National Trends in Opioid-Related Overdose Deaths from 2000 to 2017. SHADAC. https://shadac-pdf-files.s3.us-east-2.amazonaws.com/s3fs-public/publications/2019%20NATIONAL%20opioid%20brief%20FINAL%20VERSION.pdf
[8] Rudd, R., et al. (2014, October 3). Morbidity and Mortality Weekly Report (MMWR): Increases in Heroin Overdose Deaths — 28 States, 2010 to 2012. Centers for Disease Control and Prevention (CDC). https://www.cdc.gov/mmwr/preview/mmwrhtml/mm6339a1.htm
[9] Walsh, E. (2025, August 20). What Are Opioids? An Overview of Common Opioids and Differences Between Them. SHADAC. https://www.shadac.org/news/what-are-opioids-overview-common-opioids
[10] Wisconsin Department of Health Services. (2025, December 22). Opioids: Facts. https://www.dhs.wisconsin.gov/opioids/facts.htm