
Blog & News
Lukanen, Elizabeth
Zylla, Emily


Best Practices for Publicly Reporting State Unwinding Data (Cross-Post)
June 30, 2023:
The following content is cross-posted from State Health & Value Strategies.
Authors: Elizabeth Lukanen, Emily Zylla, SHADAC
Original publication date: June 30, 2023.
The unwinding of the Medicaid continuous coverage requirement represents the largest nationwide coverage transition since the Affordable Care Act. With the restarting of eligibility redeterminations, millions of Medicaid enrollees are now at risk of losing their coverage and there is intense interest in monitoring the impact on coverage. To promote transparency, the Centers for Medicare & Medicaid Services (CMS) is requiring that states report the results of eligibility redeterminations and many states are making that data public. SHVS continues to monitor the states that are publicly reporting their unwinding data either in the form of data dashboards or static pdfs and the states posting copies of their required CMS Monthly Unwinding Data reports.
As advocates and researchers start to analyze unwinding data, it has become clear that it is difficult to compare different states for a variety of reasons. For example, states are initiating redeterminations and therefore disenrollments in different months and some states are staging redeterminations in a way that focuses on certain groups first, such as starting with people least likely to remain eligible. States are using a variety of different strategies to mitigate procedural terminations. States also use different terminology, definitions, population denominators, and timeframes on their reporting, which also makes it difficult to compare one state’s data to another.
In spite of data challenges, there are some best practices states can follow when reporting unwinding data.
- Release CMS Monthly Reports. While we typically don’t recommend releasing competing sources of data on the same topic, in this case, we recommend releasing CMS Monthly Reports alongside any state-specific data reporting to help satisfy calls from advocates and the media for comparable data across states. However, we recommend that states provide context about why the information may differ on state dashboards from CMS monthly reports. Kansas, for example, explains that data on their monthly unwinding reports is different from data on their dashboard because members move between reported categories.
- Timely release. Given the magnitude and scrutiny of unwinding coverage transitions, we recommend that states produce a data report that can be updated easily and frequently – at least monthly. We recommend prioritizing accuracy and timeliness over depth. And, if states are refreshing state unwinding data monthly, they should consider releasing it in tandem with the CMS Monthly Unwinding data reports.
- Prioritize key measures. Because timeliness of this data is so important, the report or dashboard needs to have enough data points to convey key information, but be limited enough to update quickly. In this case, we recommend focusing on measures that are already being reported (CMS Performance Indicators and indicators from the CMS Monthly Unwinding Data report). Key measures include:
- Renewals initiated
- Successful renewals
- Ex-parte/passive renewals
- Coverage terminations
- Procedural terminations
- Medicaid cases sent to the Marketplace
- Call center volume
- Number of terminations who reenroll in a specific period of time (e.g. 90 days)
- Publish disaggregated data. While required CMS data reporting includes very limited data disaggregation, there is a great interest in understanding who is being impacted by the unwinding. At a minimum, we recommend displaying data breakdowns by:
- Program type
- Age (children versus adults)
- Race
- Ethnicity
- Language
- Income
- Geography (ZIP code is best, but by county or any other level lower than statewide is helpful)
- Provide context and transparency. As noted above, there are many reasons that the data reported by different states might be difficult to compare. We strongly encourage states to use their reporting vehicle to contextualize and explain various measures. This includes:
- Document data revisions. We anticipate that states may be asked by CMS to make various adjustments retroactively to their data. States do not need to wait until data is final to post it publicly. They can address this by including revision dates when new data are posted. And wherever possible, maintain an archive of older data for comparability.
- Include both proportions and counts. Proportions are especially useful to help make comparisons across states on measures like procedural denials, but counts are critical for understanding the denominators being used and to get a sense for the magnitude of impacts within states.
- Include data labels, definitions, and context. Provide clear data labels, establish defined date ranges for data being displayed, add data refresh dates (as needed), describe population numerators and denominators if relevant (including exclusions such as pending cases). If the format allows, link to information that can help contextualize the information. This might include the state’s unwinding timeline, information about how redeterminations are being staged or any analysis or reaction to the results to date. For example, California posts their plan for prioritizing and distributing renewals on the same page as their unwinding data. Kentucky also has a webpage dedicated to unwinding that includes the state’s unwinding dashboard (the Kentucky Medicaid Renewals Data Snapshot), their required CMS unwinding reports and materials from monthly stakeholder sessions that provide a summary of the federal requirements, state goals and activities and their progress to-date.
Related SHVS Expert Perspectives:
Blog & News
Hest, Emily
Hest, Robert
Community and Uninsured Profile In Action: Local Case Studies
June 8, 2023:With the recent end of the public health emergency and subsequent “unwinding” of the Medicaid continuous coverage requirement, many Americans are now having to navigate changes in health insurance coverage. And while coverage transitions aren’t unique to this moment, the unwinding has spurred many states to think critically about how to mitigate the impacts of this event on potentially vulnerable populations.
Existing data on local communities is invaluable for states considering their approach for helping their residents secure coverage both now and beyond this historic moment. The Minnesota Community and Uninsured Profile is one example of the type of data that can make a meaningful difference in efforts to reach and cover communities. The Minnesota Community and Uninsured Profile features population details and characteristics that can be applied for a variety of different purposes; below are two case studies highlighting how the profile can support the enrollment efforts of local organizations and departments.
Community and Uninsured Profile in Action
Open Door Health Center Case Study
Open Door Health Center (ODHC) is a community health center that serves southern Minnesota. Given that ODHC serves a broad geographic area with limited staffing and resources, the team has to be strategic about how they do community outreach and enrollment. The profile helps ODHC identify specific areas in southern Minnesota with concentrations of uninsured individuals who are potentially disconnected from health care resources. Their navigators can then conduct enrollment and educational events within those areas, equipped with the important context on the local population found in the profile.
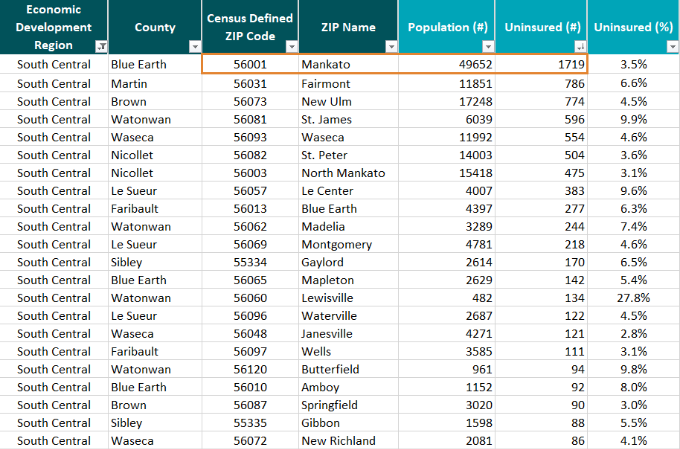 Staff at ODHC used the “ZIP Code Uninsured Rates” tab in the profile to hone in on the 24 community ZIP Codes in their region (South Central, MN) with available data. Among those communities, Mankato (56001) has the largest number of uninsured at 1,719 people which could make it a logical site for enrollment and outreach efforts.
By entering “56001” in the Uninsured Profile tab, they could get more pertinent information about Mankato to help effectively target outreach. For example, they would see that among the uninsured in this community:
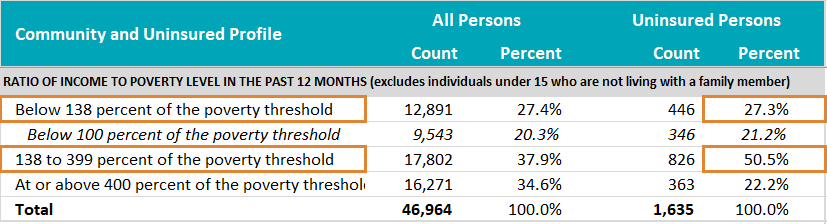 More than a quarter are likely income eligible for Minnesota Medical Assistance (<138% of the federal poverty level [FPL]) and more than half are likely income eligible for subsidized coverage through MNsure (138-400% FPL)
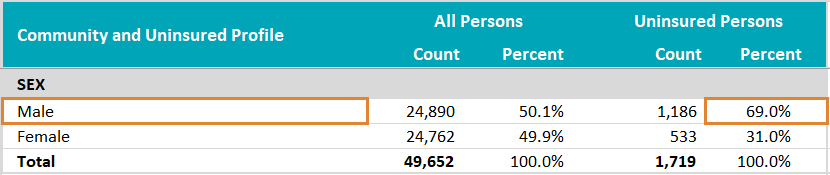 Nearly 70% are male;
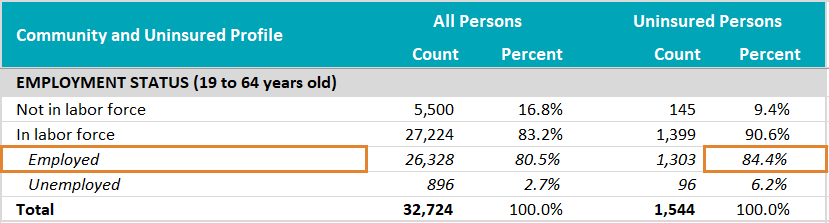 More than 80% are currently employed;
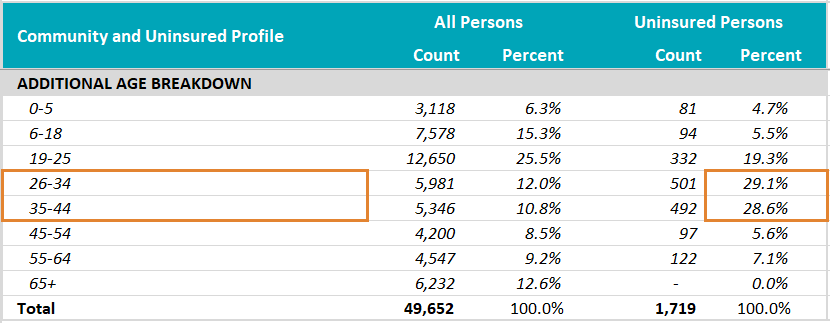 And nearly 60% are between the ages of 26 and 44.
Based on these characteristics, staff at ODHC could set up enrollment events in partnership with employers of low-wage workers, or target outreach with messages and venues that speak to male residents or adults in early to middle age. ODHC could be confident that many of the uninsured community members they reach would be income-eligible for some type of free or subsidized coverage.
Further, looking at the profile, ODHC staff could observe that though there are a relatively small number of uninsured Hispanic/Latino residents of this community (211 persons), that group has a high uninsured rate (10.1%), especially compared to Mankato’s comparatively low community uninsured rate of 3.5%. This could indicate that further work needs to be done specifically to cover the Hispanic and Latino residents of Mankato.
Nicollet County Case Study
Nicollet County's local public health department serves a population of about 33,000. Like ODHC, they use the profile to review the demographics of those who are uninsured in their community to inform outreach efforts. The Community and Uninsured Profile also helps them target influenza and COVID-19 vaccinations for underinsured and uninsured community members. The department also uses the profile to better understand the characteristics of individuals who are uninsured in their communities through demographic filters such as race and ethnicity.
Looking in the ZIP Code Uninsured Rates tab, there are two ZIP-Code-defined communities (with available data) in Nicollet County: St. Peter (56082) and North Mankato (56003). Both have relatively low uninsured rates at 3.6% and 3.1%, respectively, and both have around 500 uninsured residents.

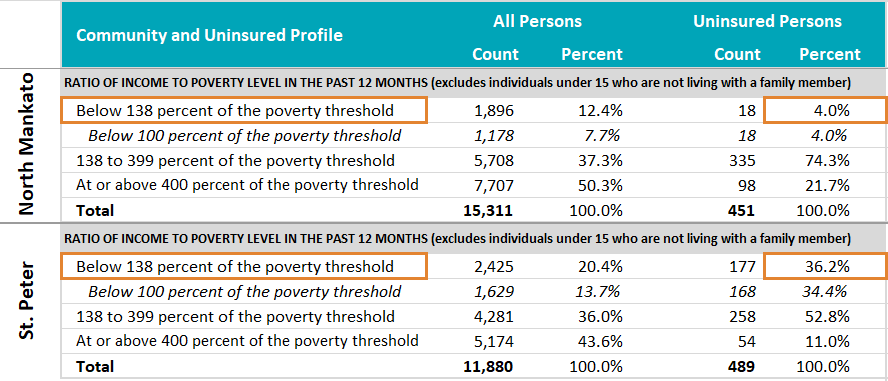 However, there are important differences between these communities that are evident when looking in the Uninsured Profile tab. For example, though less than 5% of the uninsured in North Mankato appear to be income-eligible for Medical Assistance (<138% FPL), more than 36% of the uninsured in St. Peter appear to be income-eligible for that program.
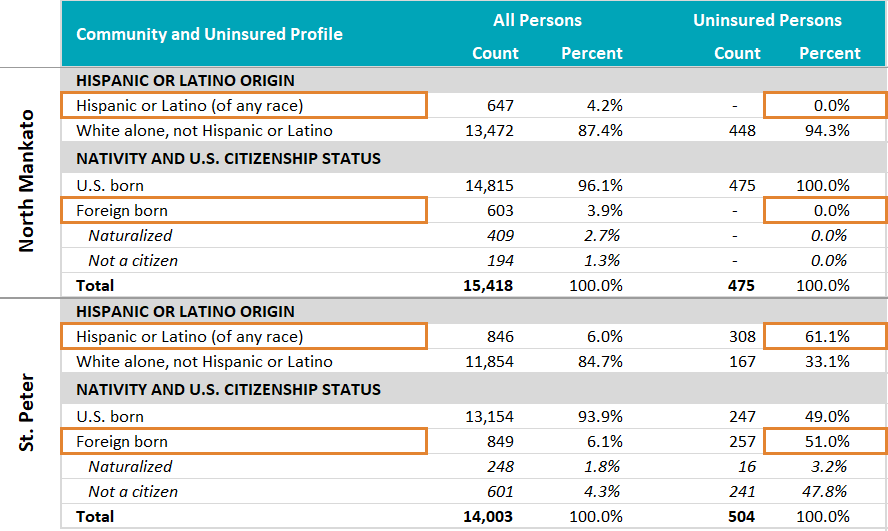
Further, whereas none of the uninsured in North Mankato are Hispanic or Latino, Hispanic or Latino residents make up more than 60% of the uninsured in St. Peter. And there is a similar story by citizenship status and nativity; whereas all of North Mankato’s uninsured are U.S. born, more than 50% of St. Peter’s uninsured are foreign born, and more than 90% of those are not citizens, which creates policy and financial barriers to accessing insurance and health care.
The different characteristics of the uninsured in these two communities call for different strategies for outreach and enrollment efforts, such as providing culturally appropriate materials, selecting different sites or partners for enrollment events, and being prepared to enroll uninsured community members into different types of health coverage programs.
What are your Community and Uninsured Profile stories?
Are you a part of an organization that uses the Minnesota Community and Uninsured Profile? We would love to hear stories of how you have used the profile in your work. If you have a story to share, please send it to shadac@umn.edu.
Publication
What the Growing Medicaid Undercount Means for Data Users and Policymakers
SHADAC hosted a one-hour webinar on Wednesday, April 5th to discuss the rising Medicaid undercount. With many states and stakeholders eager to understand the topic further, this webinar provided an overview of issues related to the Medicaid undercount along with relevant policy implications. View a recording of this webinar below!
Download the slidedeck from this webinar here.
-
The extent to which, how, and why 2021 coverage data underestimated Medicaid coverage and/or overestimated uninsurance
-
The data and methodology used to calculate the undercount
-
How policy and advocacy may be impacted by the growing Medicaid undercount
The panel also answered questions from the audience following their presentation. Due to time constraints, the panelists were unable to answer all audience-submitted questions live. Please click here to view those additional Q&A.
Speakers
Lynn Blewett
Director @SHADAC
Dr. Lynn Blewett is the Founding Director of SHADAC, as well as a Professor in the Division of Health Policy and Management at the University of Minnesota, School of Public Health, where she teaches graduate courses on the U.S. health care system and international health systems. Her health policy experience includes legislative work for the U.S. Senate and state policy work as Director of the Health Economics Program for the Minnesota Department of Health.
Benjamin Sommers
Dr. Benjamin Sommers is a health economist, primary care physician, and professor. Dr. Sommers currently serves as a Senior Counselor to the Assistant Secretary for Planning and Evaluation (ASPE) at the U.S. Department of Health and Human Services, where he was previously the Deputy Assistant Secretary for Health Policy. He is also the Huntley Quelch Professor of Health Care Economics at the Harvard School of Public Health. His research interests include health insurance markets, Medicaid, health disparities, and the health care safety net.
Robert Hest
Robert Hest is a Senior Research Fellow at SHADAC. Mr. Hest provides expertise in survey data, quantitative data analysis, data visualization, and health coverage policy. Mr. Hest also manages SHADAC’s State Health Compare website, coordinating data processing, quality assurance, dissemination, and documentation of data. In addition, Mr. Hest provides technical assistance to states and other organizations on topics related to health coverage, cost, and access.

Genevieve Kenney
Co-Director and Senior Fellow @Urban Institute
Genevieve M. Kenney is co-Director and a Senior Fellow in the Health Policy Center at the Urban Institute. Dr. Kenney is an expert on Medicaid, CHIP, and health outcomes for low-income adults, children, and families. She has also played a lead role in a number of Medicaid and CHIP evaluations, including multiple congressionally mandated evaluations of CHIP, and has conducted state-level evaluations of the implementation of managed care and other service delivery reform initiatives and policy changes in Medicaid and CHIP.

Joan Alker
Executive Director @Georgetown University Center for Children and Families
Joan Alker is the Executive Director and Co-Founder of the Georgetown University Center for Children and Families and a Research Professor at the McCourt School of Public Policy at Georgetown University. She is a nationally recognized expert on Medicaid and the Children’s Health Insurance Program (CHIP) and is the lead author of CCF’s annual report on children’s health coverage trends.
Blog & News

Updates to Minnesota’s Community and Uninsured Profile: NEW Social Vulnerability Index Information and Updated 2017–2021 Data
March 28, 2023:|
|
 |
 |
Following the release of the 2021 U.S. Census Bureau’s American Community Survey 5-year data file (2017–2021), SHADAC has made important updates to the Minnesota Community and Uninsured Profile resource to incorporate an analysis of the 2021 data.
The Community and Uninsured Profile now includes new information on the area-level Social Vulnerability at the ZIP code level. This Social Vulnerability Index (SVI) can be used to understand how community factors like: socioeconomic status; household composition and disability; race/ethnicity and language; and housing type and transportation contribute to Minnesota communities’ level of vulnerability and need for social and economic investment. For example, this SVI information was used by public and private organizations to help target testing and vaccine promotion during the COVID-19 pandemic.
The Community and Uninsured Profile can be used in two ways: (1) to support community-level investments, equity-focused work, advocacy work, strategic planning, community needs assessments, and grant-writing; and (2) to target health insurance coverage outreach and enrollment efforts.
The Community and Uninsured Profile provides rates and counts of Minnesotans at a range of geographic levels. Users can explore characteristics of the total population and the uninsured population in a specific ZIP code while also overlaying in-depth community characteristics. In addition, users can look at rates and characteristics of the community and uninsured within the state as a whole, by region, county, and state legislative district. Users can also filter by MNsure rating areas—the geographic regions health insurers use to set premiums on MNsure.
The profile can also be used in conjunction with the Minnesota Department of Human Services’ Medicaid Renewal Dashboard, which presents state- and county-level information about the number of Minnesota Medicaid recipients due for re-enrollment during the “unwinding” from the pandemic-era Medicaid continuous coverage requirements. Though the Renewal Dashboard can be filtered by SVI quartile, the finer-grained geographic information in the SHADAC Community and Uninsured Profile (ZIP Code) is a useful supplement to help target outreach. For example, navigators could use the SHADAC Profile to find those ZIP Codes within a county that have a high level of Social Vulnerability to pinpoint areas of the greatest need for re-enrollment assistance.
This resource was originally developed as part of “Minnesota’s Uninsured and the Communities in Which They Live,” a project funded by the Blue Cross Blue Shield of Minnesota Foundation that supports targeted outreach and enrollment activities of health insurance navigators and provides contextual information to Minnesota policymakers as they develop strategies to reach the remaining uninsured in Minnesota.
To access additional information, or request the development of a similar tool for another state, visit the Minnesota Community and Uninsured Profile Resource page.
Blog & News

Review of Health Insurance Coverage Data in 2021: Releases and Resources
February 27, 2023:Each year, SHADAC covers the releases of health insurance coverage data from major federal surveys such as the American Community Survey (ACS) and Current Population Survey (CPS), both of which are overseen by the U.S. Census Bureau.1 Not only do these data provide an understanding of trends for the millions of individuals in the United States who lack any type of coverage, but they also give indications of changes in other major forms of health insurance, like public coverage, private coverage, and employer-sponsored coverage.
SHADAC researchers work to provide insights into these data in a variety of formats (including reports, blog posts, and webinars) and analyze a multitude of important demographic groups (children, families living below poverty levels, and for communities of color). We also know that to truly understand the trends and vagaries of health insurance coverage, it’s important to look beyond national-level statistics, to see what’s happening at the state level.
That’s why we recently updated one of the longest-running measures on SHADAC’s data tool, State Health Compare, “Health Insurance Coverage Type” with the latest data for 2021. Users can take a look at estimates of health insurance coverage across all 50 states by type (uninsured, employer-sponsored, Medicaid/CHIP, etc.), by categories (age, education level, race/ethnicity, marital status, poverty level, etc.),2 over time (from 2008-2021),3 and can even examine estimates using color-coded maps, trend and bar charts, or by ranking states in terms highest and lowest rates for any coverage type.
2021 Key Findings
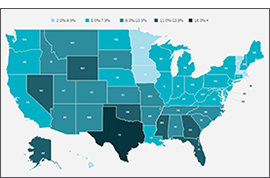
After multiple disruptions to data collection efforts resulted in data quality issues for 2020 ACS estimates, SHADAC is excited that data for 2021 are able to be used with confidence once again—though users are cautioned not to compare data to the prior year. Nationally, the U.S. saw a near-record low rate of uninsurance in 2021, at 8.6%, second only to a rate of 8.5% in 2016.
Looking at the state level, however, shows much wider variation in uninsured rates, from a low of 2.4% in Massachusetts to a high of 17.9% in Texas. By larger demographic groups:
- Among children (age 0-18), 5.4% were uninsured in 2021; however, by state, this ranged from 1.1% in Massachusetts to 11.8% in Texas.
- Among those below the poverty level, 15.6% were uninsured in 2021; however, by state, this ranged from 4.4% in Vermont to 30.5% in Texas.
- Among individuals with less than a high school degree, 22.2% were uninsured in 2021; however, by state, this ranged from 5.9% in Massachusetts to 41.4% in Texas.
- Among people reporting “Fair” or “Poor” health status, 25.9% were uninsured in 2021; however, by state, this ranged from 17.9% in Louisiana to 44.7% in Utah.
SHADAC Publications
For a full range of available products from SHADAC’s coverage of the 2022 health insurance data release (2021 estimates) please see below.
|
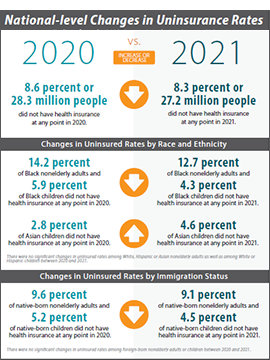
2021 CPS ASEC: National-level |
An Annual Conversation with |
Comparing Federal Government |
|
2021 ACS: State-level Analysis |
2019 vs 2021 ACS: State and |
2017-2021 ACS: 5-year State and |
- CPS ASEC: 2021 National Health Insurance Coverage Estimates Show Falling Uninsured and Private Coverage Rates Across Population Demographics (Blog & Infographic)
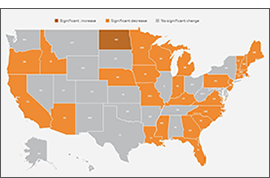
- 2021 ACS: Estimates Show Declining Uninsurance Rates Across 28 States, Driven by Rise in Public Coverage and Fall in Private Coverage (Blog & Interactive Maps)
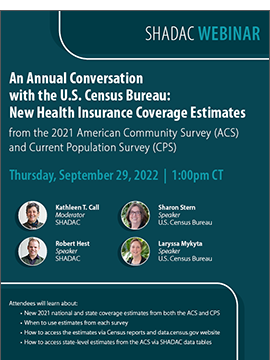
- An Annual Conversation with the U.S. Census Bureau: Coverage Estimates from the 2021 ACS and CPS (Webinar Recording)
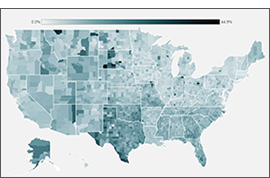
- 2021 ACS Data: State and County Uninsured Rates, with Comparison Year 2019 (Blog, Interactive Map, & Data Tables)
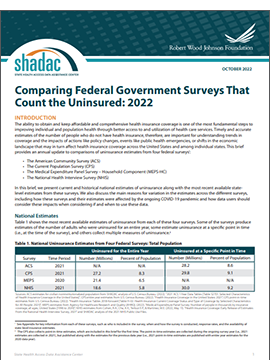
- Comparing Federal Government Surveys That Count the Uninsured: 2022 (Issue Brief)
- 2017-2021 ACS: 5-year Combined State and County Uninsured Rates (Blog, Interactive Map, & Data Tables)
For more detailed estimates on health insurance coverage in 2021, please visit State Health Compare. Be sure to also check out our helpful guide to Navigating Data on State Health Compare for more on what users can do with this unique data tool!
1 SHADAC also covers health insurance coverage data releases from both the National Health Interview Survey (NHIS) and the Medical Expenditure Panel Survey (MEPS). For more on the NHIS, see a recent blog post discussing the early release estimates from the first half of 2022, and for more on the MEPS, see the latest edition of our of Employer-Sponsored Health Insurance report.
2 Because of changes made in 2020 to how the ACS measures race and ethnicity, caution should be used when comparing data by race and ethnicity from 2021 and later to data from 2019 and earlier.
3 As previously documented by SHADAC, 2020 ACS data were unfortunately severely disrupted by the COVID-19 pandemic, resulting in the choice by the U.S. Census Bureau to release the estimates in an “experimental-only” capacity. For that reason, SHADAC created a special “Health Insurance Coverage Type (2020)” measure using data from the CPS. For more on the reasoning behind using the CPS instead of the ACS and the differences between the two surveys, please see our explanatory blog post.

