
Blog & News


State Health Compare Updated to Include 2017 Opioid-Related Overdose Data and New Data on Overdose Deaths from Other Drugs
January 18, 2019:SHADAC has recently updated our State Health Compare estimates on opioid-related drug overdose deaths to include data from 2017. Data on this measure, which examines natural and semi-synthetic opioids, synthetic opioids, and heroin, are now available for years 1999 to 2017.
We have also added new data on drug overdose deaths associated with cocaine and psychostimulants (e.g., methamphetamine), which have increased in recent years — an increase that evidence suggests may be related to the growing opioid crisis.
Users are able to view estimates for all available data years and for all five drug types at both the national and state level.
Access the updated and new estimates.
Highlights: National Trends, 1999-2017
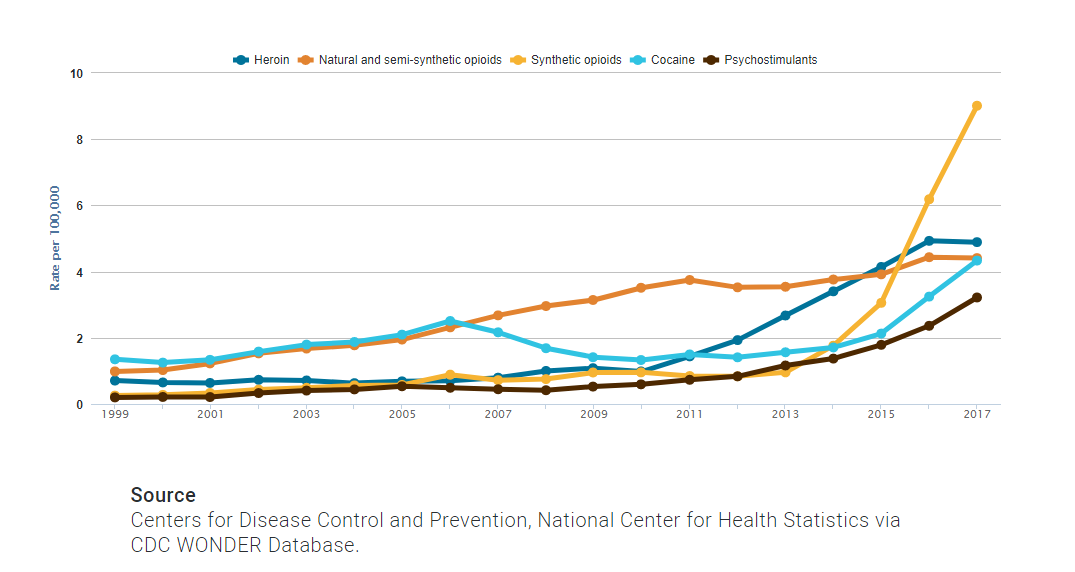
At the national level, the opioid overdose epidemic has borne out and evolved over multiple phases since 1999. From 1999 through 2014, natural and semi-synthetic opioids (i.e., prescription painkillers) had the highest death rate among opioids. In 2015, heroin overtook prescription painkillers for a brief period with the highest death rate among opioids. But by 2016, deaths from synthetic opioids, such as fentanyl, became the foremost cause of opioid-related overdose death rates nationwide, a trend that continued in 2017.
Among overdose deaths associated with non-opioids, cocaine-related deaths have consistently exceeded those of psychostimulants at the national level since 1999, although the two overdose categories began increasing in tandem around 2013 and have continued upward since then. However, death rates from cocaine and psychostimulants have remained below opioid-related death rates since 2013.
Since 1999:
- Death rates from natural and semi-synthetic opioids (i.e., prescription painkillers) have more than quadrupled, from 1.0 per 100,000 people to 4.4 per 100,000 people in 2017.
- Death rates from synthetic opioids have grown thirty-fold, from 0.3 per 100,000 people to 9.0 per 100,000 people in 2017.
- Death rates from heroin have grown seven-fold from 0.7 per 100,000 people to 4.9 per 100,000 people in 2017.
- Death rates from cocaine have more than tripled, from 1.4 per 100,000 people to 4.3 per 100,000 people in 2017.
- Death rates from psychostimulants have grown by a factor of sixteen, from 0.2 per 100,000 people to 3.2 per 100,000 people in 2017.
Highlights: Regional and State Estimates, 2017
At the state level, both the levels of death rates and the types of drug which were the dominant causes of death varied widely in 2017. For example:
- West Virginia’s rate of deaths from synthetic opioids (e.g., fentanyl) in 2017, at 37.4 per 100,000 people, was the highest in the country and more than 30 times the rates of states such as Nebraska and Texas (1.2 per 100,000 people).
- Utah had the second-highest rates of deaths from natural and semi-synthetic opioids in 2017, at 10.0 deaths per 100,000 people; however, compared to the U.S. trend, the state has experienced relatively little growth in deaths from synthetic opioids.
- Death rates from cocaine, heroin, and synthetic opioids in 2017 were generally higher east of the Mississippi River, particularly among states in the Northeast, Appalachian region, and the industrial Midwest.
- The western U.S. and the Southeast, along with the Appalachian region, had higher rates of overdose deaths in 2017 for psychostimulants compared with the Northeast.
State variations in overdose death rates have prompted a recent shift in focus for both data analysis and public health intervention to the state level.
Explore these updated and additional estimates on State Health Compare.
Further Reading and Resources
New Data on Drug Overdose Death Highlight the Need for State-Level Analysis
The Changing Opioid Epidemic: State Trends, 2000-2016
The Changing Opioid Epidemic: National Trends, 2000-2016
The Opioid Epidemic: National and State Trends in Opioid-Related Overdose Deaths, 2000-2016 (Briefs)
Blog & News
MACStats from MACPAC: 2018 Medicaid and CHIP Data Book Now Available
February 1, 2019: The Medicaid and CHIP Payment and Access Commission (MACPAC) recently released the 2018 version of its Medicaid and CHIP Data Book. This data book is a collection of federal and state statistics regarding the Medicaid and CHIP programs that are compiled by MACPAC from multiple data sources on key topic areas including Medicaid and CHIP eligibility, enrollment, and expenditures, as well as beneficiary health, service use, and access to care. An excellent resource, the data book draws on a wide variety of data sources including Medicaid administrative data (e.g., CMS-64 data, MSIS data, Medicaid Managed Care enrollment reports, etc.) as well as federal survey data in order to compile policy relevant, but difficult to access, information about the Medicaid and CHIP programs into one comprehensive tool.
SHADAC is excited to be among the contractors that contributed to this product, providing MACPAC with estimates from the National Health Insurance Survey (NHIS) and the Medical Expenditure Panel Survey (MEPS) that highlight individual enrollment, primary source of insurance coverage, and service use and access to care with breakdowns available by age, demographics, and health characteristics. SHADAC produced these estimates using data for years 2016 and 2017, which are the latest available respectively for each survey.
For additional information on data methods and sources used in the data book, see MACPAC’s Technical Guide to MACStats, which provides supplementary information to help readers interpret the exhibits in the MACStats tables and figures as well as to understand the data sources and methods used.
Blog & News
Register Now: February 6th Webinar - Exploring Disparities Using SHADAC's State Health Compare
January 28, 2019:Exploring Disparities Using New and Updated Measures on SHADAC’s State Health Compare: State-Level Highlights for Unaffordable Rents, Unhealthy Days, and More
Date: February 6, 2019
Time: 1:00 p.m. – 2:00 p.m. Central
Register now.

Join us on Wednesday, February 6th at 1:00 PM Central for a webinar introducing two new measures of health outcomes and social determinants of health on SHADAC’s State Health Compare—Unhealthy Days and Unaffordable Rents. This presentation, hosted by SHADAC researchers Brett Fried and Robert Hest, will examine these new measures and highlight how the estimates can be used to explore disparities between states and among sub-populations.
 The webinar will also provide a virtual tour of some of the more than 40 state-level measures currently available on State Health Compare, highlighting recently updated data in particular. Mr. Fried and Mr. Hest will demonstrate how users can employ State Health Compare to easily create compelling maps, charts, and graphs, as well as download the raw estimates to perform deeper analyses and statistical testing.
SHADAC researchers will answer questions from attendees after the presentation.
Adult Unhealthy Days: A New Measure on State Health Compare
SHADAC Blog
Housing Affordability Matters: Measuring and Addressing the Burden of Unaffordable Rents
SHADAC Blog
Examining Unaffordable Rents as a Social Determinant of Health
SHADAC Publication - Infographics
Significance Testing Using State Health Compare
SHADAC Brief
Blog & News
Now Available on State Health Compare: Updated Measures on Public Health, Health Outcomes, and Access, Cost, and Utilization of Care
December 12, 2018:SHADAC has updated eight data measures with the latest available estimates on our State Health Compare site. The updated measures include:
This measure indicates an individual state’s share of public health funding for the previous fiscal year. Data is available from 2005-2017, excepting in 2006 when data is not available.
This measure highlights the percent of people who made changes to their medical drugs due to cost in the past year. Breakdowns by age and coverage type are available for each state from 2011-2016.
This measure shows the percent of people who did not have trouble finding a doctor in the past year. The measure can be broken down by age and coverage type, and is now available from 2011 through 2016.
This measure captures the percent of persons who reported that their provider did accept their insurance type in the past year. The measure is available for 2011-2016 and can be broken down by age and coverage type as well.
Available for years 2011-2016, this measure counts the percent of people who had a usual source of medical care other than the emergency department (i.e., doctor’s office, clinic, health center, etc.) in the past year. Breakdowns by age and coverage type are also available.
This measure indicates the percent of adults who reported having a general doctor or provider visit in the past year. This measure can be broken down by age coverage type, and is available for all states from 2011 through 2016.
This measure, indicates the rates of individuals who reported a visit to the emergency department during the past twelve months for any reason and can be broken down by age and coverage type. Estimates are available from 2011-2016.
This measure denotes the rate of individuals who reported spending the night in a hospital at least once over the past year and can be broken down by age and coverage type. The measure is available from 2011-2016 for all states.
Explore these updated estimates on State Health Compare.
Data Sources
The State Health Compare estimates for public health funding come from Trust for America’s Health (TFAH) and all other measures regarding adults who made changes to medical drugs, had no trouble finding a doctor, are told that their provider accepts their insurance, had a usual source of medical care, had a general doctor or provider visit, had an emergency department visit, or spent the night in a hospital over the past year come from the National Health Interview Survey (NHIS).
Blog & News
Now Available on State Health Compare: Updated data on measures of social determinants of health, health insurance coverage, and children’s health through 2017
December 4, 2018:SHADAC has updated seven measures on our State Health Compare site. Updated content includes:
This measure shows rates of uninsurance or coverage type and is now available for all states from 2008 through 2017, with breakdowns by age, citizenship, disability status, education, family income, limited English proficiency, marital status, poverty level, race/ethnicity, sex, and work status.
This measure indicates the percent of children who live in households with incomes below the Federal Poverty Guidelines (FPG) with breakdowns for race/ethnicity. This measure is now available for all states from 2008 through 2017.
This measure shows the percent of people who are in families where out-of-pocket spending on health care, including premiums, accounted for more than 10 percent of annual income. The measure can be broken down by income and race/ethnicity and is now available from 2013 through 2017.
This measure captures state and federal spending on Medicaid as a share of each state’s budget and is now available for all states from 2000 through 2017.
This measure indicates the percent of adults who report being in poor or fair health, and is now available for all states from 2005 through 2017.
This measure indicates the percent of children ages 19-35 months who received all recommended vaccines and is now available for all states from 2000 through 2017.
This measure shows the percent of rental households that spend more than 30% of their households' monthly income on rent. Data for 2012-2017 is now available for all states, and can be broken down by income categories, Medicaid enrollment, and white/non-white status.
Explores these updated estimates on State Health Compare.
Data Sources
The State Health Compare estimates for coverage type, children considered to be poor, and unaffordable rents come from the U.S. Census Bureau American Community Survey (ACS); the people with high medical cost care burden measure comes from the U.S. Census Bureau Current Population Survey (CPS); the Medicaid expenses as percent of the state budget rates comes from National Association of State Budget Officers Reports (NASBO); and the child vaccinations measure comes from the Centers for Disease Control and Prevention (CDC) National Immunization Survey.

