This set of two-page infographics uses estimates from SHADAC’s State Health Compare online data tool to explore the evolving opioid overdose epidemic across all 50 states and the District of Columbia, examining state variation in both the prevalence of opioid deaths and the types of opioids associated with these deaths.
Additionally, due to growing concern and evidence that the opioid crisis may be expanding to other non-opioid illicit drugs, we have included data on drug overdose deaths from two types of drugs that are commonly involved in opioid overdoses: cocaine and psychostimulants, such as methamphetamine.
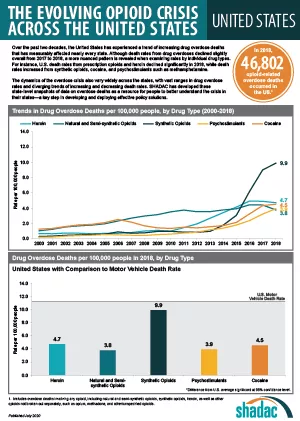
The infographics highlight key findings for trends in drug overdose deaths from 2000-2018, show how each state's overdose rates compare to the national average, and provide a high-level comparison of all 50 states' overdose death rates broken down by each of the five drug types.
Click on a state below to see its two-page infographic or download all state's infographics all states' infographics here.

Explore the drug overdose death data further on State Health Compare.
Further Reading and Resources
The Opioid Epidemic in the United States
SHADAC Resource
The Evolving Opioid Epidemic: Observing the Changes in the Opioid Crisis through State-level Data
SHADAC Webinar, September 2019
The Opioid Epidemic: National and State Trends in Opioid-Related Overdose Deaths from 2000 to 2017
SHADAC Briefs, June 2019
Archive: 2000-2017 Evolving Opioid Crisis Infographics
SHADAC Infographics, February 2019