Sunday, March 23, 2025 marked 15 years since the Affordable Care Act (ACA) was signed into law. In this post, we take a look at what the Affordable Care Act is, how it’s changed America’s insurance coverage rates, and the impact of the ACA on uninsured populations.
What Is the ACA?
The ACA represents the largest expansion of health insurance coverage since the creation of Medicare and Medicaid in 1965.
It is known for creating new programs such as state marketplaces for subsidized individual-market health insurance coverage and an expansion of Medicaid eligibility to low-income adults while leaving the country’s system of employment-based coverage intact1.
More Americans Have Health Insurance Coverage Than Ever Before
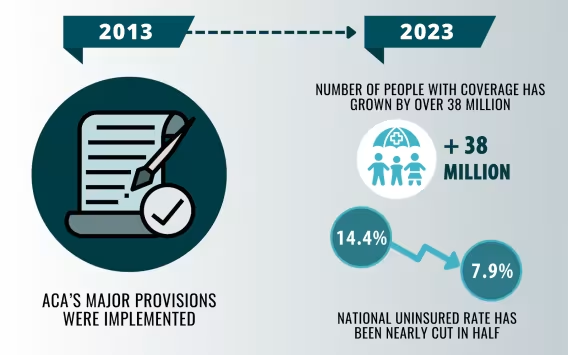
Since the ACA’s major coverage provisions were implemented in 2013, the number of people with health insurance coverage has grown by more than 38 million, and the nation’s uninsured rate has nearly halved, falling from 14.4% in 2013 to 7.9% in 2023.
Rates of Medicaid/CHIP, individual market, and employer health insurance coverage have all grown from 2013 to 2023 as uninsurance fell: Medicaid/CHIP rising to 19.0% (from 15.6%); individual coverage rising to 7.6% (from 6.2%); employer-sponsored insurance coverage rising to 61.7% (from 58.8%)2.
Explore these changes over time with the interactive data visualization below.
Varied Populations Have Seen Significant Decreases in Uninsurance Since ACA Implementation
Though many gaps in coverage persist by key populations such as by age, race and ethnicity, income, and education level, decreases in rates of uninsurance have been broad based, with many groups within the United States gaining health insurance coverage.
Among the populations shown in the chart below, all but one experienced statistically significant decreases in rates of uninsurance, with many seeing substantial decreases in rates of uninsurance3. Among all measured groups, the groups with the largest percentage point (PP) decreases in rates of uninsurance between 2013 and 2023 were:
- Non-U.S. citizens (15.7PP, down from 45.8% to 30.1%)
- People with limited English proficiency (14.9PP, down from 38.3% to 23.4%)
- People age 26-34 (12.6PP, down from 26.1% to 13.5%)
- Adults working part time (12.5PP, from 23.4% to 10.9%), and
- People age 19-25 (12.4PP, down from 25.2% to 12.8%).
Interact with the visualization below to see the changes in uninsurance rates for a variety of groups & populations.
All States Have Made Progress on Uninsurance Since ACA Implementation
As shown in the chart below, all U.S. states and D.C. have made substantial progress since ACA implementation in 2013 on getting more people covered with health insurance and reducing uninsured rates. In fact, between 2013 and 2023, all states but Wyoming have reduced their uninsured rates by at least a quarter, 18 states have cut their uninsured rate by more than half, and five states—California, Kentucky, Michigan, Oregon, and Rhode Island—have cut their uninsured rates by 60% or more.
View these state-level changes over time between 2013 and 2023 with the interactive visualization below.
However, despite the historic expansion of coverage under the ACA, more than 26 million Americans remain uninsured; nearly 40% of whom (10.3 million) would be income-eligible for expanded Medicaid coverage but live in one of the handful of states that have yet to adopt the Medicaid expansion4.
Other remaining uninsured Americans are eligible for Medicaid coverage or subsidized individual coverage, but are not enrolled in coverage. Those who are eligible but not enrolled could not know that they are eligible for coverage, or perhaps experience administrative or other barriers in obtaining coverage.
SHADAC to Continue Monitoring Coverage Changes and Medicaid/CHIP Policy
The ACA has expanded coverage to millions of Americans. SHADAC is committed to monitoring changes in coverage over time as federal and state governments make changes to critical coverage programs like Medicaid/CHIP and subsidized individual market coverage and state insurance exchanges. Stay up to date with the latest information by joining our mailing list.
Visit SHADAC’s State Health Compare for more data on health insurance coverage across the states, including state-level breakdowns for the key subpopulations shown here, among others.
Notes
[1] In addition to expanding coverage, the ACA also substantially overhauled regulation of the health insurance coverage and the health care system.
[2] CHIP stands for the Children’s Health Insurance Program.
[3] People with family incomes of $75,000 or greater saw a statistically significant 0.2 percentage point increase in the rate of uninsurance between 2013 and 2023, increasing from 3.3% to 3.5%.
[4] The U.S. Supreme Court ruled that states could opt out of the Medicaid expansion in National Federation of Independent Business v. Sebelius. Twelve states had not adopted the Medicaid expansion as of January 1, 2023, the time period covered in this analysis: Alabama, Florida, Georgia, Kansas, Mississippi, North Carolina, South Carolina, South Dakota, Tennessee, Texas, Wisconsin, and Wyoming. South Dakota and North Carolina adopted Medicaid expansion in 2023. (https://www.kff.org/status-of-state-medicaid-expansion-decisions/)