This post is a part of our Survey Data Season series where we examine data from various surveys that are released annually from the summer through early fall. Find all of the Survey Data Season series posts on our Survey Data Season 2025 page here.
In late June, the National Center for Health Statistics (NCHS) released health insurance coverage estimates for 2024 from the National Health Interview Survey (NHIS) as part of the NHIS Early Release Program. The rates of insurance and uninsurance captured in this report are the first available full-year 2024 coverage estimates from a federal survey.
These estimates also represent the first coverage estimates from the first full year after the April 2023 resumption of program-wide Medicaid redeterminations, known as the Medicaid “unwinding.” Most eligibility renewals had been processed by the end of 2024.
National-level estimates are available by breakdowns including age, sex, family income (as a measure of poverty status), race and ethnicity, and by state Medicaid expansion status.1
Public, Private, and Uninsurance Across All Ages
The uninsured rate for all ages was 8.2% in 2024 – not a statistically significant change from a rate of 7.6% in 2023, though it does represent approximately an additional 2.2 million people who reported no health insurance coverage. However, rates of public coverage fell significantly between the two years, dropping to 39.1% in 2024 from 40.5% in 2023.
Figure 1. Rates of Public Coverage, Private Coverage, and Uninsured (No Coverage) for All Ages in 2023 and 2024
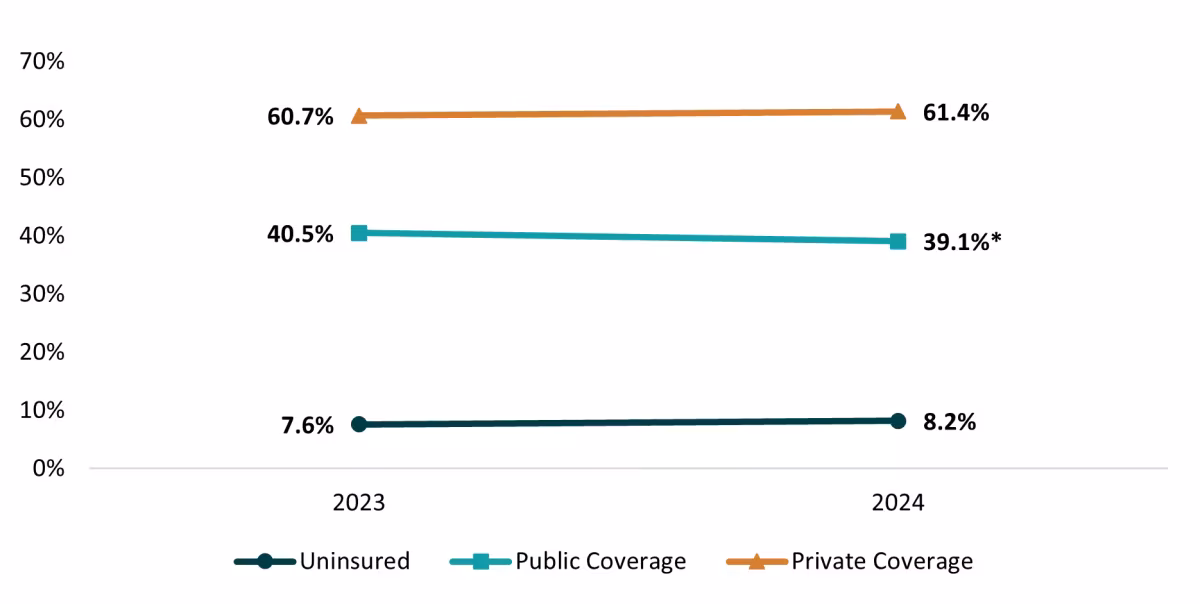
Source: SHADAC analysis of health insurance coverage data from the 2024 National Health Interview Survey (NHIS). *Statistically significant change at the 95% confidence level.
Rates of private insurance coverage were statistically unchanged across all ages from 2023 to 2024, measuring at 61.4% in 2024 (60.7% in 2023).
There Were Widespread Changes in Rates of Public Coverage
Now, we are going to take a look at changes in public health insurance coverage rates among various groups: by age, by state Medicaid expansion status, by federal poverty level, and by race/ethnicity.
Public Coverage Fell Among All Age Groups
All measured age groups experienced a significant decrease in their rate of public coverage from 2023 to 2024, including people of all ages, people younger than 65, children (age 0–17) and adults younger than 65.
Figure 2. Public Coverage Rates Across Age Groups in 2023 and 2024
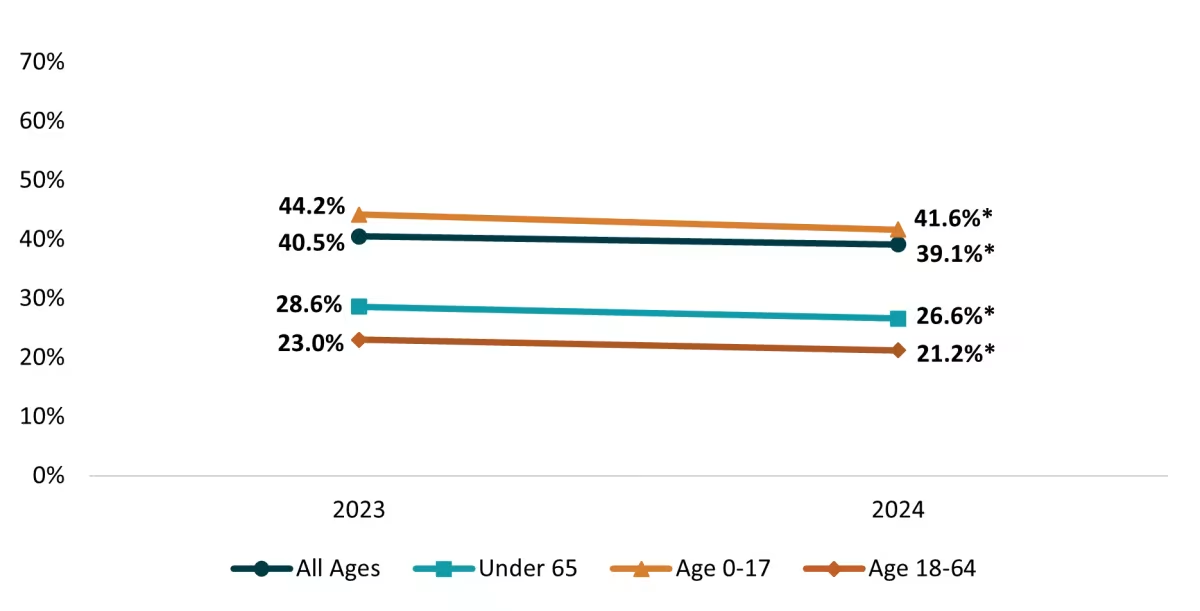
Source: SHADAC analysis of health insurance coverage data from the 2024 National Health Interview Survey (NHIS). *Statistically significant change at the 95% confidence level.
Children saw the largest change, with their rates of public coverage falling 2.6 percentage points (PP) to 41.6% in 2024 from 44.2% the year before.
Decreases in Public Coverage Were Widespread in Medicaid Non-Expansion States
All age groups experienced decreased public coverage rates in non-expansion states, with children (age 0-17) seeing the largest change from 2023 (48.9%) to 2024 (43.3%), a decrease of 5.6 PP. Nonelderly adults (age 18-64) also saw significant drops in public coverage from 2023 (18.1%) to 2024 (15.5%).
Nonelderly adults in states that have expanded Medicaid also experienced a decline in public coverage rates from 2023 (25.2%) to 2024 (23.4%).
Many Groups by Level of Poverty Saw Decreases in Public Coverage, Some Saw Increases in Uninsurance
The NHIS also measures insurance coverage by income level as a percentage of the federal poverty level. The federal poverty level (FPL) is the income threshold below which a “family,” and every individual in it, is considered to be in poverty.
Looking across the four family income levels measured as a percentage of poverty status (less than 100% FPL, 100-199% FPL, 200%-400% FPL, and 400%+ FPL), several groups saw changes in both public health insurance coverage and uninsurance between 2023 and 2024.
For children (age 0-17) and individuals under 65 whose income measured over 400% of the Federal Poverty Level (FPL), public insurance coverage rates dropped from 10.2% to 7.9% and 7.8% to 6.9% between the two years, respectively.
Two other groups also saw declines in public coverage from 2023 to 2024. Individuals under the age of 65 whose income was less 100% FPL saw a significant decrease in public coverage between 2023 (69.3%) and 2024 (65.4%). And nonelderly adults (age 18-64) whose incomes measured 100-199% FPL experienced a significant drop in public coverage from 2023 (43.9%) to 2024 (40.4%).
Figure 3. Public Coverage Rates for Individuals Under 65 by Income as Measure of Federal Poverty Level in 2023 and 2024
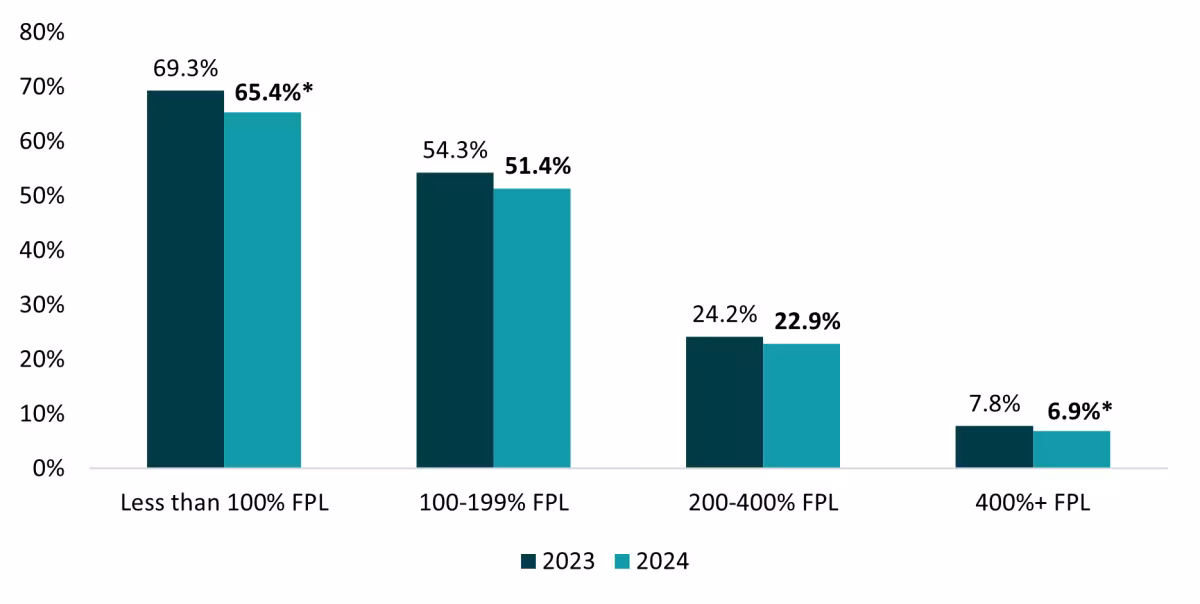
Source: SHADAC analysis of health insurance coverage data from the 2024 National Health Interview Survey (NHIS). *Statistically significant change at the 95% confidence level.
Interestingly, when looking at changes in uninsured rates by income, all age groups whose income measured between 200-400% FPL experienced an increase in uninsurance between 2023 and 2024.
Uninsured rates for individuals under 65 rose from 9.3% in 2023 to 11% in 2024. For children (age 0-17), uninsured rates climbed from 3.8% in 2023 to 5.6% in 2024. And for nonelderly adults (age 18-64), uninsured rates grew from 11.5% in 2023 to 13.1% in 2024.
Public Coverage Fell and Private Coverage Rose Among Hispanic/Latino People of All Ages
While most demographic groups did not experience coverage changes from 2023 to 2024, Hispanic adults and children were an exception.
Public coverage rates decreased significantly for Hispanic individuals under 65, falling from 38.7% in 2023 to 35.7% in 2024. Conversely, private insurance rose significantly, increasing from 43.5% in 2023 to 26.7% in 2024 for this same group.
Hispanic children (age 0-17) also experienced similar changes in insurance coverage rates between 2023 and 2024. Public coverage fell significantly for Hispanic children between 2023 (62.3%) and 2024 (57.0%). And again, private health insurance coverage rose between 2023 (32.2%) and 2024 (36.7%).
Figure 4. Rates of Public Coverage, Private Coverage, and the Uninsured for Hispanic Individuals Under 65 in 2023 and 2024
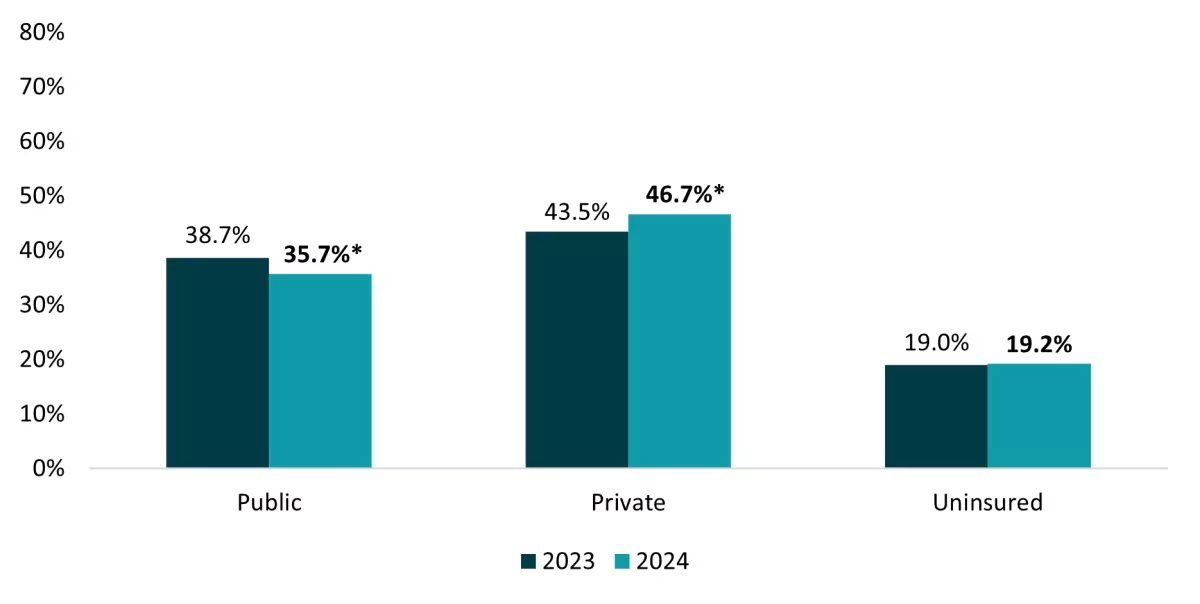
Source: SHADAC analysis of health insurance coverage data from the 2024 National Health Interview Survey (NHIS). *Statistically significant change at the 95% confidence level.
While other groups did not experience many health insurance coverage changes between the two years, there were several exceptions.
White individuals under 65 experienced a significant increase in uninsurance, rising from 5.8% in 2023 to 7.0% in 2024. White nonelderly adults (age 18-64) also saw a rise in uninsured rates from 2023 (6.8%) to 2024 (7.9%).
Notes About the Estimates
All changes described compare full-year 2023 data to full-year 2024 data and are statistically significant at the 95% confidence level unless otherwise specified.
Readers should note that the comparison year, 2023, was the year in which the process commonly known as or referred to as the “Medicaid unwinding” ended. The unwinding refers to the end of the requirement that Medicaid coverage for current enrollees be automatically renewed. This requirement ended on March 31, 2023, and on April 1, 2023, states began redetermination processes. Because of this mid-year shift, 2023 full-year estimates may not fully reflect the scope of all changes in the health insurance coverage landscape that are attributable to the unwinding. For instance, we note that public coverage rates broadly decreased from 2023 to 2024. However, NHIS data may not fully capture other coverage changes (such as moving from public coverage to either private coverage or being uninsured).
All category breakdowns (Sex, Income, Race/Ethnicity, and Medicaid Expansion Status) include estimates for individuals under 65 (age 0-64), nonelderly adults (age 18-64), and children (age 0-17), as adults 65 and older are eligible for Medicare.
The estimates provide a point-in-time measure of health insurance coverage, indicating the percentage of people with that type of coverage at the time of the interview.
Upcoming and Related Products
As noted earlier, these health insurance data from the NHIS are the first coverage estimates that reflect the full year of 2024. Data from other major federal surveys – the Medical Expenditure Panel Survey (MEPS), the Behavior Risk Factor Surveillance Systems (BRFSS), the Current Population Survey (CPS), and the American Community Survey (ACS) – are anticipated to be released in July, August and September (both the ACS and CPS), respectively.
SHADAC will be covering each of these releases, as we do every year, with a blog, infographic, report, or other product that shares key findings or important data to note from all surveys. Continue to follow us for more information and watch for notices about our annual webinar with the U.S. Census Bureau, where they will talk more in depth about estimates from two surveys they manage – the ACS and the CPS.
Head over to this page to find an archive of all products released as a part of our “Survey Data Season 2024” series. Stay tuned for 2025's page.
Source
Cohen, R.A., Briones, E.M., & Sohi, I. (2025, June 24). Health insurance coverage: Early release of estimates from the National Health Interview Survey, 2024. Division of Health Interview Statistics, National Center for Health Statistics (NCHS). https://www.cdc.gov/nchs/data/nhis/earlyrelease/insur202506.pdf
References
[1] The NHIS full-year estimates for 2024 do not include any state-level data, as has been the case since the survey was redesigned in 2019. However, NCHS periodically releases state-level estimates of coverage via specialized National Health Statistics Reports found here.
[2] The poverty definition is based on money income before taxes and does not include capital gains or non-cash benefits. The official FPL is calculated annually in order to reflect inflation by the Census Bureau and is used primarily for statistical purposes—for example, to estimate the number of Americans in poverty each year. For more on the federal poverty level and how it is used and calculated, SHADAC recently updated our resource on the topic.