With funding from the Blue Cross and Blue Shield of Minnesota Foundation, the State Health Access Data Assistance Center (SHADAC) recently released an updated version of the Minnesota Community and Uninsured Profile tool. This tool, available for download here, now includes the most up-to-date data from the U.S. Census Bureau’s American Community Survey (ACS), allowing users to explore uninsurance and community demographic data in Minnesota at various levels, by state, county, ZIP Code, and more.
A primary use for the Minnesota Community and Uninsured Profile is to give the state’s organizations, health insurance navigators, researchers, and general public important and comparable information about their communities to reach groups without health insurance and offer targeted resources that support coverage and access to health care.
Alongside the profile’s main Excel spreadsheet, SHADAC has also updated the interactive map that pairs with this tool. This interactive map allows users to visually and spatially explore key data and statistics sourced directly from the profile, including uninsured rates, counts, social vulnerability index (SVI), and more. The map can also show additional information, such as the location of community resources like schools and hospitals.
In this blog, we go step-by-step through some of the profile’s features, including examples of how one might use the profile spreadsheet and map to better understand Minnesota’s communities and their vulnerabilities.
A Snapshot of Uninsurance in Minnesota in 2024: Key State Stats
As of 2024, 4.7% of people in Minnesota were uninsured—this represents an estimated 265,121 individuals. Rates and counts of individuals without health insurance vary considerably by Census Defined ZIP Code (ZCTAs).
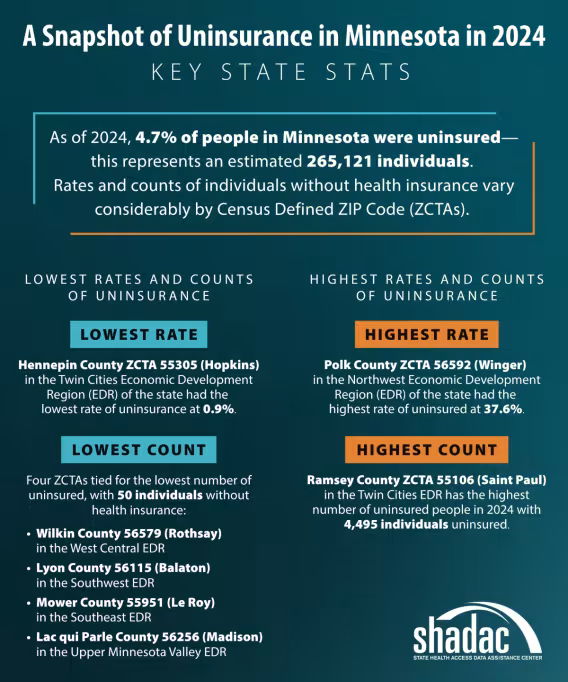
Lowest Rates and Counts of Uninsurance
- Rate - Hennepin County ZCTA 55305 (Hopkins) in the Twin Cities Economic Development Region (EDR) of the state had the lowest rate of uninsurance at 0.9%.
- Count - Four ZCTAs tied for the lowest number of uninsured, with 50 individuals without health insurance:
- Wilkin County 56579 (Rothsay) in the West Central EDR
- Lyon County 56115 (Balaton) in the Southwest EDR
- Mower County 55951 (Le Roy) in the Southeast EDR
- Lac qui Parle County 56256 (Madison) in the Upper Minnesota Valley EDR
Highest Rates and Counts of Uninsurance
- Rate - Polk County ZCTA 56592 (Winger) in the Northwest EDR of the state had the highest rate of uninsured at 37.6%;
- Count - Ramsey County ZCTA 55106 (Saint Paul) in the Twin Cities EDR has the highest number of uninsured people in 2024 with 4,495 individuals uninsured
Identifying Communities with High Rates and/or Counts of Uninsurance
One of the primary uses of the tool is to easily identify communities with high uninsurance, whether that’s a high overall rate of uninsurance or a high count of uninsured individuals. If you are interested in identifying the communities with the most individuals without health insurance coverage, the “ZIP Code Uninsured Rates” tab in the profile’s downloaded Excel file is a great place to start.
Again, estimates of the uninsured in a given community are provided in two ways: Rates (percentage of uninsured in a community) and counts (number of uninsured individuals in a community).
As you can see in the table below, the ZIP Codes [and the Economic Development Regions (EDR) and counties where they reside] with the highest proportions, or rates, of the uninsured are found in Greater Minnesota, i.e., not in the metro area; ZCTAs with the highest counts of uninsured people are concentrated in the metropolitan area.
Table 1. Minnesota ZIP Codes with the Highest Counts and Rates of Uninsurance, 2024
Top 5 Uninsured by Count | Top 5 Uninsured by Rate |
|---|---|
Twin Cities EDR, Ramsey County, 55106 | Northwest EDR, Polk County, 56592 |
Twin Cities EDR, Dakota County, 55337 | North Central EDR, Todd County, 56437 |
Twin Cities EDR, Ramsey County, 55119 | North Central EDR, Todd County, 56440 |
Twin Cities EDR, Hennepin County, 55429 | Southeast EDR, Fillmore, 55922 |
Twin Cities EDR, Hennepin County, 55408 | Headwaters EDR, Clearwater, 56634 |
Delving Deeper: Discovering Characteristics of Communities with High Uninsurance
In order to drill deeper into the characteristics of a community with a high number of uninsured, we can head to the “Uninsured Profile” tab in the profile’s Excel spreadsheet. In the orange box at the top of the profile, you can enter the specific area that you are interested in, such as the county name, ZIP Code, and even “Minnesota” overall.
For example, let’s say we want to learn more about the community in Dakota County associated with the ZCTA 55337, an area where 8.5% of the community are uninsured (over 4,000 people). We click the “Uninsured Profile” tab and enter the ZIP Code in the orange box at the top of the profile.
This will populate more detailed information about the characteristics of the uninsured in the entered ZIP Code in Rows 10–75.
For example, the profile tool reveals that in 2024 in Dakota County ZIP Code 55337:
- 16.4% of people (7,726 individuals) have incomes below 138% of the poverty level (which approximates Medicaid eligibility).
- 22.5% of the people in this community that have this income level are uninsured: That’s almost half (43.3%) of the total number of uninsured individuals in this community.
- 15% of people report identifying as Black; 19.5% of people in this area that identify as Black are uninsured. That’s 35% of the total number of uninsured individuals in this community.
- 12.5% of people report having a disability; 8.8% of the people in this community with a disability are uninsured, which is 12.9% of the total uninsured.
Breaking down the overall data by these and other characteristics can help to reveal disproportionate impacts within specific communities; targeting or tailoring programs to these communities could help in improving health insurance coverage and health care access.
Beginning on Row 78 of this tab is additional socioeconomic information about individuals associated with ZIP Code. For example, users can see the number of households in this community receiving Supplemental Security Income (SSI) (691, or 3.6% of, households in ZIP Code 55337) and the number of households reporting having access to Food Stamp/SNAP benefits in the last 12 months (1,150, or 6% of, households in ZIP Code 55337).
Interested in zooming out to explore the characteristics of a larger community? Users can enter counties (like “Dakota”) and MNSure Areas (like “Area 8”, which includes Dakota County) in the orange box at the top of the profile to review those communities’ characteristics to get a bigger picture of uninsurance in different areas of the state.
If we do this for ZIP Code 55337’s county, “Dakota”, for example, we can see that:
- 4.2% of people are uninsured
- 9.3% have incomes below 138% of the poverty threshold
- 13.0% of those at that income level are uninsured, which is 29.0% of the total number of uninsured individuals in this community.
Using the Profile’s Companion Interactive Map to Explore Minnesota Communities
Another way to identify and explore communities, their uninsured rates, and other characteristics is to use SHADAC’s accompanying interactive map. The map consists of several “layers,” including:
Statistics (2024 Data)
- Rate of Uninsured by ZCTA
- Regional Hotspots According to Uninsured Rates
- Regional Hotspots According to Uninsured Counts
- Social Vulnerability Index (SVI) by ZCTA
Geographic Areas or Boundaries
- Economic Development Regions (EDRs)
- Federally Recognized Tribes
- MNSure Areas
- House districts
- Senate districts
- Counties
- Minnesota
Resources
- Hospitals
- Public School Buildings
Once you click the link to open the map, click on the ArcGIS software layers icon on the top left area of the map screen to open a list of the available layers and a map legend tab. To choose what is displayed on the map, click the “eye” symbol next to toggle the layer or layers you would like shown.
Let’s look at a commonly used layer that many utilize to identify areas in need of coverage support: Rates of Uninsured by ZCTA.
Figure 1. Rates of Uninsured by ZCTA in Minnesota, Map, 2024
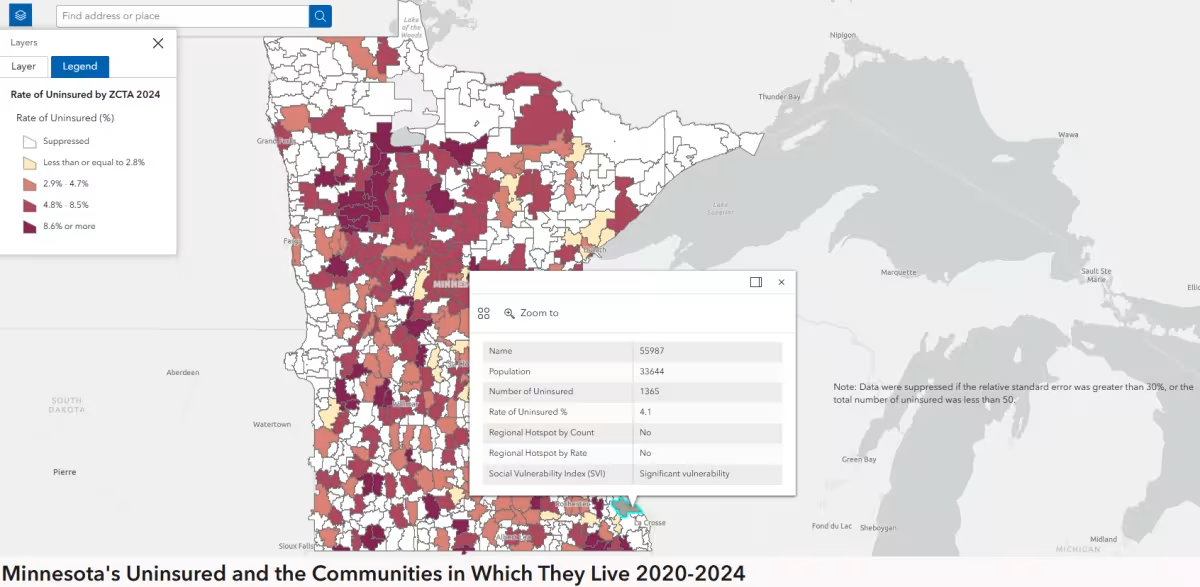
The darkest red shading associated with the Rate of Uninsured by ZCTA 2024 layer points users to the areas with the highest rates of uninsurance in the state (according to the map’s legend, the darkest red indicates ZIP Codes with uninsurance rates of 8.6% or more, well above Minnesota’s overall rate of 4.7%). The map also allows you to see more details via a popup feature: If users click on an area of interest, a popup box will appear with additional information about that area, e.g., ZIP Code, number and rate of uninsured, whether the area is regional hotspot, and its level of social vulnerability.
In both the tool and the map, users can explore the level of social vulnerability associated with specific ZCTAs in the state of Minnesota as defined by the Center for Disease Control’s (CDC) Social Vulnerability Index (SVI). SVI is a place-based measure based on a variety of demographic and/or socioeconomic factors (such as poverty, employment, transportation, and housing access, household characteristics, etc.) that suggests a community may need support to better prepare for, respond to, and recover from public health crises. Communities can be rated as one of four levels of social vulnerability: “Least”, “Some”, “Significant”, and “Most”.
Below, we toggled both the SVI layer and the Rates of Uninsured by ZIP Code layer zooming in on the Twin Cities metro area to see where there could be overlap.
Figure 2. Social Vulnerability Index and Rates of Uninsured by ZCTA in the Twin Cities Metro Area, Map, 2024
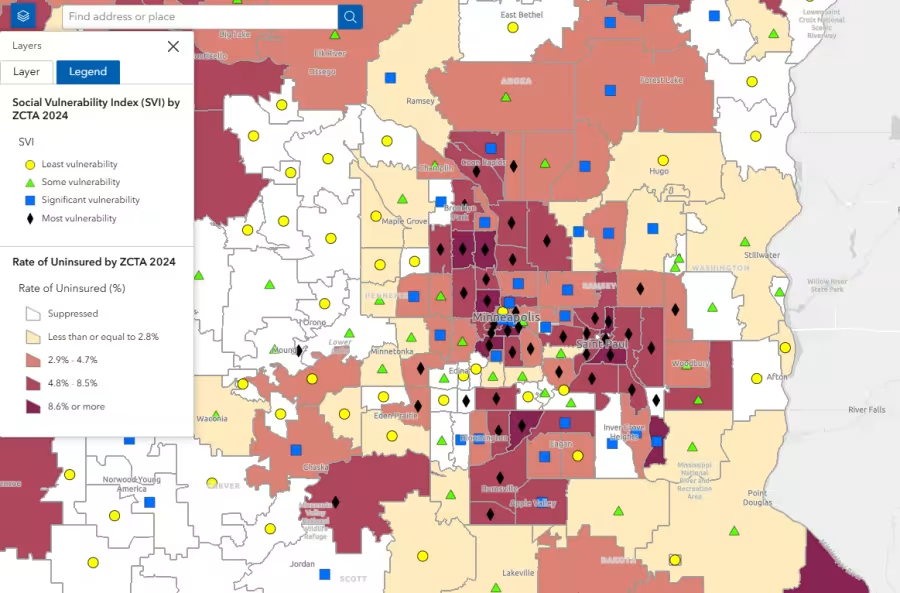
As we can see on the map, many of the dark and darkest red areas, the areas with the highest rates of uninsurance, are also rated as having the “Most vulnerability” (shown with a black diamond symbol). However, important to note is that the areas with the highest uninsurance rates do not always have the highest level of vulnerability, as is true with areas that have low uninsured rates not necessarily having the lowest level of vulnerability as a number of factors can impact a community’s SVI beyond uninsurance.
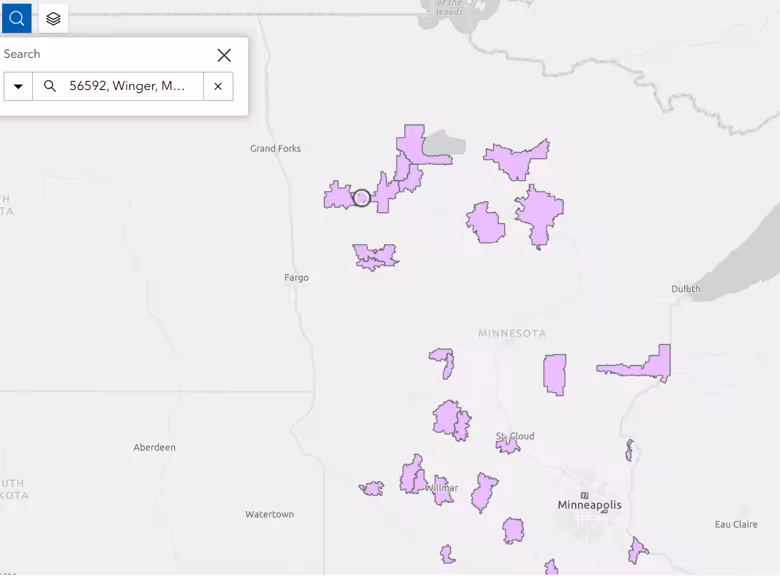
Another statistic available on the map is regional hotspots. Regional hotspots are defined as ZCTAs that are among the three highest number of uninsured (regional hotspot by count) and/or the three highest rates of uninsurance (regional hotspots by rate) within each Economic Development Region (EDR). Users can also use the “search” feature on the map to highlight specific towns and ZIP Codes to easily see if it falls in a regional hotspot or EDR. For example, ZIP Code 56592 (Winger) had one of the highest uninsured rates at 37.6% and it is also designated as a regional hotspot because it is one of the three highest rates within the Northwest economic development region (EDR). See Figure 3 for Regional Hotspots shaded lavender and ZIP Code 56592 circled in black.
Figure 3. Regional Hotspots According to Uninsured Rates by ZCTA 2024
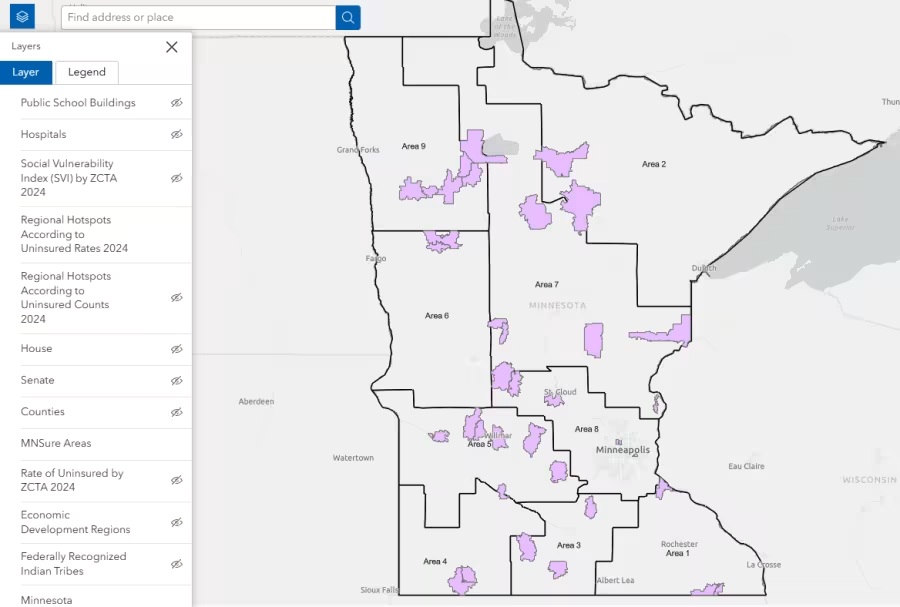
As we saw in Figure 2, users can also turn on multiple layers at a time. Let’s look at another example of using multiple layers of the map: When the regional hotspot by uninsurance rate layer and the MNSure Areas layer are displayed simultaneously, one can see that MNSure Areas 5, 7, 8, and 9 appear to include several regional hotspots (see Figure 4).
Figure 4. Regional Hotspots by ZCTA Uninsurance Rates and MNSure Areas, Map, 2024
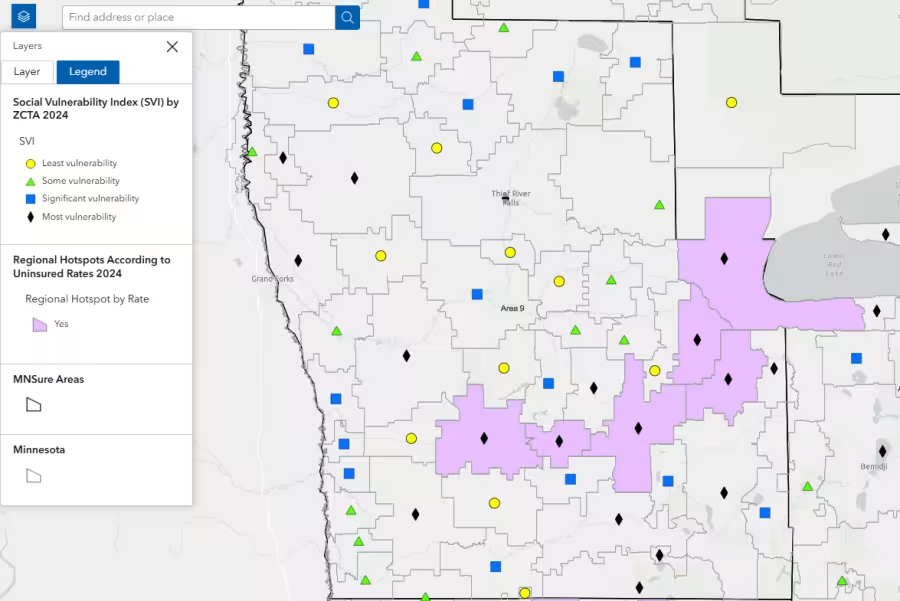
If we zoom in on MNSure Area 9 and toggle the SVI layer on, one can see that the majority of regional hotspots by rate are ZCTAs with the most social vulnerability.
Figure 5. Regional Hotspots by Uninsurance Rates and Level of Social Vulnerability by ZCTA in MNSure Area 9, Map, 2024
Minnesota’s Uninsured and the Communities in Which They Live: Why This Matters
By combining uninsurance rates, social vulnerability, regional context, and community sociodemographic information, this profile and map help paint a picture of where help is most needed in Minnesota. We hope these resources allow users to better understand, communicate, and respond to community needs.
While data in the profile are as recent as 2024, they can be used to characterize a “baseline” to monitor the potential impact of recent policy changes on communities and the organizations serving them. For example, the passage of One Big Beautiful Bill Act (OBBBA), signed into law in 2025, will tighten eligibility and reduce federal funding for public health insurance coverage; coverage losses are projected. The need for sound data and the ability to explore key demographics at low levels of geography will be increasingly important to identify and target resources to meet needs in Minnesota’s communities. Data and maps available in the profile could also be used by rural providers seeking funds being made available through the new federal Rural Health Transformation Program.
How Will You Use Minnesota’s Community and Uninsured Profile?
For more information about this project, check out our resource page where you can also find the download link for the Excel tool and the link to interactive map whenever you need it. The page also includes other details on the project and a helpful video tutorial (based on a previous version of the tool).
We would love to hear how you use this tool to learn more about health care access and coverage in Minnesota - post and tag us on LinkedIn or let us know your progress and findings by contacting SHADAC here.