Partnered with the Blue Cross Blue Shield of Minnesota Foundation, SHADAC has, for many years, created and updated a resource that allows users to explore data and information on those who do not have health insurance in Minnesota (also called the uninsured population).
The tool itself, the Minnesota Community and Uninsured Profile, provides detailed information on Minnesota uninsured population characteristics including age, sex, race/ethnicity, geographical location (by county, region, ZIP code, etc.) and more. The hope is that the more information and data we have on the uninsured in Minnesota, the more targeted and intentional enrollment and outreach efforts can be to provide health care and health care access to this group.
Our researchers have also created an interactive map as a part of the uninsured profile. Our updated uninsured profile mapping tool helps make complex health data easier to explore and understand, providing a visual companion to the tool’s Excel spreadsheet. Instead of navigating through spreadsheets or reports, the map component allows users to view key statistics, like the number and rate of uninsured, across Minnesota in a visual, interactive map.
In this post, we’ll explore the uninsured map’s features and how you can use it to explore uninsurance and health care access in Minnesota.
What You’ll Find on the Map
On this interactive map, we wanted to include a variety of available statistics, information, and features that can help users better understand the many factors that can (and likely do) impact health care access and health insurance coverage in Minnesota.
In the interactive map, we include the following “core” statistics about uninsured communities in Minnesota: population, number of uninsured, and rate of uninsured. These core statistics are available at the following levels of geography:
- State
- Economic development region (EDR)
- MNSure rating area
- County
- State senate district
- State house district
- ZIP code tabulation area (ZCTA)
For ZCTAs, information on regional hotspots and social vulnerability indexes (SVIs) is also provided.
Ways to Dig Into the Uninsured Population in MN Using SHADAC’s Interactive Map
The full Community and Uninsured Profile spreadsheet contains a large amount of information - it can be overwhelming for some users. This map is a great starting point for exploring our BCBS uninsured profile tool, letting you explore the core data contained in the spreadsheet tool visually and, for many, dig into it more easily.
Users can employ the map to spot areas that stand out, whether they have high uninsured rates or increased social vulnerability compared to other areas, then dive deeper by inputting those areas into the full profile tool for more detail. For example, ZCTAs are color coded so that users can quickly identify communities with the highest rate of uninsured. Then, users could plug ZCTA codes of interest into the tool to learn more about that specific community’s characteristics.
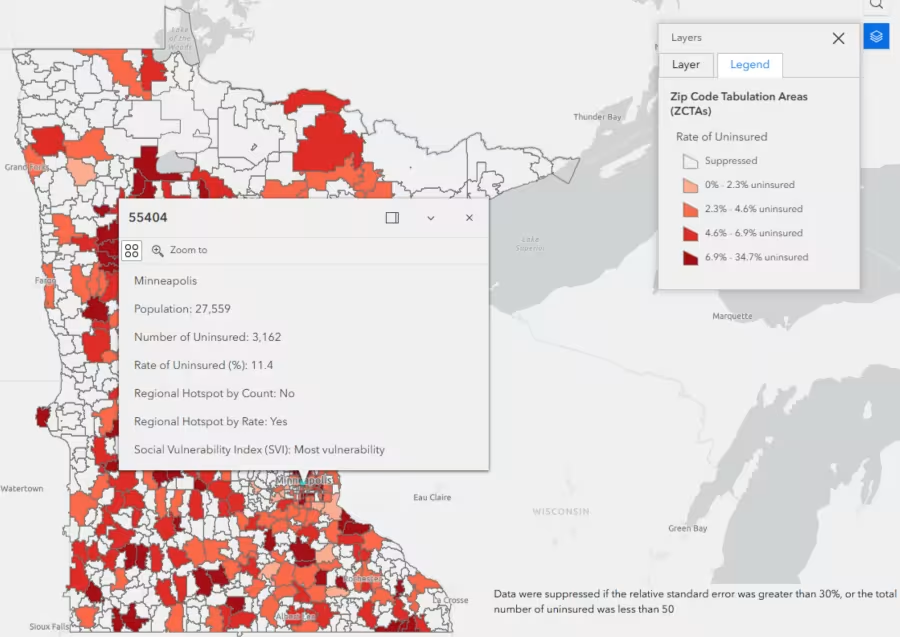
For example, we noticed on the map that ZCTA 55404 appeared to have a higher rate of uninsurance compared to some surrounding areas.
Figure 1. Uninsurance Rates and Other Available Information by ZCTA-Level, Map
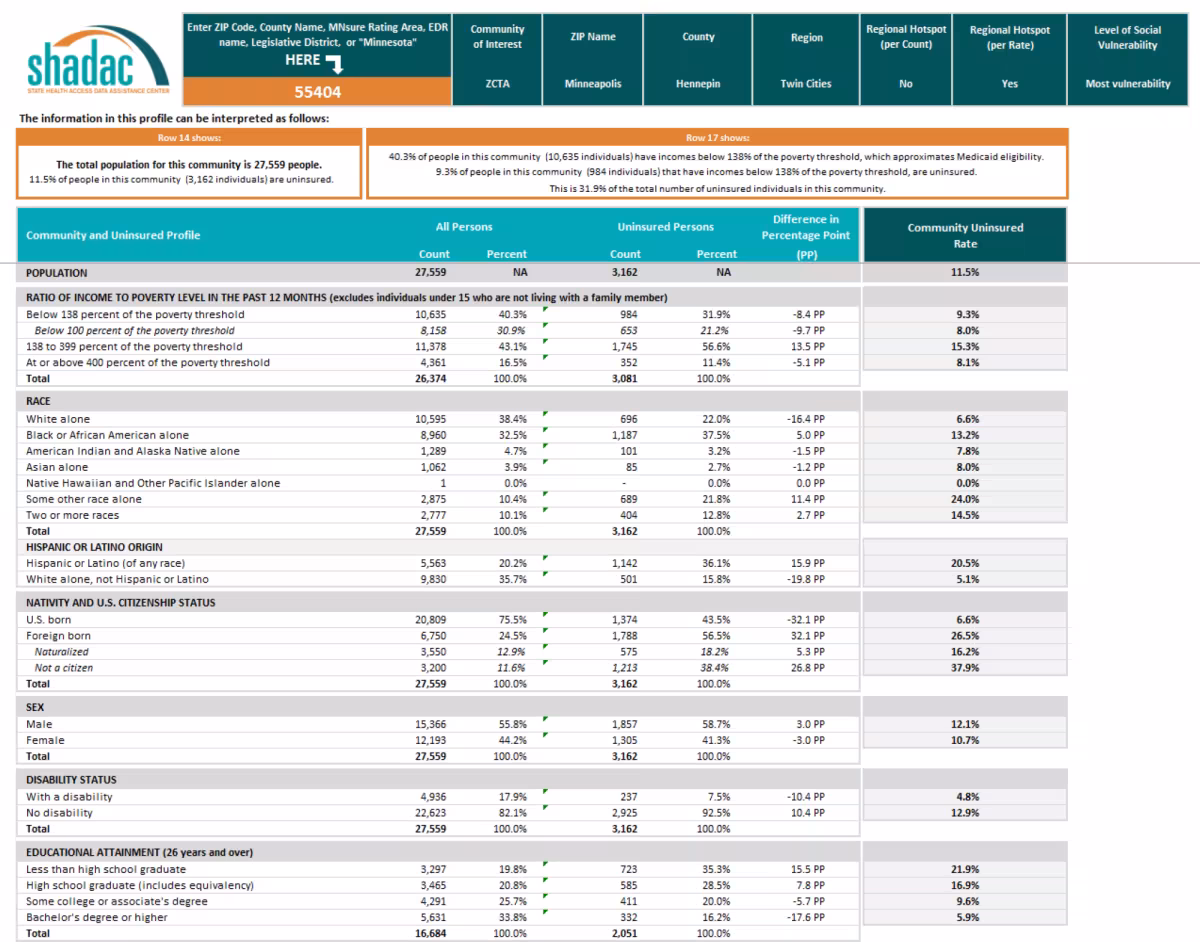
When we plug that zip code into the profile tool, we are able to see that the uninsured community in this area includes many more foreign-born individuals than the total population in this area (32.1 PP more) and the highest level of educational attainment of about 35% of uninsured persons in this ZCTA is ‘less than high school graduate’ (compared to just under 20% for the total population in this area), along with several other statistics.
Figure 2. Uninsured Profile Displays Statistics & Info on Uninsured Community for ZIP Code 55404
Using Multiple Layers
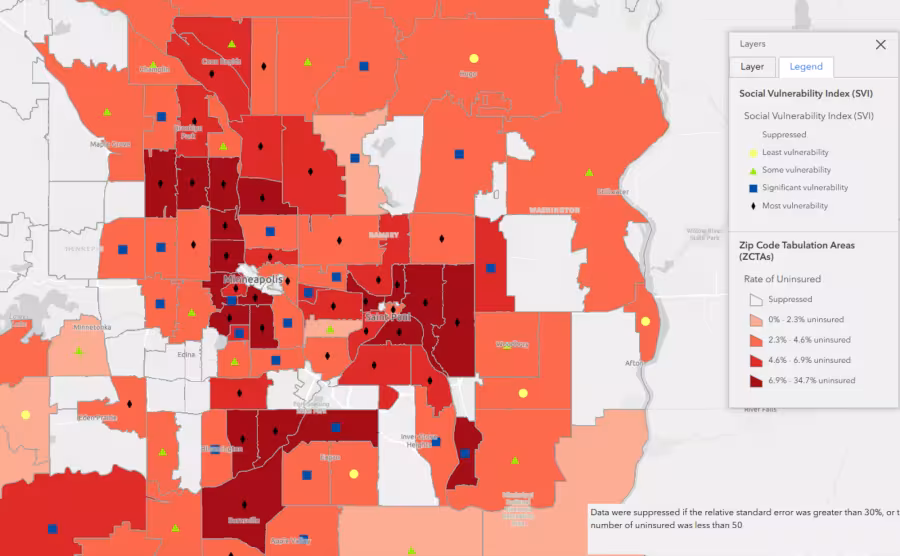
Users can also turn multiple layers of the map on and off to explore relationships between different data points. For example, by toggling the ZCTA and Social Vulnerability Index (SVI) layers simultaneously, users can visually identify areas that have a high rate of uninsurance and have higher levels of social vulnerability, areas that have a low rate of uninsurance and least social vulnerability, or somewhere in between using the color coding and symbols from the map's legend.
For example, when we toggled the ZCTA and SVI layers (seen in Figure 3 below), you can see that some zip codes have high levels of uninsurance and high social vulnerability where the dark red (high uninsurance rate) and the black diamond symbol (most vulnerability) overlap.
Similarly, you can see zip codes that have low uninsurance rates along with least vulnerability where the lightest pink and the yellow circle symbol overlap. We can use these layers to quickly identify both uninsurance and SVI in particular areas, making note of where there are differences and interesting combinations (like lower uninsurance with significant vulnerability, for example) that could be further explored using the profile tool.
Figure 3. Twin Cities Metro Area ZCTA-Level Uninsurance Rates and Social Vulnerability Index (SVI), Map
Regional Hotspots
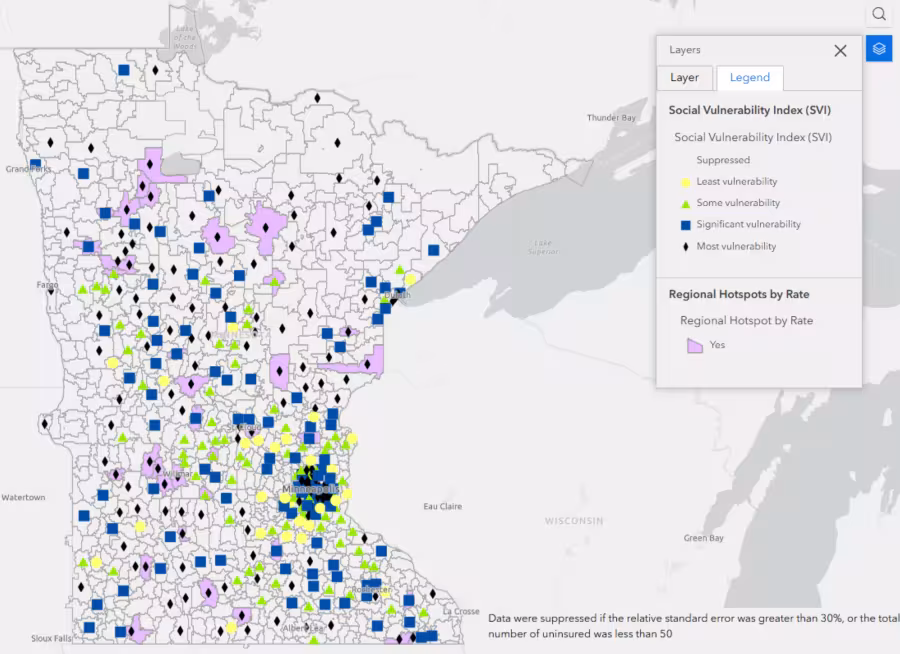
Regional hotspots are defined as ZCTAs that are among the three highest number of uninsured (regional hotspot by count) and/or the three highest rate of uninsurance (regional hotspots by rate) within each Economic Development Region. These areas can be easily identified by turning on the hotspot layers. Users can also turn on the hotspot layers and the SVI layer simultaneously.
By doing so, one can see in the screenshot of the map below that the vast majority of regional hotspots by rate are ZCTAs with the most social vulnerability.
Figure 4. Regional Hotspots by Rate and Social Vulnerability Index (SVI) in Minnesota, Map
Additional Map Layers: Schools, Hospitals, Reservations, and More
The map also has resource layers that show the location of schools and hospitals in the state. A layer that shows the reservations in the state is also available.
This gives users an idea of the resources that are available to people in a certain area and provides additional context about communities. Though the reservation layer does not provide detailed information at this time, users can turn this layer on and see which ZCTAs it overlaps with for an idea of the uninsurance statistics in this area.
Figure 5. School Locations in Minnesota, Map
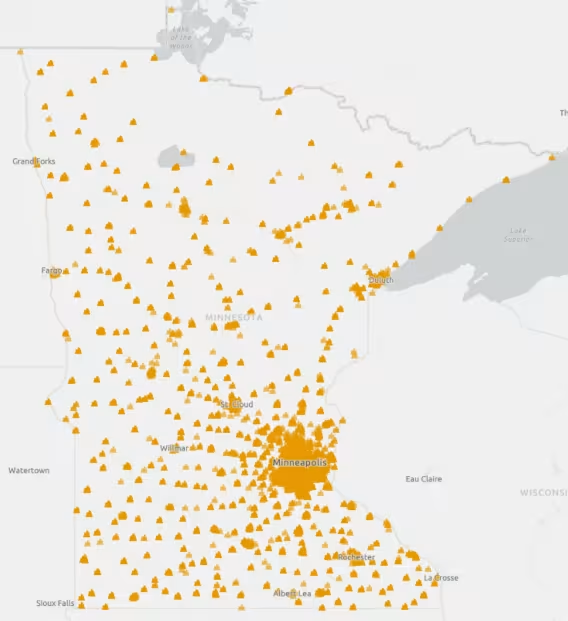
So, for example, with only the school layer turned on, we can see that schools, and perhaps comparable resources, are highly concentrated in population centers like the Twin Cities, Duluth, and Rochester.
Minnesota State House and Senate districts offer another compelling lens for exploring disparities. Each district is drawn to contain a similar number of Minnesotans, but they can differ greatly in both the rate of uninsurance and levels of social vulnerability. By turning on the SVI layer alongside these district boundaries, users can uncover stark contrasts between legislative areas.
For example, while many districts in Greater Minnesota and the Twin Cities include communities facing significant vulnerability, several districts just outside of the Twin Cities metro area experience lower social vulnerability, and the challenges they face differ in context and cause. This kind of comparison can help inform more equitable, place-based policymaking and advocacy by highlighting where support is most urgently needed.
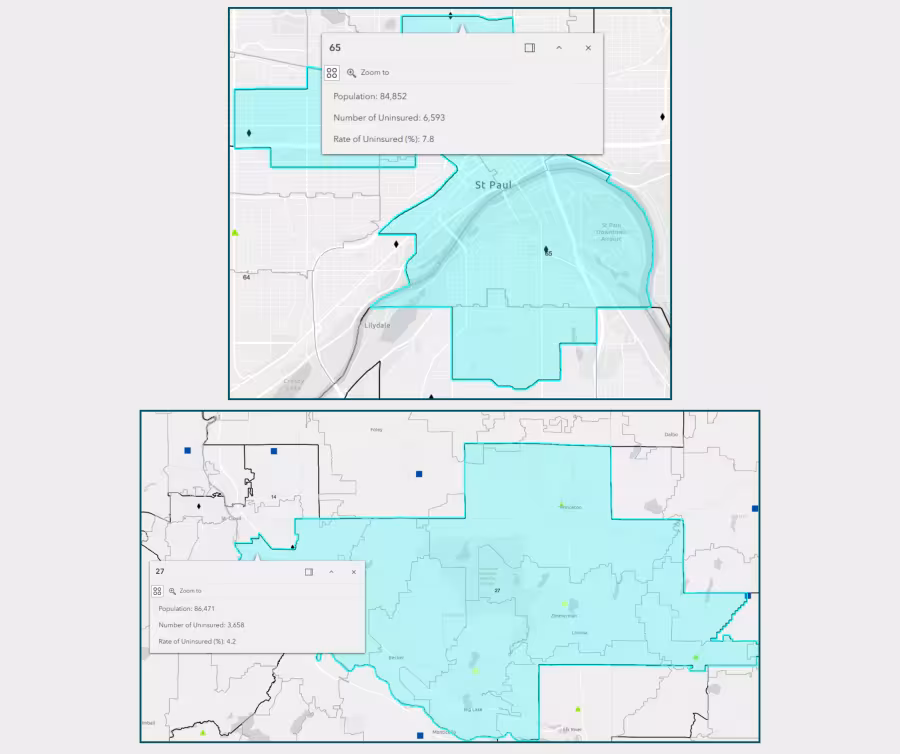
Let's look at a more specific example. When one toggles 'Senate' districts and Social Vulnerability Index on the map, we can see that MN Senate District 65 in the heart of St. Paul has several ZCTAs showing black diamonds, indicating a high level of social vulnerability. Conversely, District 27, a bit northwest of the Twin Cities Metro Area, includes ZCTAs showing yellow circles and green triangles, indicating low levels of social vulnerability.
Figure 6. Minnesota State Senate Districts 65 and 27 and Social Vulnerability Index, Compared
Why This Tool Matters
Health insurance coverage improves access to care, health outcomes, and individual, family, and community well-being, while also supporting appropriate health care utilization.1 Additionally, high rates of uninsurance increase stress on the broader health care system. Uninsured individuals may delay or forgo care due to cost, resulting in a greater likelihood of severe diseases requiring more intensive treatment and a heavier reliance on hospital emergency departments, resulting in scarce resources being used to treat conditions that likely could have been prevented or managed in a lower cost setting if addressed earlier.1
By combining uninsured rates, social vulnerability, and regional context, this tool helps paint a fuller picture of where help is most needed in Minnesota. We hope it empowers advocates, policymakers, and everyday Minnesotans alike to better understand and respond to the needs of their communities.
Start exploring this interactive map at this link. When you’re ready, download the full Community and Uninsured Profile to explore your map findings further.
For more information about this project, check out our resource page where you can also find the tool and map, along with details on the project and a helpful video tutorial on using the tool.
We would love to hear how you use this tool to learn more about health care access and coverage in Minnesota - post & tag us on LinkedIn or let us know your progress & findings by contacting our project leader, Robert Hest, at [email protected].
[1] American Hospital Association, "Report: The Importance of Health Coverage"