
Blog & News


NHIS: National Rates of Health Insurance Coverage for Third Quarter of 2021 Statistically Unchanged from 2020
January 25, 2022:On Wednesday, January 19, the National Center for Health Statistics (NCHS) announced that health insurance coverage estimates from the National Health Interview Survey (NHIS) Early Release Program are now available for Quarter 3 of 2021 (July-September)
At a high level, the new estimates show no significant changes in coverage type (public, private) or uninsured rate across all ages and income groups when compared to the same time period in 2020, as discussed below.
Age
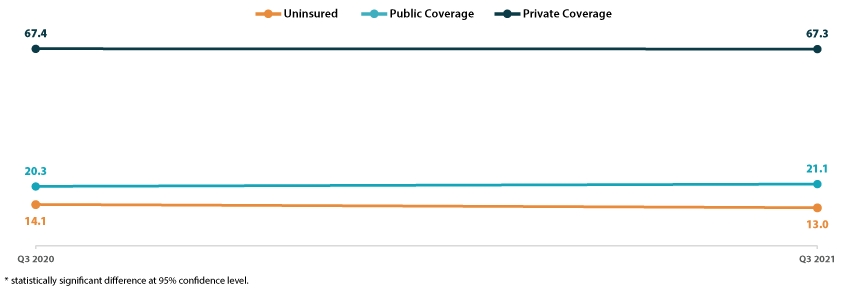
Among nonelderly adults (ages 18 to 64) surveyed between July and September of 2021, 13.0% were uninsured at the time of interview, 21.1% had public coverage, and 67.3% had private coverage. Comparatively, these rates measured at 14.1%, 20.3%, and 67.4% from July to September in 2020, as shown in Figure 1.
Figure 1. Type of Health Insurance Coverage Nonelderly Adults (18-64 years), Q3 2020 and Q3 2021
Poverty Level
Again among nonelderly adults at three differing thresholds of family income as a percentage of the federal poverty level (less than 100% FPL, 100%-199% FPL, and 200%+ FPL), rates of uninsurance as well as public and private coverage remained statistically unchanged in Q3 2021 from Q3 2020.
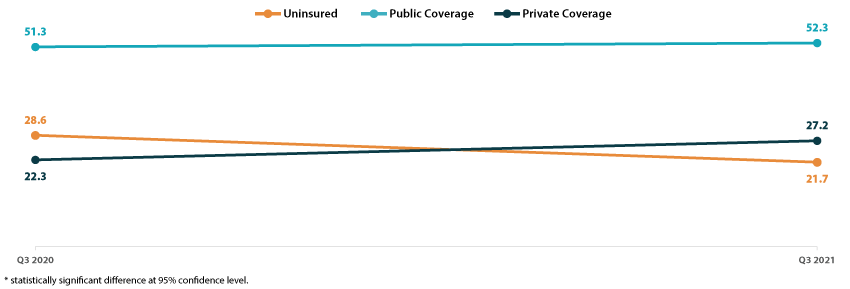
Looking at the below than 100% FPL category for nonelderly adults from July-September 2021, 21.7% were uninsured, 52.3% had public coverage, and 27.2% had private coverage. These rates were 28.6%, 51.3%, and 22.3%, respectively in 2020 (Figure 2).
Figure 2. Type of Health Insurance Coverage (<100% FPL) Nonelderly Adults (18-64 years), Q3 2020 and Q3 2021
COVID-19 and Cautions for 2020 NHIS Estimates
As has been extensively documented in reports from both SHADAC and NCHS, COVID-19 caused numerous disruptions to federal survey data collection and production efforts. For the NHIS in particular, personal visits were suspended beginning on March 19, 2020, and data collection in late Q1 and for all of Q2 in 2020 switched to a telephone-only mode. Personal visits (with telephone attempts first) resumed in all areas in September 2020.
Data collection methodologies were not the only casualty of the pandemic, however. While the initial NCHS report examined preliminary nonresponse bias in Q1 and Q2 of 2020, the same team published a follow-up report in September 2021 looking at effects of the pandemic on estimates for the entire year, including July to December 2020. Though in-person operations resumed, lingering concerns about low response rates and possible loss of coverage caused survey conductors to replace approximately half of the usual sample for the last 5 months of 2020 with a longitudinal component where a subset of the 2019 sample adults were re-interviewed over the telephone using the 2020 NHIS questionnaire. This process change means that comparisons between estimates from July–December 2020 and other time periods may be impacted by these differences in survey mode and methodology.
About the Numbers
The above estimates provide a point-in-time measure of health insurance coverage, indicating the percent of persons with that type of coverage at the time of the interview. The 2021 estimates discussed in this blog are only from Q3 (July-September) as well as the same period in 2020.
Differences described in this post are statistically significant at the 95% confidence level unless otherwise specified.
Citations
Cohen, R.A. & Cha, A.E. (2022, January 19). Health Insurance Coverage: Early Release of Quarterly Estimates from the National Health Interview Survey, July 2020–September 2021. National Center for Health Statistics (NCHS). https://www.cdc.gov/nchs/data/nhis/earlyrelease/Insur201902.pdf.
Dahlhamer, J.M., Bramlett, M.D., Maitland, A., & Blumberg, S.J. (February 2021). Preliminary evaluation of nonresponse bias due to the COVID-19 pandemic on National Health Interview Survey estimates, April-June 2020. National Center for Health Statistics (NCHS). https://www.cdc.gov/nchs/data/nhis/earlyrelease/nonresponse202102-508.pdf
Bramlett, M.D., Dahlhamer, J.M., & Bose, J. (September 2021). Weighting procedures and bias assessment for the 2020 National Health Interview Survey. National Center for Health Statistics (NCHS). https://ftp.cdc.gov/pub/Health_Statistics/NCHS/Dataset_Documentation/NHIS/2020/nonresponse-report-508.pdf
Blog & News

(Webinar) An Annual Conversation with the U.S. Census Bureau: Addressing Data Quality Challenges in the 2020 American Community Survey
January 5, 2022:Impacts of the COVID-19 pandemic have been demonstrably far reaching and, by now, fairly well documented. One facet of this COVID-related disruption that has recently come to light is the interruption to data collection processes and response patterns for yearly federal surveys, such as the U.S. Census Bureau's American Community Survey (ACS), that provide estimates of health insurance coverage for the United States population.
On Wednesday, January 19th, SHADAC researchers Kathleen Call and Robert Hest welcomed U.S. Census Bureau expert Mark Klee for a discussion regarding the unique challenges the Census Bureau faced in both data collection and production efforts for the 2020 ACS, resulting in a more limited set of "experimental" estimates being released this year.
Attendees had the opportunity to:
- Learn about impacts of the COVID-19 pandemic on 2020 estimates and data collection efforts in the ACS
- Learn about the methodology behind the production of the 2020 ACS experimental estimates
- Learn about 2020 ACS-related products from both the Census Bureau and SHADAC
Experts Sharon Stern, Laryssa Mykyta, and Nicole Scaniello from the Census Bureau also be joined the webinar for an open forum question and answer session after the presentation.
Resources
Slides from both SHADAC and the U.S. Census Bureau are available to download.
SHADAC
- Comparing Federal Surveys Annual Brief (2021)
- U.S. Census Bureau Analytic Report Shows Significant Non-Response Bias in the 2020 American Community Survey (Blog)
- Current Population Survey (CPS) will Serve as Primary Source of 2020 State-level Data on Health Insurance (Blog)
- Current Population Survey Shows 2020 National Uninsured Rate Stable, Rising in Three States (Blog)
- 2021 CPS ASEC: Fewer Americans Had Health Insurance Coverage in 2020 — Private Coverage Fell while Public Coverage Rose (Blog)
Census Bureau
- An Assessment of the COVID-19 Pandemic’s Impact on the 2020 ACS 1-Year Data (Working Paper)
- Addressing Nonresponse Bias in the American Community Survey during the Pandemic Using Administrative Data (Working Paper)
- How Does the Pandemic Affect Survey Response: Using Administrative Data to Evaluate Nonresponse in the Current Population Survey Annual Social and Economic Supplement (Blog)
- The Influence of COVID-19-Related Data Collection Changes on Measuring Health Insurance Coverage in the 2020 CPS ASEC (Working Paper)
- How Did the Pandemic Affect Survey Response: Using Administrative Data Evaluate Nonresponse in the 2021 Current Population Survey Annual Social and Economic Supplement (Blog)
Blog & News

Coverage During a Crisis: Insured Rate for Californians Hits Historic High in First Year of COVID-19 Pandemic (CHCF Cross Post)
September 13, 2023:The following content is cross-posted from California Health Care Foundation. It was first published on January 12, 2022.
Author: Lacey Hartman, Senior Research Fellow, SHADAC
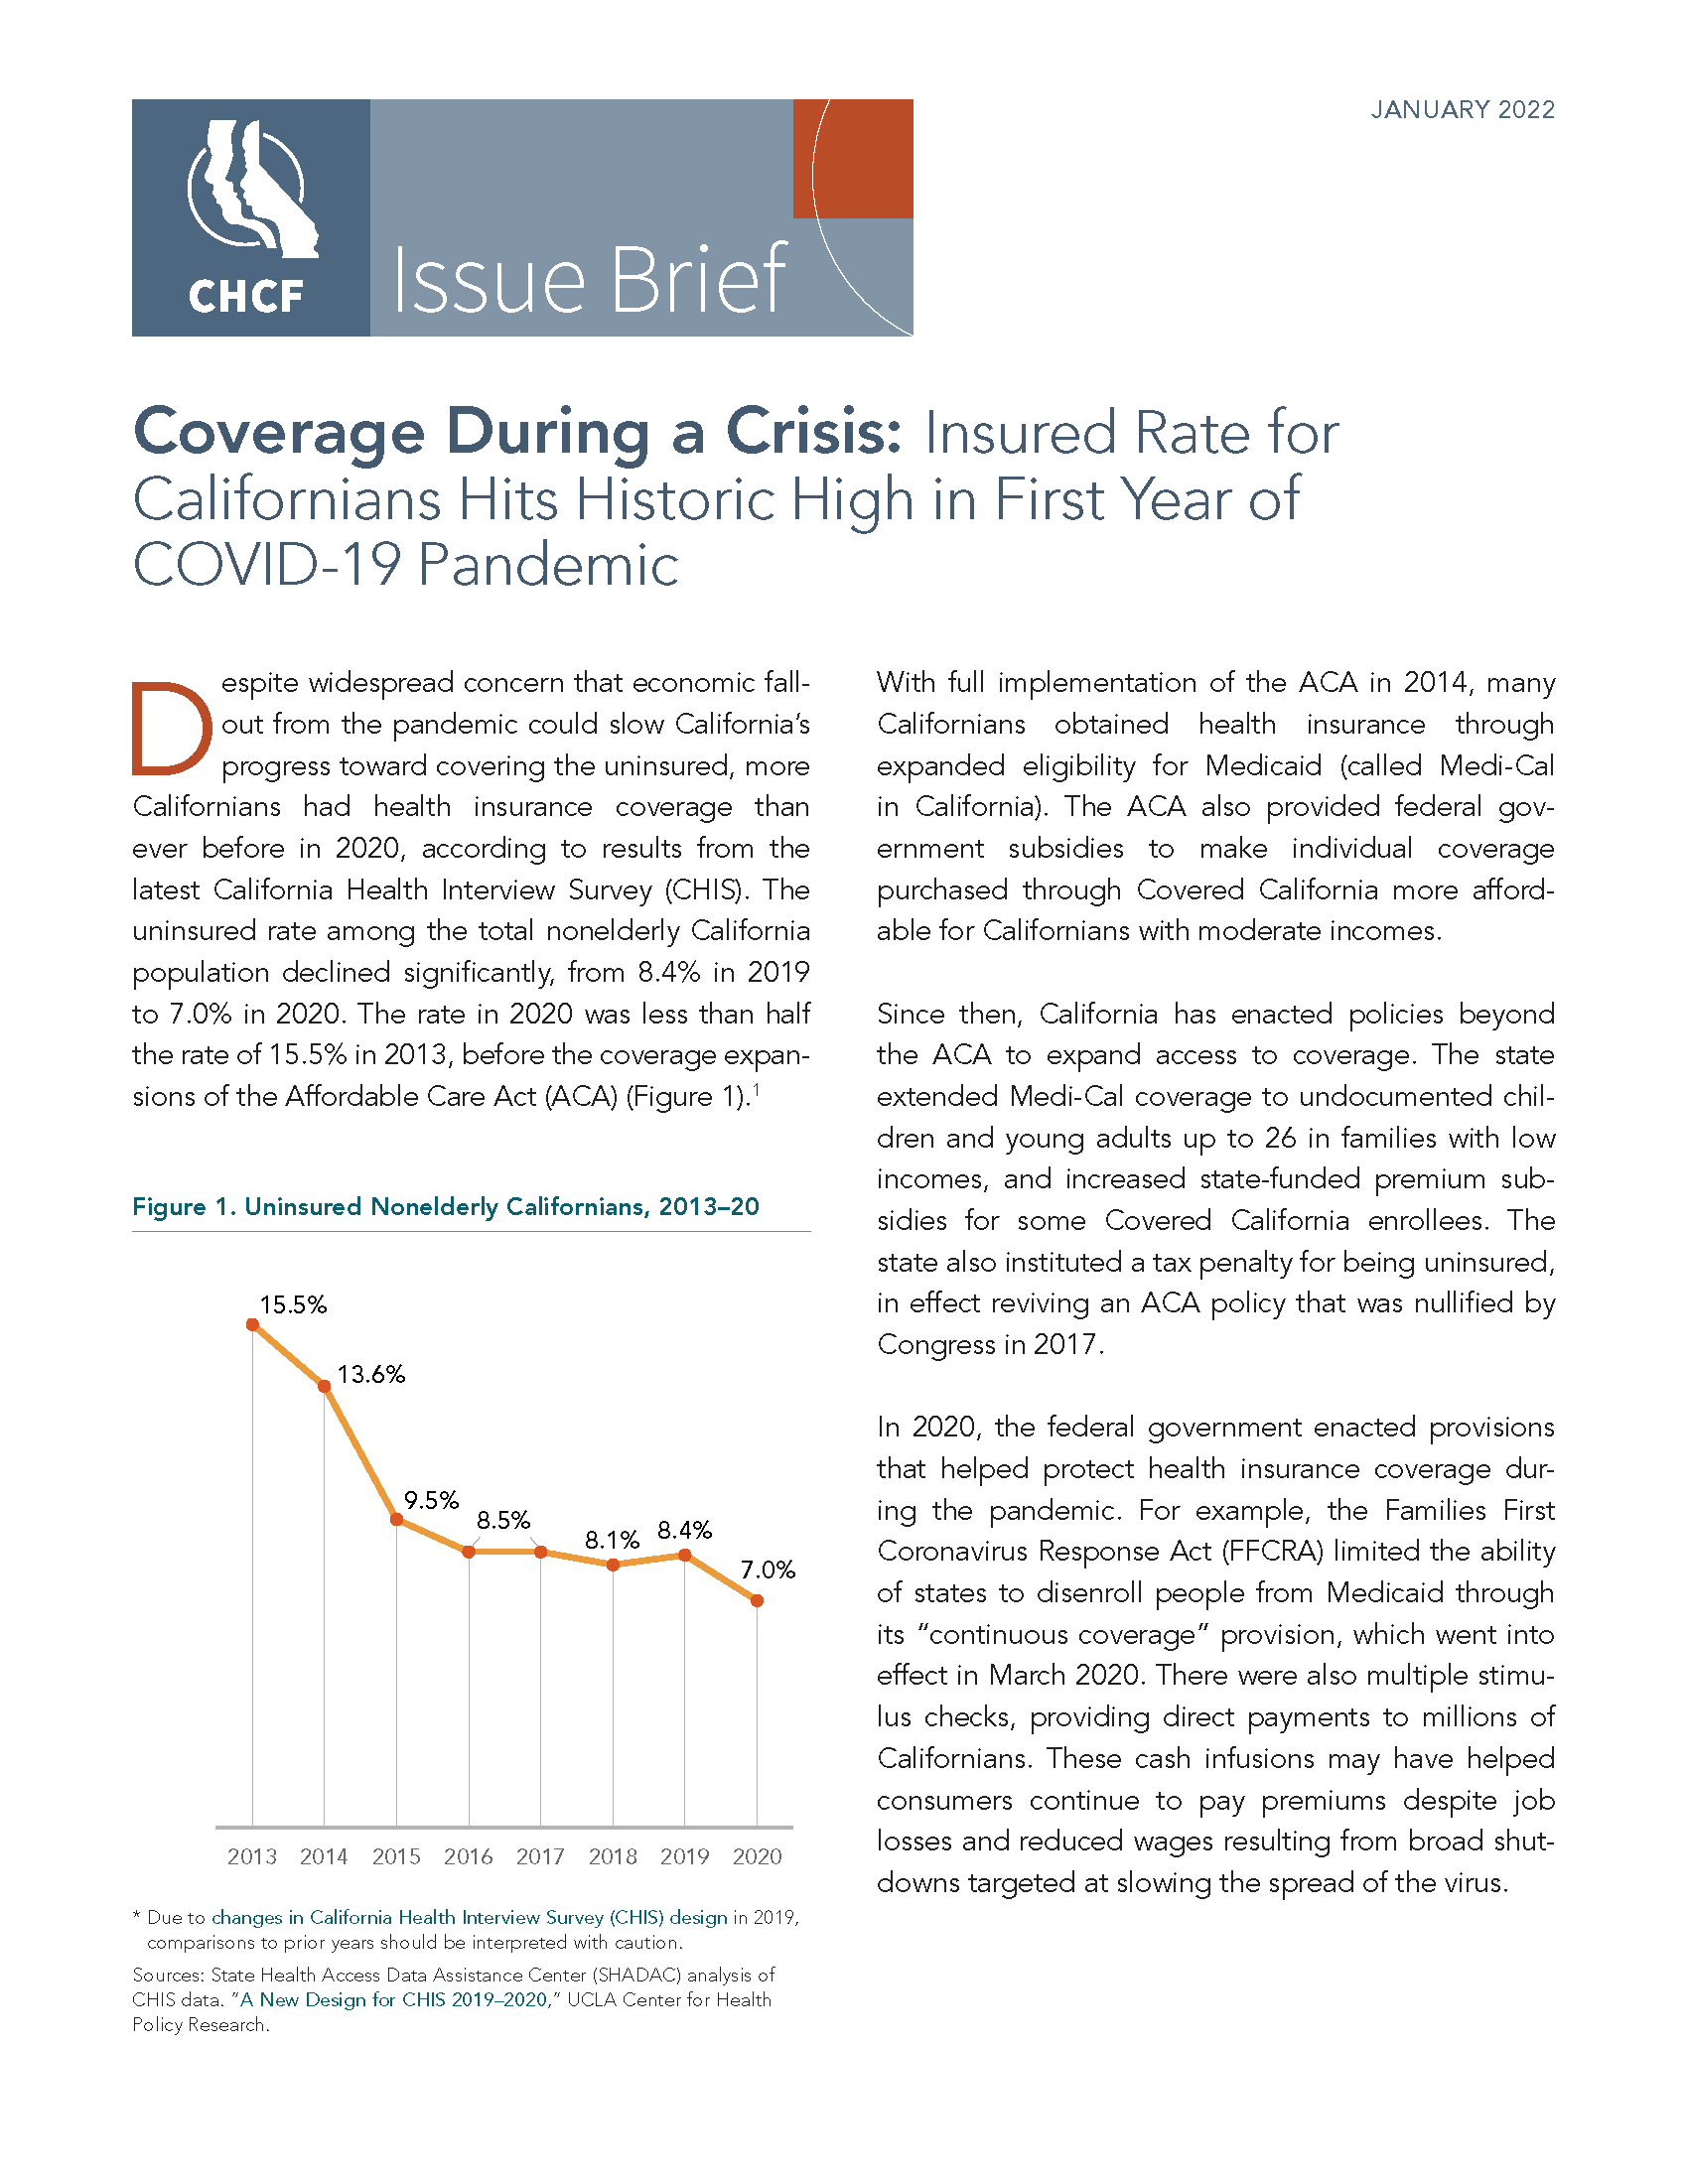
Despite widespread concern that economic fallout from the pandemic could slow California’s progress toward covering the uninsured, more Californians had health insurance coverage than ever before in 2020, according to results from the latest California Health Interview Survey (CHIS). A combination of pre-pandemic state and federal policies that expanded health insurance coverage, along with quick action by policymakers in 2020 to bolster those policies with additional crisis stopgaps, helped protect coverage for many Californians during the pandemic.
In this brief prepared for the California Health Care Foundation (CHCF), SHADAC researcher Lacey Hartman, MPP, provides data from the CHIS about the coverage landscape in California in 2020, highlighting both encouraging trends and persistent disparities that warrant attention, particularly as federal policies that protect coverage connected to the pandemic end or wind down.
Key Findings
- The uninsured rate among the nonelderly California population declined significantly, from 8.4% in 2019 to 7.0% in 2020.
- Rates of uninsured dropped across several population subgroups from 2019 to 2020.
- Californians with incomes up to 138% of the federal poverty guidelines (FPG), dropping from 12.1% to 9.6%. (These are people whose income would make them eligible for Medi-Cal, many through the Affordable Care Act [ACA] expansion of the program.)
 Californians who identify as Latinx, from 12.9% in 2019 to 10.5%.
- Those residing in rural areas of the state, from 9.6% to 6.4%.
- Adults age 18 to 64, from 10.8% to 9.1%.
- Employer and individual coverage held steady statewide, and increased for some groups.
- The overall statewide rate of employer coverage among the nonelderly was statistically unchanged from 58.8% in 2019 to 60.1% in 2020.
- Employer coverage increased significantly from 59.2% to 60.9% among nonelderly adults, from 62.6% to 64.9% among citizens, and from 20.5% to 24.0% among those with incomes up to 138% FPG.
- Medi-Cal coverage held steady statewide, but declined significantly among Black Californians.
- Medi-Cal coverage held steady between 2019 and 2020, covering roughly one quarter of the nonelderly population.
- Changes by subpopulation were also limited, with the notable exception that the share of Black Californians with Medi-Cal declined from 34.5% in 2019 to 24.0% in 2020, a difference that was statistically significant, and is a continuation of recent trends.
- Despite measurable progress, critical disparities in coverage persist.
- The uninsured rate among Latinx Californians remains almost three times as high as that of their White counterparts (10.5% compared to 3.8%).
- Noncitizen adults are uninsured at more than three times the rate of their citizen counterparts (18.4% compared to 5.6%).
- Californians with lower incomes are more likely to be uninsured than those with incomes above 400% FPG.
Looking Ahead
The state’s robust implementation of the Affordable Care Act and additional state policies over the years, in combination with recent state and federal policies designed to protect against coverage losses during the pandemic, has enabled the rate of coverage among Californians to rise to historic levels, even during a massive public health and economic crisis. However, there is potential for coverage expansion to slow or even reverse as policies that provided robust protection during the pandemic unwind or scale back.
Blog & News
NHIS: Early Release Estimates for January-June 2021 Show Continued Significant Changes in Public and Private Coverage across All Groups
November 22, 2021:A report of health insurance coverage estimates for the first half of 2021 (January to June) from the National Health Interview Survey (NHIS) has just been released by the National Center for Health Statistics (NCHS) as part of the NHIS Early Release Program.
Comparing the 2021 estimates to the same time period in 2020 showed broadly similar overall trends by coverage type:
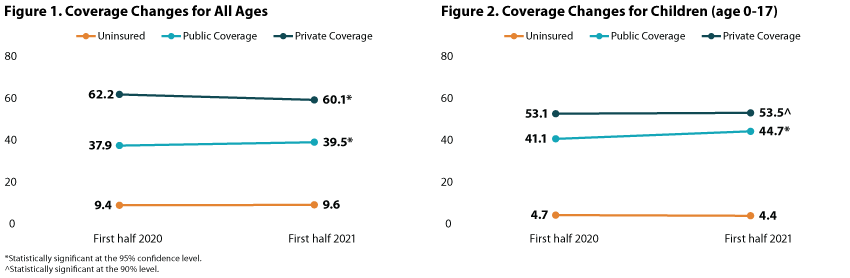
- The rate of individuals without health insurance coverage was statistically unchanged for those of all ages (9.6 percent) as well as for children age 0-17 (4.4 percent).
- The rate of individuals with public coverage increased for those of all ages to 39.5 percent from 37.9 percent, and to 44.7 percent from 41.1 percent for children age 0-17.
- The rate of individuals with private coverage decreased to 60.1 percent from 62.2 percent for those of all ages and dropped to 53.1% from 53.5% for children (age 0-17)—though this change was only statistically significant at the 90% confidence level.
Analysis of coverage trends for specific subpopulations, however, revealed larger differences among nonelderly respondents (age 0-64).
Findings by race/ethnicity
Large disparities in rates of uninsurance persisted from 2020 to 2021, with Hispanic/Latino individuals being more than twice as likely to be uninsured compared with all nonelderly individuals (23.6 percent versus 11.4 percent). Additionally, the share of nonelderly Hispanic/Latino people who were uninsured increased to 23.6 percent from 19.7 percent.
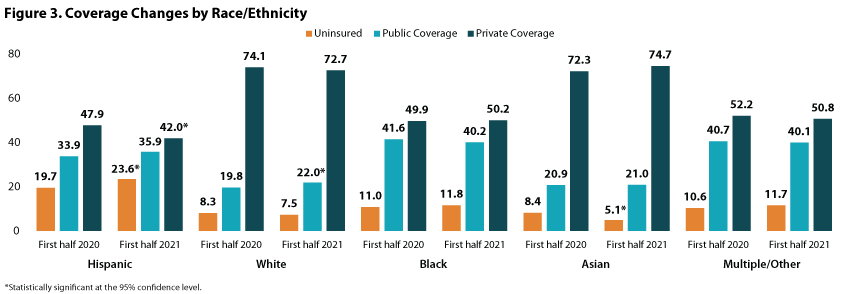
Examining uninsured rates for individuals of other races/ethnicities showed that uninsurance decreased to 5.1 percent from 8.4 percent for nonelderly Asian individuals, but was stable among White individuals, Black individuals, and persons who reported as Multiple/Other race at 7.5 percent, 11.8 percent, and 11.7 percent, respectively.
Looking at public coverage in the first half of 2021, the share of nonelderly White persons who had public coverage increased to 22.0 percent from 19.8 percent in the first half of 2020 while remaining stable among: Hispanic/Latino people (35.9 percent), Black people (40.2 percent), Asian people (21.0 percent), and those of Multiple/Other race (35.4 percent).
Conversely, the share of Hispanic/Latino nonelderly individuals with private coverage fell to 42.0percent in the first half of 2021 from 47.9 percent in the same time period of 2020. Rates of private coverage, however, were stable among White individuals (72.7 percent), Black individuals (50.2 percent), Asian individuals (74.7 percent), and individuals of Multiple/Other race (50.8 percent).
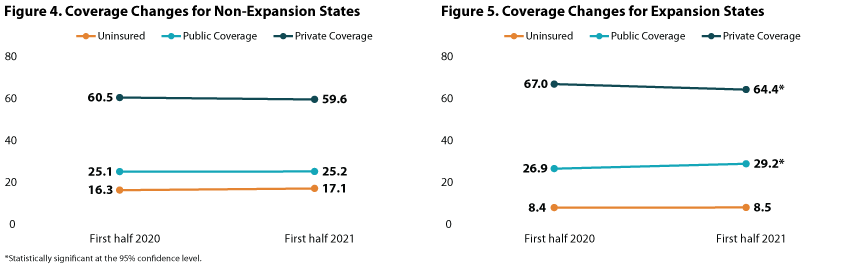
Findings by Medicaid Expansion status
For January-June 2021, nonelderly individuals (age 0-64) living in non-expansion states were more than twice as likely to be uninsured than those living in expansion states at 17.1 percent vs. 8.5 percent—though these rates were both stable when compared with rates from January-June 2020.
In expansion states, rates of public coverage increased to 29.2 percent (from 26.9 percent) while rates of private coverage conversely decreased to 64.4 percent (from 67.0 percent). Rates of both public and private coverage remained stable in non-expansion states at 25.2 percent and 59.6 percent, respectively.
Impact of COVID-19 on NHIS 2020 and 2021 data
Though NCHS notes that data collection efforts for the 2020 NHIS were disrupted by the COVID-19 pandemic and, subsequently, estimates for April-December 2020 may have been impacted by nonresponse bias, normal survey collection and follow-up operations resumed in full by September 2020. All subsequent estimates presented in this early release report for January-June 2021 meet NCHS standards of reliability as specified in “National Center for Health Statistics data presentation standards for proportions.”1
Notes
All differences described in this analysis are statistically significant at the 95% confidence level, unless otherwise indicated.
Estimates are representative of the civilian noninstitutionalized U.S. population, and comparisons presented here are between NHIS data for January-June 2021 and January-June 2020.
1 Cohen, R.A., Martinez, M.E., Cha, A.E., & Terlizzi, E.P. (November 2021). Health insurance coverage: Early release of estimates from the National Health Interview Survey, January–June 2021. National Center for Health Statistics (NCHS). https://www.cdc.gov/nchs/data/nhis/earlyrelease/insur202111.pdf
Blog & News

2021 NHIS Early Release: Stable uninsured rate paired with increase in public coverage and decrease in private coverage
October 14, 2021:The National Center for Health Statistics (NCHS) has released quarterly estimates of health insurance coverage from January 2020-March 2021 from the National Health Interview Survey (NHIS) as part of the NHIS Early Release Program. These are some of the first estimates of health insurance coverage during 2021 from a major, federal government survey. This post compares uninsurance, private coverage, and public coverage rates in the first quarter of 2021 (Q1 2021) to those rates in the first quarter of 2020 (Q1 2020) and focuses on coverage by age group and federal poverty level (FPL).
Uninsured rates were stable among all age groups; Public and private coverage saw significant changes among all age groups
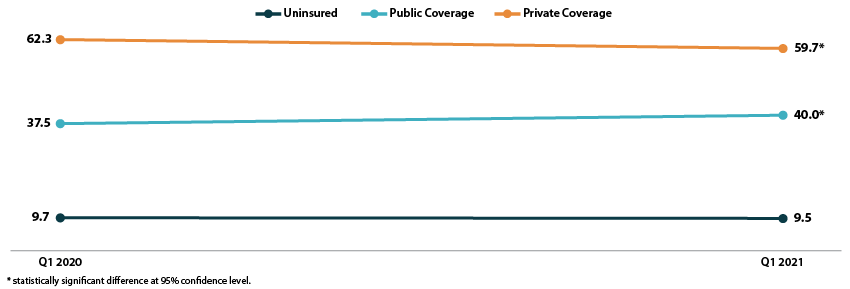
The uninsured rate remained stable in the first quarter of 2021, at an overall 9.5 percent for all ages, 11.3 percent for the non-elderly (age 0-64), 4.6 percent for children (age 0-17), and 13.8 percent for non-elderly adults (age 18-64).
All age groups except non-elderly adults saw increases in rates of public coverage. Public coverage increased 2.5 percentage points (PP) among all ages and for the non-elderly, increasing to 40.0 percent and 28.3 percent, respectively. Children saw an increase of 4.7 PP, rising to 45.6 percent with public coverage in Q1 2021.
Rates of private coverage fell 2.6 PP to 59.7 percent in Q1 2021 for those of all ages. Rates of private coverage were statistically unchanged for other specified age groups.
Figure 1. Health insurance coverage by type (all ages), Q1 2020 vs. Q1 2021
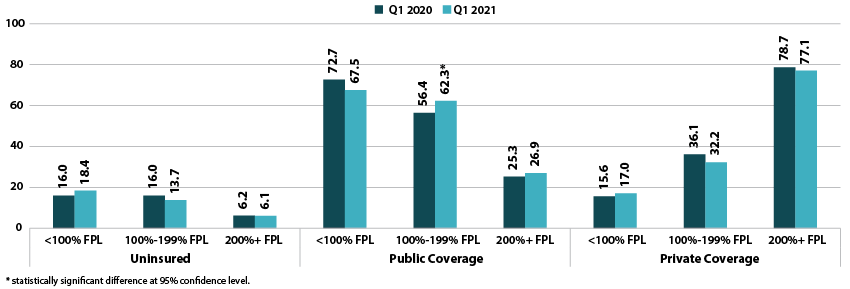
Coverage largely unchanged by poverty level
Rates of uninsurance were stable by poverty level in the first quarter of 2021. For those with incomes below 100% FPL, 18.4 percent were uninsured in Q1 2021. In other categories, 13.7 percent of those with incomes at 100%-199% FPL were uninsured, and 6.1 percent of those with incomes at or above 200% FPL were uninsured.
Rates of public coverage were statistically unchanged for those with incomes below 100% FPL (67.5 percent) and for those with incomes at or above 200% FPL (26.9 percent). Those with incomes 100%-199% FPL saw a 5.9 PP increase in rates of public coverage, rising to 62.3 percent in Q1 2021.
Rates of private coverage were stable by poverty level. Those with incomes below 100% FPL had a private coverage rate of 17.0 percent, those with incomes 100%-199% FPL had a private coverage rate of 32.2 percent, and those with incomes at or above 200% FPL had a private coverage rate of 77.1 percent.
Figure 2. Health insurance coverage by type by poverty level (all ages), Q1 2020 vs. Q1 2021
A note on changes to the NHIS data collection methodology
In response to the COVID-19 pandemic, the NHIS changed to a telephone-only and then telephone-first with in-person follow up data collection methodologies beginning on March 19, 2020. Though this did not affect the Q1 2020 estimates, NCHS’s analysis indicates that the change to telephone-only data collection led to an “over-representation of affluent households,” which may have affected the Q1 2021 estimates. More information on changes to federal survey methodology due to the COVID-19 pandemic is available in the SHADAC brief, Changes in Federal Surveys Due to and During COVID-19.

