
Blog & News


State Health Compare Users Can Now Explore Unemployment by Race/Ethnicity
November 18th, 2020:SHADAC has updated our State Health Compare online data tool to provide estimates of unemployment according to race and ethnicity. Previously, State Health Compare users could analyze unemployment nationwide and at the state level for years 2000 to 2019, but subgroup analyses were not possible. Now, users can explore State Health Compare’s unemployment estimates, which come from the federal Bureau of Labor Statistics, by four racial/ethnic breakdowns: Hispanic/Latino, African-American/Black, Asian and White.
Why This Change Matters
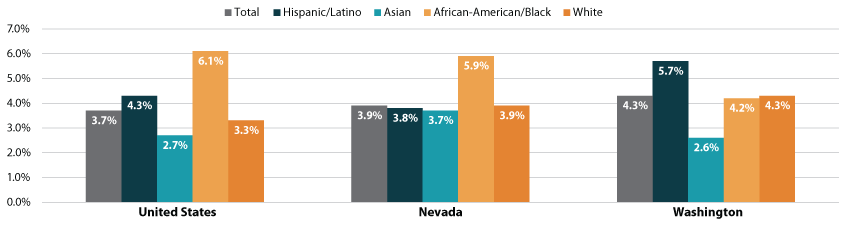
Racial/ethnic breakdowns provide an important lens for analyzing unemployment as a social determinant of health, with unemployment often varying widely across racial/ethnic categories in a way that can be masked by a consideration of population-wide unemployment numbers. We see this scenario at the national level, where the overall unemployment rate in 2019 was 3.7%, but an examination of unemployment for racial/ethnic subgroups reveals 2.7% unemployment among Asian Americans, 3.3% unemployment among Whites, 4.3% unemployment among Hispanics/Latinos, and 6.1% unemployment among African-Americans/Blacks.
Minnesota provides a state case that parallels the national picture on this point. If we look at statewide unemployment in 2019, we find that Minnesota’s unemployment rate was 3.2%, which is 0.5 percentage points below the national rate of 3.7%. However, if we look at the numbers sorted by race/ethnicity, a different picture emerges: The rate for Asians in Minnesota is 2.4%, Whites are at 3.0%, Hispanics/Latinos are at 5.0%, and African-Americans/Blacks are at 5.5%. Not only do Hispanics/Latinos and African-Americans/Blacks have higher unemployment rates than Whites and Hispanics/Latinos, but their rates are also above the broader Minnesota state average, as well as the national average. Thus, what looks at first glance like a state doing well on unemployment turns out to be a state with major disparities in unemployment for certain racial/ethnic subgroups.
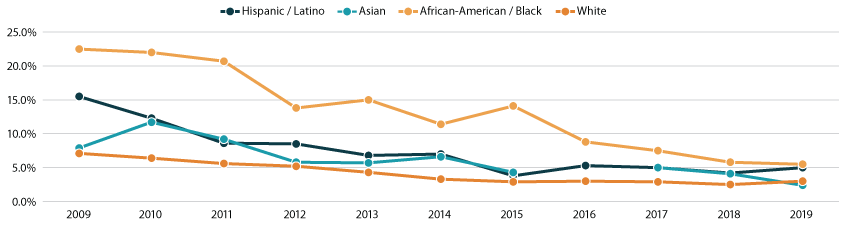
An examination of trends in unemployment over time confirms that the 2019 data for Minnesota are not an anomaly. Though unemployment numbers for Asians in Minnesota were less stable from year to year, White Minnesotans consistently had unemployment rates below those of Hispanic/Latino Minnesotans each year during the 10-year period from 2009 to 2019, and African-American and Black Minnesotans consistently had the highest unemployment rates of any analyzed racial/ethnic group during this time (Figure 1.)
Figure 1. Unemployment in Minnesota by Race/Ethnicity, 2009-2019
The Importance of Considering Individual States
Additionally, it is worth exploring both overall and racial/ethnic subgroup numbers within each individual state, as there is considerable variation both across states and between states and the nation. Washington state, for example, saw an overall unemployment rate of 4.3%, or 0.6 percentage points above the national rate. And among racial/ethnic subgroups, Washington’s numbers followed a different pattern than that seen nationally, with African-Americans/Blacks having the second lowest unemployment rate (4.2%), Whites having the third lowest rate (4.3%), and Hispanics/Latinos having the highest rate (5.7%).
Nevada is another state that had 2019 unemployment numbers that differed from the national story when looking at racial/ethnic breakdowns. Like Washington, Nevada’s state’s overall unemployment rate of 3.9% was above the national rate. However, unemployment in Nevada was second lowest among Hispanics/Latinos (3.8%), third lowest among Whites (3.9%), and highest among African-Americans/Blacks (5.9%).
Figure 2. Unemployment in by Race/Ethnicity, 2019: United States, Nevada, Washington
Taking these state variations into consideration, it’s clear that efforts to analyze and/or address disparities in unemployment by race/ethnicity would potentially look different in Washington and Nevada, or even going to back our example in Minnesota, based on their respective divergences in overall and subgroup numbers.
Discussion: Unemployment as a Social Determinant of Health
Unemployment has important implications for health and health care, as employment affects access to stable housing, food, and health insurance coverage and care. At the same time, unemployment can also have a number of direct negative health consequences, including depression, anxiety, and stress-related illness such as high blood pressure, stroke, heart attack, heart disease, and arthritis.1-7
An examination of unemployment that takes into consideration important nuances in unemployment numbers among subgroups reveals the need for critical, targeted attention to unemployment, even in states where unemployment appears to be trending well overall. Consideration of interstate variation of unemployment by race/ethnicity reveals that policy levers to address unemployment that take race/ethnicity into consideration will require state-specific modifications as well.
Explore the Data
Visit State Health Compare to learn more about unemployment by race/ethnicity within and across the states.
About the Estimates
State Health Compare’s estimates of unemployment are produced using data from the federal Bureau of Labor Statistics and represent the percent of the civilian labor force (age 16 and older) that was unemployed. State refers to place of residence.
1 Avendano, M., Berkman, L. F. (2014). Labor markets, employment policies, and health. In L. F. Berkman, I. Kawachi, & M. Glymour (Eds.), Social Epidemiology (2nd ed., pp. 182-233). Open University Press.
2 Murray, L. R. (2003). Sick and tired of being sick and tired: scientific evidence, methods, and research implications for racial and ethnic disparities in occupational health. Am J Public Health, 93(2), 221-226.
3 Kasl, S. V., Cobb, S. (1970). Blood pressure changes in men undergoing job loss: a preliminary report. Psychosom Med, 32(1), 19-38.
4 Frumkin, H. E., Walker, D., Friedman-Jiménez, G. (1999). Minority workers and communities. Occup Med, 14(3), 495-517.
5 James, S. A., LaCroix, A. Z., Kleinbau, D. G., Strogatz, D. S. (1984). John Henryism and blood pressure differences among black men. II. The role of occupational stressors. J Behav Med, 7(3), 259-275.
6 Robert Wood Johnson Foundation. (2013). How does employment—or unemployment—affect health? Health policy snapshot. Available from http://www.rwjf.org/content/dam/farm/reports/issue_briefs/2013/rwjf403360
7 U.S. Department of Labor, Bureau of Labor Statistics. (2012). A profile of the working poor, 2010. News release. Available from https://www.bls.gov/opub/reports/working-poor/archive/workingpoor_2010.pdf
Blog & News
Update to SHADAC’s Minnesota Uninsured Profile Tool Features Customized Legislative District Infographics Aimed at Addressing Disparities
November 12, 2020:Our research team at SHADAC has continued its partnership with the Blue Cross Blue Shield Foundation of Minnesota to complete a new tool that provides critical information on the uninsured populations in Minnesota at the legislative district level. Using the most up-to-date estimates available from the United States Census Bureau, (2014-2018 American Community Survey, 5-year estimates) this unique set of infographics are designed to identify and categorize legislative districts with high uninsured rates using color-coded state maps and graphics that provide a deeper look into the socioeconomic data of each Minnesota House and Senate district.
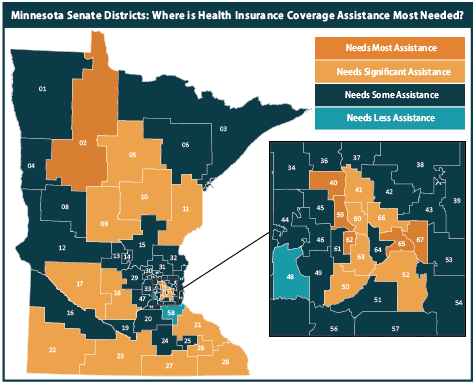 In these new infographics, state legislative maps are color-coded according to four levels of need for coverage assistance: Needs Most Assistance (uninsured rate of 7.1% or more); Needs Significant Assistance (uninsured rates between 4.8-7.0%); Needs Some Assistance (uninsured rates between 2.4-4.7%); and Needs Less Assistance (under 2.3%).
Users are able to click on an individual district in the accompanying PDF to access a two-page infographic that contains detailed socioeconomic data about that respective district's uninsured population, such as race, ethnicity, income, and age. These infographics are designed to provide clear and concise snapshots of coverage needs to raise awareness and assist policymakers and health insurance navigators in developing strategies to reach the remaining uninsured in the state of Minnesota.
“While uninsured data for Minnesota are available elsewhere, the data we’ve compiled within these customized infographics are the most explicit in calling out levels of need and addressing disparities within the state,” Dr. Kathleen Call explains. “We felt that it was most important to highlight these categories of need at the legislative district level, because that is where policy is made and where our data would be most useful.”
In the coming months, Dr. Call and her team plan for another update to the tool as soon as the latest data from the Census Bureau (2015-2019 ACS 5-year estimates) are released. They also plan to produce a video tutorial to assist users in utilizing the profile tool as well as the newly released infographics.
For additional information on the original uninsured profile tool, users can access the Resource Page on our SHADAC website where the tool is available for download in Excel spreadsheet format. In addition to the just-released infographics, the profile tool is accompanied by an interactive map that shows users the geographic makeup of each specified region in relation to schools, hospitals, native reservations, and other important or distinctive landmarks. Users are also able to use the site to provide feedback on the current profile tool, and can also request that a similar tool be built specifically for their state.
Blog & News

Minnesota and U.S. Uninsurance Rates Grew in Years Leading up to Pandemic
October 27, 2020:Children’s uninsurance rate held steady recently, while non-elderly adults’ rate increased in 2019
 For the third consecutive year, the United States' uninsurance rate increased significantly, reaching 9.2 percent in 2019, or roughly 27.9 million people. The uninsurance rate in Minnesota also increased significantly to 4.9 percent in 2019—a total of more than 270,000 people. While those increases are troubling by themselves, uninsurance rates are likely to grow even further in 2020 due to the COVID-19 pandemic and ensuing recession, which triggered historic job losses and could further cause hundreds of thousands of Minnesotans—and tens of millions across the U.S.—to lose coverage.1
Successes and Reversals in the ACA’s Coverage Expansion
Following years of growing U.S. uninsurance rates, the passage of the Affordable Care Act (ACA) in 2010 was designed to expand health insurance coverage to millions of Americans through various reforms, including the expansion of Medicaid eligibility to low-income adults, and the creation of health insurance marketplaces and tax subsidies to make individual market coverage more affordable for people with moderate incomes.
The first year of the ACA’s coverage expansion provisions saw historic declines in U.S. uninsurance rates, dropping significantly from 14.5 percent in 2013 to 11.7 percent in 2014 (Figure 1). In the following years of 2015 and 2016, U.S. uninsurance rates declined further still, bottoming out at 8.6 percent in 2016. At the same time, Minnesota’s uninsurance rate was cut in half—declining from 8.2 percent in 2013 to 4.1 percent by 2016.
Figure 1. U.S. and Minnesota Uninsurance Rates, 2013-2019
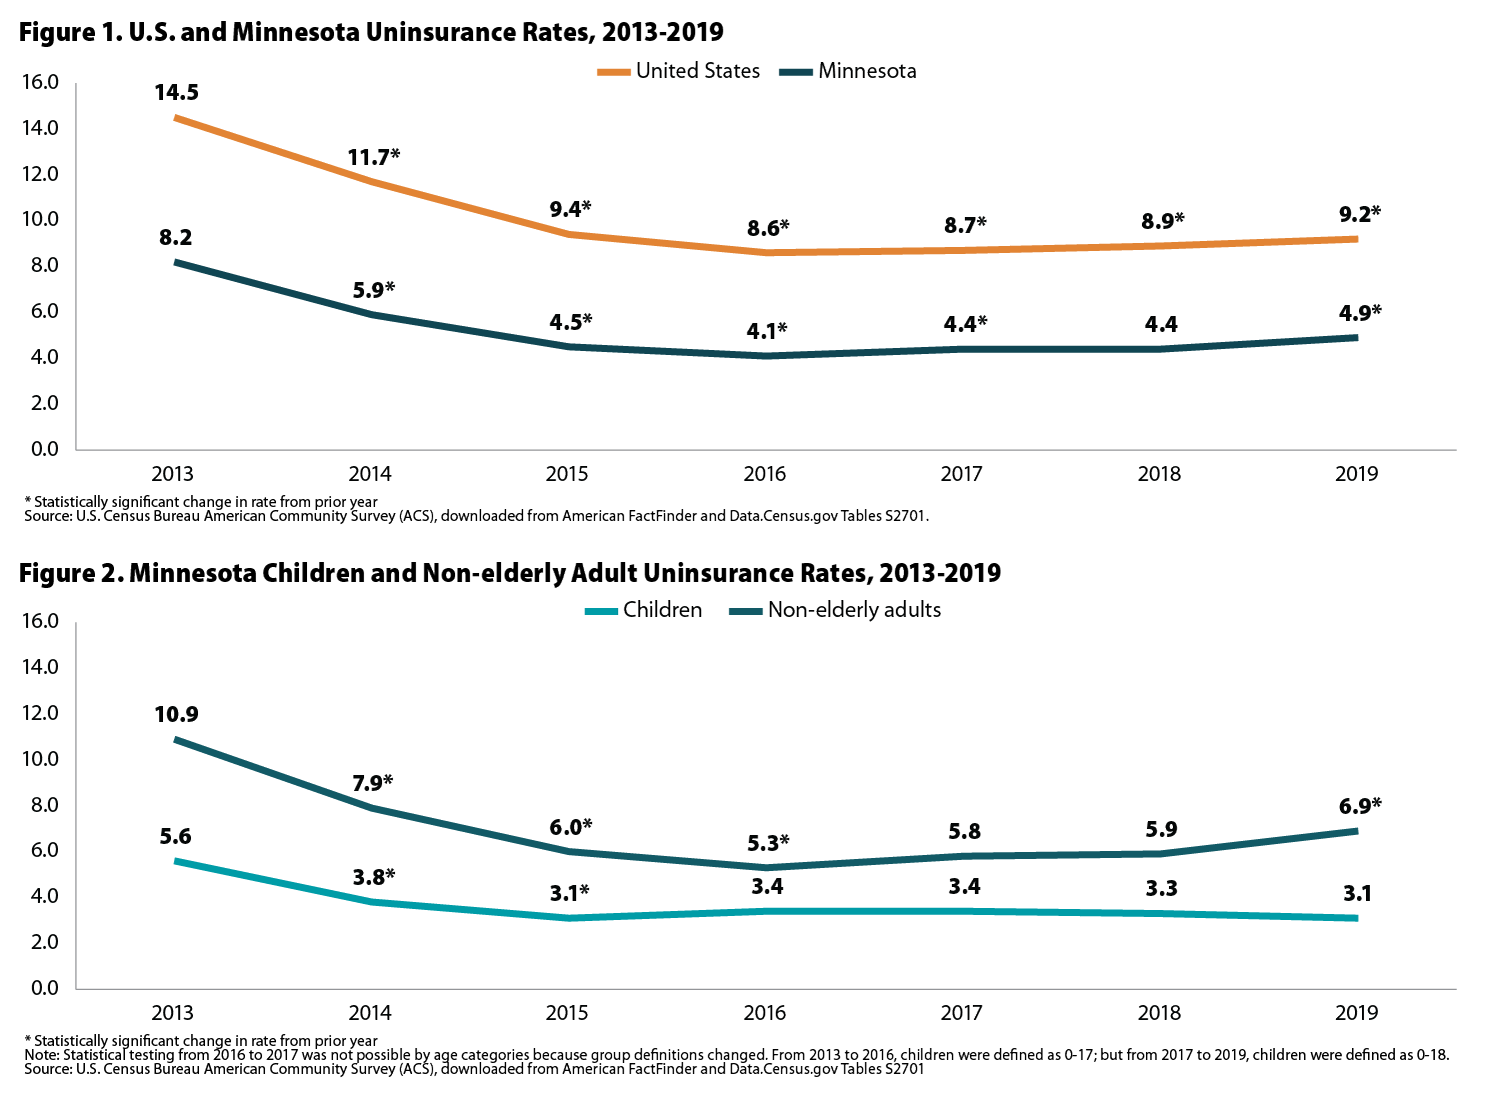
Beginning in 2017, however, uninsurance rates began to creep back up. In the U.S., uninsurance rates increased significantly in 2017, 2018, and 2019, when they reached 9.2 percent. Minnesota uninsurance rates also grew significantly in 2017 and 2019, when they reached 4.9 percent.
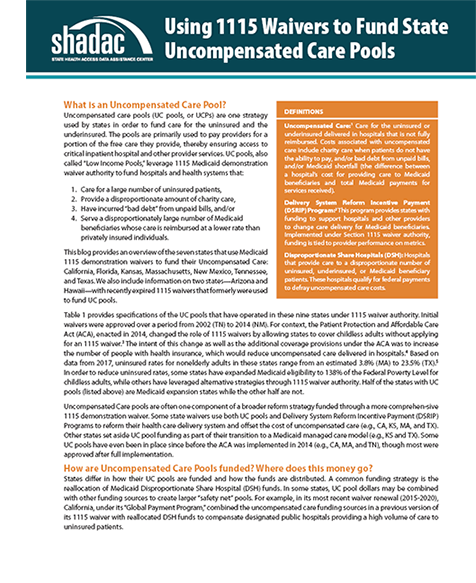
In Minnesota, the increases in uninsurance appear to be driven primarily by non-elderly adults. The uninsurance rate for adults age 19-64 increased significantly between 2018 and 2019, from 5.9 percent to 6.9 percent—the second-highest recorded rate since implementation of the ACA (Figure 2).2 However, the uninsurance rate for children in Minnesota remained statistically unchanged from 2018 to 2019. In fact, the 2019 uninsurance rate of 3.1 percent for Minnesota children was the lowest since implementation of the ACA (tied with the 3.1 percent rate in 2015).
Figure 2. Minnesota Children and Non-elderly Adult Uninsurance Rates, 2013-2019
Even with the overall increase in uninsurance, Minnesota continued to have one of the lowest rates in the U.S.—lower than all but four other states (Massachusetts, Rhode Island, Hawaii, and Vermont) and the District of Columbia. The lowest 2019 state uninsurance rate was 3.0 percent in Massachusetts, while the highest was 18.4 percent in Texas.
Generally, states such as Minnesota that have taken up the ACA’s option to expand their Medicaid programs tend to have lower uninsurance rates, while states that haven’t expanded their Medicaid programs tend to have higher uninsurance rates. For instance, each of the earlier mentioned states with the lowest uninsurance rates (DC, HI, MA, MN RI, VT) has expanded its Medicaid program, while none of the states with the five highest uninsurance rates (Florida, Georgia, Mississippi, Oklahoma, and Texas) has expanded its Medicaid program.
The Pandemic’s Uninsurance Perils
Though definitive estimates of the impact of the pandemic on health insurance coverage won’t be available until federal survey data are released in late 2021, it’s all but certain that 2020 will show a significant increase in uninsurance rates nationally and in many states. While the share of Americans who get health insurance through an employer has declined over time, employer-sponsored insurance (ESI) remains the backbone of the U.S. health insurance system, with a majority of the U.S. population getting their insurance through ESI (52.0 percent in 2018).3
The historically massive job losses caused by the pandemic and efforts to contain the outbreak are estimated to have caused millions of people to lose their ESI in 2020. Some of those people may regain ESI coverage, through a replacement job or as a dependent on a spouse or parent’s plan. Others may obtain individual market coverage through health insurance marketplaces, perhaps with the assistance of ACA premium subsidies.
In Minnesota and other states that took up the ACA’s Medicaid expansion provision, many low-income people who have lost ESI will be able to rely on that public insurance program as a safety net. However, Medicaid coverage will not be an option for most adults who lost ESI in the 12 states that have yet to expand their Medicaid programs to childless adults. For that reason, those states that have yet to expand Medicaid may see larger increases in uninsurance as a result of the pandemic.
1 Golberstein, E., Abraham, J.M., Blewett, L.A., Fried, B., Hest, R., & Lukanen, E. (2020). Estimates of the Impact of COVID-19 on Disruptions and Potential Loss of Employer-Sponsored Health Insurance (ESI) [PDF file]. https://www.shadac.org/publications/COVID-19-MNHealth-Insurance-Model
2 From 2013 to 2016, non-elderly adults were defined as age 18-64, but from 2017 to 2019, they are defined as 19-64, so statistical testing of annual changes in rates was not possible for the subcategories of children and non-elderly adults between 2016 and 2017.
3 State Health Compare. Health Insurance Coverage Type: 2008-2018 [Data set]. State Health Access Data Assistance Center. http://statehealthcompare.shadac.org/trend/11/health-insurance-coverage-type-by-total#0/1/86/1,2,3,4,5,6,7,8,15,24,25/21
Publication
Using 1115 Waivers to Fund State Uncompensated Care Pools
What is an Uncompensated Care Pool?
Uncompensated care pools (UC pools, or UCPs) are one strategy used by states in order to fund care for the uninsured and the underinsured. The pools are primarily used to pay providers for a portion of the free care they provide, thereby ensuring access to critical inpatient hospital and other provider services. UC pools, also called “Low Income Pools,” leverage 1115 Medicaid demonstration waiver authority to fund hospitals and health systems that:
- Care for a large number of uninsured patients,
- Provide a disproportionate amount of charity care,
- Have incurred "bad debt" from unpaid bills, and/or
- Serve a disproportionately large number of Medicaid beneficiaries whose care is reimbursed at a lower rate than privately insured individuals.
This brief provides an overview of the seven states that use Medicaid 1115 demonstration waivers to fund their Uncompensated Care: California, Florida, Kansas, Massachusetts, New Mexico, Tennessee, and Texas. We also include information on two states—Arizona and Hawaii—with recently expired 1115 waivers that formerly were used to fund UC pools.
Publication
Comparing Federal Government Surveys That Count the Uninsured: 2020
 With the release of new insurance coverage estimates from surveys conducted by the U.S. Census Bureau, the Agency for Healthcare Research and Quality (AHRQ), and the Centers for Disease Control and Prevention (CDC), SHADAC has updated our annual “Comparing Federal Government Surveys that Count the Uninsured” brief.
The brief provides an annual update to comparisons of uninsurance estimates from four federal surveys:
- The American Community Survey (ACS)
- The Current Population Survey (CPS)
- The Medical Expenditure Panel Survey - Household Component (MEPS-HC)
- The National Health Interview Survey (NHIS)
In this brief, SHADAC presents current and historical national estimates of uninsurance along with the most recent available state-level estimates from these surveys. We also discuss the main reasons for variation in the estimates across the different surveys as well as possible reasons for incomparability of estimates across and within the surveys.
Download a PDF of the Comparing Federal Government Surveys Brief.
Last year’s brief with data from 2019, and certain 2018 data, can be accessed here.

