
Blog & News


SHADAC Researchers Continue to Make Updates to State Uninsured Population Profile Tool at Crucial Time
March 4th, 2021: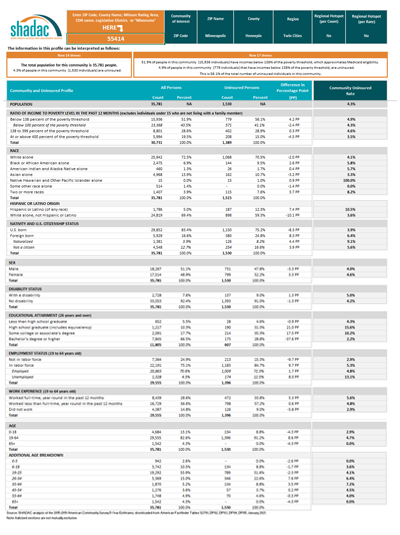 More than a year after their initial release of an interactive tool that provides a way to identify and characterize communities with high uninsurance rates in the state of Minnesota, a research team at SHADAC is continuing to provide general users, health insurance navigators, policymakers, and outreach teams with updates aimed at refining the tool, providing new data, and improving usability.
All of the original features of the Minnesota Uninsured Profile Tool— the ability to compare characteristics of the total population to the uninsured population by state, region, county, economic development region (EDR), MNSure rating area, and specific ZIP code, as well as an in-depth profile of community characteristics—have remained as part of the resource since its first release; however, an update in the fall of 2020 added the ability to sort and view the uninsured population by state legislative district (both House and Senate), and this latest update pulls estimates from the U.S. Census Bureau’s American Community Survey (ACS) to populate the profile with the latest available data from 2019.
Recent studies have suggested that many Minnesotans, along with workers and dependents across the rest of the nation, have suffered pandemic-related coverage losses such as from employer-sponsored insurance, and may be unaware of possible options for new coverage.1 Tools such as the Minnesota Uninsured Profile, then, may offer some assistance in outreach efforts for both the historically uninsured as well as those newly uninsured.
Three other accompanying resources have also been developed alongside the profile tool: The first; an infographic series featuring color-coded state legislative district maps categorized by four levels of need for coverage assistance: Needs Most Assistance; Needs Significant Assistance; Needs Some Assistance; and Needs Less Assistance; with detailed socioeconomic data about that respective district's uninsured population, such as race, ethnicity, income, and age. The second is a brand-new video tutorial, narrated by profile development team member and SHADAC PhD student Cynthia Pando, offering a step-by-step walkthrough of how to access the uninsured profile, and how to use the downloadable data spreadsheet.
Information presented in the profile tool is also supplemented by the third resource, an interactive map that shows users the geographic makeup of each ZIP code in relation to schools, hospitals, native reservations, and other important or distinctive landmarks.
Continuing to make timely and relevant updates has always been a goal of the project, according to Principal Investigator Dr. Kathleen Call, who noted that her team is working “to meet the changing needs of navigators and other data users” by making changes to the profile that will “matter most in the decisions they are making to learn more about their communities and those who lack health insurance coverage.”
For additional information on the uninsured profile tool, or to request the development of a similar tool for another state, users can access the Uninsured Profile Resource Page on SHADAC’s website where the tool is available for download in Excel spreadsheet format, the interactive map can be accessed, and an option to provide Dr. Call with feedback on their user experience is located.
1 Planalp, C. (2021, March 1). Minnesota’s coverage dynamics shifted prior to pandemic. State Health Access Data Assistance Center (SHADAC) Blog. https://www.shadac.org/news/minnesotas-coverage-dynamics-shifted-prior-pandemic
Golberstein, E., Abraham, J.M., Blewett, L.A., Fried, B., Hest, R., & Lukanen, E. (2020). Estimates of the Impact of COVID-19 on Disruptions and Potential Loss of Employer-sponsored Health Insurance (ESI). State Health Access Data Assistance Center (SHADAC). https://www.shadac.org/sites/default/files/publications/UMN%20COVID-19%20ESI%20loss%20Brief_April%202020.pdf
Blog & News
Minnesota's coverage dynamics shifted prior to pandemic
March 01, 2021:In the three years prior to the COVID-19 pandemic, Minnesota’s health insurance landscape shifted in multiple ways. One positive development was a significant increase in rates of employer-sponsored insurance (ESI) from 2016 to 2019. Others were potentially troubling—such as the significant decline in rates of health coverage through the individual market.
The performance of the state’s uninsurance rate demonstrated the clearest reason for concern. In the first few years of the Affordable Care Act’s coverage expansions, Minnesota’s uninsured rate declined to a historic low of 4.2 percent in 2016. Since then, however, the state’s uninsurance rate has increased significantly, reaching 4.8 percent by 2019.
A changing coverage landscape prior to the pandemic
The health insurance gains in the early years of the ACA coincided with a statistically significant increase in Medicaid and CHIP coverage, which grew from 11.0 percent in 2013 to 13.8 percent in 2016. Meanwhile, other coverage through the individual market (7.4 percent in 2016) and employer-sponsored insurance (58.5 percent in 2016) remained statistically unchanged in Minnesota as compared to 2013 rates (Figure 1).
Figure 1. Minnesota health insurance rates by coverage type, 2013-2019 (Total population)
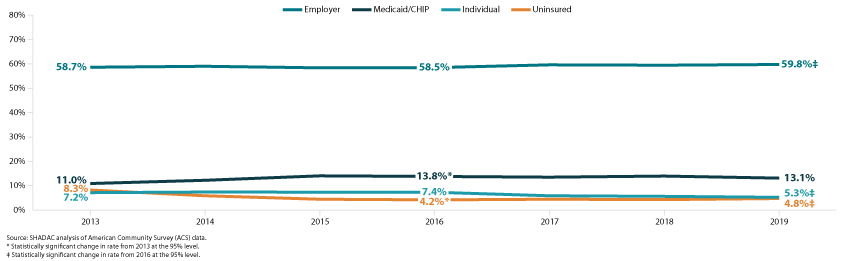
After 2016, however, those patterns changed in ways that may have posed challenges in the lead-up to the pandemic in 2020. For instance, at the same time that the Minnesota uninsurance rate increased, coverage through the individual market dropped significantly, from 7.4 percent in 2016 to 5.3 percent in 2019.
Conversely, a statistically significant increase in employer-sponsored insurance—from 58.5 percent in 2016 to 59.8 percent in 2019—initially appears encouraging. However, employer-based coverage tends to be cyclical, increasing as the economy improves and employment increases and declining when economic conditions deteriorate and unemployment increases. For that reason, it is likely those gains in employer-sponsored insurance were eroded as the coronavirus crisis caused massive job losses beginning in 2020.1
Growth in ESI could pose vulnerability for nonelderly adults leading into 2020 crisis
Trends in health insurance coverage for nonelderly adults (age 19 and older) are similar to the overall population during this time, though more exaggerated. The uninsurance rate for nonelderly adults was even higher than the overall population in 2019, and it represents a larger, statistically significant increase since 2016 (from 5.7 percent to 6.6 percent in 2019) (Figure 2).
Figure 2. Minnesota health insurance rates by coverage type, 2013-2019 (Nonelderly adult population)
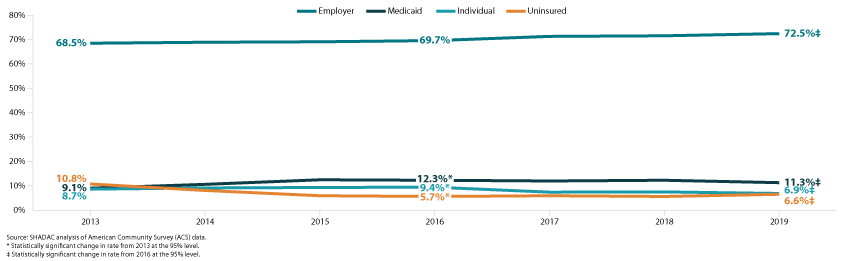
That increase in uninsurance occurred alongside significant declines in Medicaid coverage, from 12.3 percent in 2016 to 11.3 percent in 2019, and individual-market coverage, from 9.4 percent in 2016 to 6.9 percent in 2019. Meanwhile, employer-sponsored insurance for nonelderly adults increased significantly, from 69.7 percent in 2016 to 72.5 percent in 2019. Though, as noted earlier, those improvements were likely undermined or eliminated by pandemic-related job losses.
Stability in public coverage may serve as a buffer for kids
The coverage dynamics of the past few years may provide more insulation against loss of health insurance for children leading into the pandemic. Unlike for nonelderly adults, the uninsurance rate for Minnesota kids did not change significantly from 2016, remaining effectively steady at 3.4 percent in 2019.
Figure 3. Minnesota health insurance rates by coverage type, 2013-2019 (Child population)
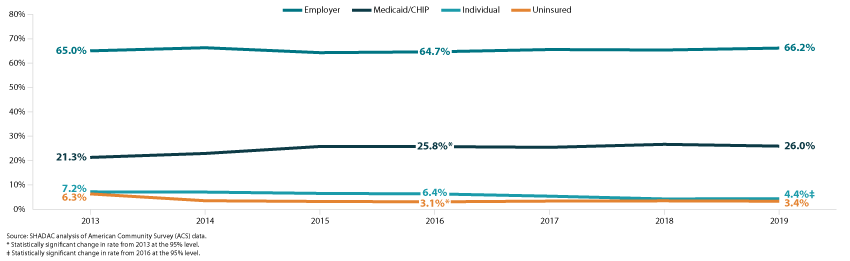
Additionally, kids did not see the same statistically significant increase in employer-sponsored insurance that nonelderly adults experienced. Their 2019 rate of ESI was 66.2 percent, which was not significantly different from 2013 (65.0 percent). While that lack of increase may have been disappointing at the time, it also means that children’s ESI rates don’t have as far to fall due to fallout from the COVID pandemic. Meanwhile, the rate of Medicaid and CHIP coverage for Minnesota kids remained statistically unchanged since 2016, at 26.0 percent in 2019. Children did, however, see a significant decline in individual market insurance, from 6.4 percent in 2016 to 4.4 percent in 2019.
Conclusions
During the first few years of the ACA, Minnesota uninsurance rates declined significantly. That coincided with significant increases in Medicaid (and CHIP) coverage as the state adopted the ACA’s Medicaid expansion. But more recently, that reduction in uninsurance has been partially reversed—posing a serious challenge going into the public health and economic crises of 2020 that are believed to have caused health insurance losses for potentially millions of people.
In the coming months of 2021, it will be important to monitor coverage patterns and work to ensure that those who have lost insurance due to the coronavirus are aware of their options to regain coverage. ACA policies that were designed to increase access to health coverage—such as Medicaid expansion and tax credits to make individual market coverage more affordable—could help to soften the blow of ESI lost due to the pandemic recession.
Some early research using the Minnesota Health Access Survey (MNHA) and Health Insurance Enrollment Survey found evidence that Minnesota’s uninsured rate has remained relatively steady through the first half of 2020, at roughly 4.6 percent.2 The survey found that while ESI declined during that time, coverage through public programs like Medicaid and Minnesota Care (the state’s Basic Health Program) increased in early 2020. However, the extent to which those patterns persisted in later 2020 and into 2021 is not yet known.
1 Golberstein, E., Abraham, J.M., Blewett, L.A., Fried, B., Hest, R., & Lukanen, E. (2020). Estimates of the Impact of COVID-19 on Disruptions and Potential Loss of Employer-sponsored Health Insurance (ESI). State Health Access Data Assistance Center (SHADAC). https://www.shadac.org/sites/default/files/publications/UMN%20COVID-19%20ESI%20loss%20Brief_April%202020.pdf
2 Health Economics Program (HEP). (2021, February 2). Pandemic’s Impact on Health Insurance Coverage in Minnesota Was Modest by Summer 2020. Minnesota Department of Health (MDH). https://www.health.state.mn.us/data/economics/docs/inscoverage2020.pdf
Blog & News
2020 NHIS: State vs National Estimates of Health Insurance Coverage (Infographic)
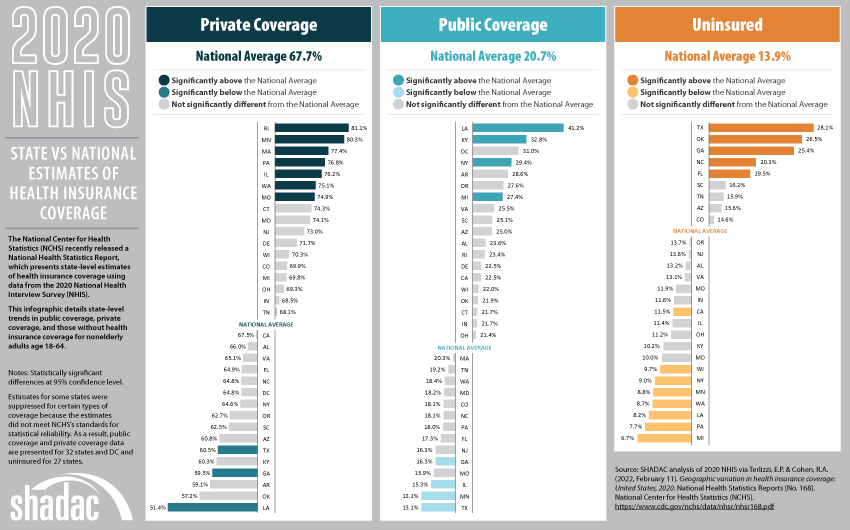
February 15, 2021:The National Center for Health Statistics (NCHS) recently released a National Health Statistics Report, which presents state-level estimates of health insurance coverage using data from the 2020 National Health Interview Survey (NHIS).
The report provides estimates by subcategories of state Medicaid expansion status, urbanization level, and expanded region based on data from all 50 states and the District of Columbia (D.C.). However, estimates for some states were suppressed for certain types of coverage and certain age groups because the estimates did not meet NCHS’s standards for statistical reliability. As a result, data are presented for 32 states and D.C. for people under age 65, adults age 18-64, and in just 16 states for children age 0-17.
Based on these estimates, SHADAC has created an infographic that details state-level trends in public coverage, private coverage, and those without health insurance coverage for nonelderly adults age 18-64. While rates of private coverage, public coverage, and uninsurance for this age group were unchanged at the national level from 2019 to 2020 (67.5% to 67.7%, 20.4% to 20.7%, and 14.5% to 13.9%, respectively), rates at the state level varied much more widely between years.
Click on the infographic below to learn more about the state-level estimates.
Blog & News
NHIS: Early Release Estimates Show Unchanged Coverage Rates during First Half of 2020, although NCHS Reports Evidence of Nonresponse Bias due to COVID-19
February 15, 2021:The National Center for Health Statistics (NCHS) has just published health insurance coverage estimates for the first half of 2020 (January to June) from the National Health Interview Survey (NHIS) as part of the NHIS Early Release Program. These estimates are some of the first available coverage estimates for 2020 from a federal survey and among the first estimates to cover the beginning of the coronavirus (COVID-19) pandemic in the United States.
Topline Estimates from January-June 2020
At a high level, the new estimates show no significant changes in coverage type or uninsured rate when compared to the same period of time in 2019. Among nonelderly adults (ages 18 to 64) surveyed between January and June 2020, 13.4% were uninsured at the time of interview, 20.8% had public coverage, and 67.9% had private coverage. These rates were 14.7%, 20.4%, and 66.8%, respectively, from January to June 2019.
Nonresponse Bias Report for April-June, 2020 (Q2)
NCHS released a report to accompany the January-June 2020 estimates that presents a preliminary analysis of a drop in response rates in Q2 2020 (April-June).
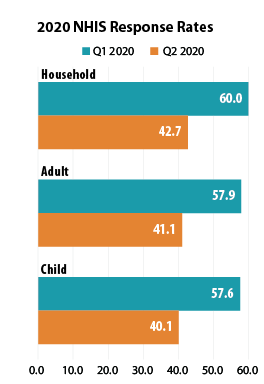 NHIS data collection, which is typically conducted by making personal visits to respondents’ homes, was significantly impacted by the COVID-19 pandemic beginning in Q2 2020: Personal visits were suspended beginning on March 19, 2020, and data was collected by telephone instead. As a result of the shift to telephone-only interviewing, the sample household response rate declined from 60.0% in Q1 (January-March) to 42.7% in Q2; the adult response rate fell from 57.9% to 41.1%; and the child response rate dropped from 57.6% to 40.1%.
NCHS researchers compared the characteristics of Q2 respondents to the characteristics of respondents from Q1 to determine whether the smaller Q2 sample was systematically biased in any way and found that lower-income and renter households were underrepresented in the Q2 sample. This points to potential nonresponse bias and to the possibility that the actual uninsured rates for Q2 2020 were higher than the NHIS early release estimates indicate, as lower-income and renter households tend to have higher rates of uninsurance than do middle- and higher-income households and home-owning households.
SHADAC will continue to monitor all subsequent early data releases for 2020 from the NHIS survey, and will provide updates on any new methodology reports such as the investigation into nonresponse bias for Q2 2020 provided by NCHS.
Notes about the Estimates
The above estimates provide a point-in-time measure of health insurance coverage, indicating the percent of persons with that type of coverage at the time of the interview.
All changes described compare January-June 2020 to January-June 2019, and are statistically significant at the 95% confidence level unless otherwise specified.
Citations
Cohen, R.A., Terlizzi, E.P., Cha, A.E., & Martinez, M.E. (2021). Health insurance coverage: Early release of estimates from the National Health Interview Survey, January–June 2020. National Center for Health Statistics (NCHS). https://www.cdc.gov/nchs/data/nhis/earlyrelease/insur202102-508.pdf
Dahlhamer, J.M., Bramlett, M.D., Maitland, A., & Blumberg, S.J. Preliminary evaluation of nonresponse bias due to the COVID-19 pandemic on National Health Interview Survey estimates, April-June 2020. National Center for Health Statistics (NCHS). https://www.cdc.gov/nchs/data/nhis/earlyrelease/nonresponse202102-508.pdf?ACSTrackingID=USCDC_374-DM49266&ACSTrackingLabel=NHIS%20Early%20Release%3A%20Non-response%20Bias&deliveryName=USCDC_374-DM49266
Blog & News
Spotlight on Health Behaviors: Adult Who Forgo Needed Medical Care and Adults Who Have No Personal Doctor
December 21, 2020:Prior to the arrival of the novel coronavirus, much of American consumer health care concerns surrounded rising costs of care. With health care spending rising a reported 4.6 percent in 2018 and the Centers for Medicare and Medicaid Services (CMS) Office of the Actuary projecting an average annual increase of 5.4 percent for 2019 to hit a record $3.82 trillion or around $11,559 per person—this issue will remain at the forefront of concern for the foreseeable future.1
Compounding these trends in spending, the continued rise in the share of Americans without health insurance coverage has left more individuals without a means of protecting themselves or their families from the financial burden of illness or injury and without strong ties to health care providers and the health care system to access care.
The effects of rising health care spending and rising rates of uninsurance can be seen in direct measures of actual dollars, such as Medical Out-of-Pocket Spending and Percent of Individuals with High Medical Care Cost Burden, but also in more indirect avenues, such as changes in health behaviors and access to care.
Two measures of such behaviors, Adults Who Forgo Needed Medical Care and Adults with No Personal Doctor, are housed on SHADAC’s State Health Compare and have been recently updated with 2019 data from the Center for Disease Control's Behavioral Risk Factor Surveillance System (BRFSS). This blog provides an analysis of these indirect costs of rising health care spending and uninsurance in the year prior to the COVID-19 pandemic and examines overall national and state-level trends as well as comparisons across race/ethnicity and educational attainment.
Adults Who Forgo Needed Care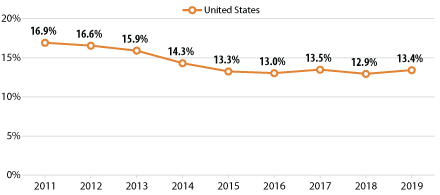
Across the nation, progress was made in reducing the percentage of adults who forgo needed medical care in the years following the passage of the Affordable Care Act (ACA). However, that progress began to flatten out by 2016 and has now begun to reverse course and display a trend of smaller but significant increases in recent years, such as the growth from 12.9% in 2018 to 13.4% in 2019 at the national level.
Trends by Education and Race/Ethnicity
Examining forgone care by individual breakdowns showed that disparities by education level and race/ethnicity, found in a previous SHADAC analysis, have persisted from the year before.
Across the U.S., adults with less than a high school degree saw their rates of forgone care hit 22.2% in 2019 from 21.1% in 2018;i a figure nearly triple the rate among adults with a bachelor’s degree, who saw their rate of forgone care rise to 7.9% in 2019 (up from 7.4% in 2018).
Nationally, Hispanic/Latino adults experienced the largest increase in rates of forgone care, rising to 21.4% in 2019 from 20.2% in 2018. African-American/Black and Hispanic/Latino adults were also significantly more likely to report going without needed medical care than White adults, with the former being 1.5 times more likely (15.7% vs. 10.9%) and the latter nearly twice as likely (21.4% vs. 10.9%).
State Trends
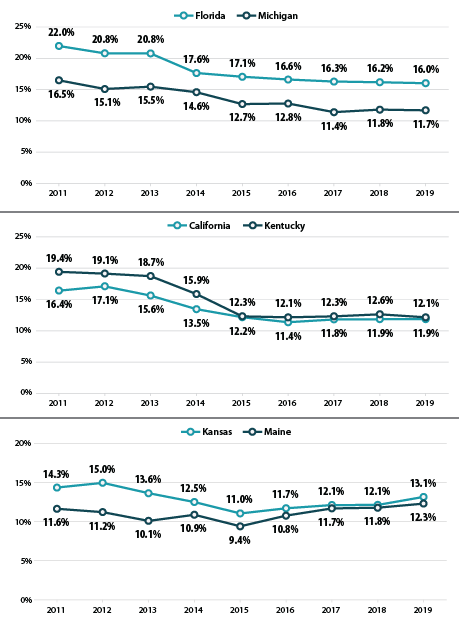
At the state level, the trends in forgone care are varied. Despite increasing national trends, some states, such as Florida and Michigan, have continued to make steady progress in reducing forgone care. Florida saw their overall rates drop by 5.9 percentage points,ii from 22.0% in 2011 to 16.0% in 2019, and Michigan saw a similarly steady drop in rates of forgone care from 16.5% in 2011 to 11.7% in 2019.
Unfortunately, progress in reducing the number of adults who report going without needed medical care has stalled in many states—California and Kentucky being two such examples. The former state has seen relatively unchanged rates of forgone care since 2016 (11.4%, 11.8% in 2017, and 11.9% in 2018 and 2019). The percentage of adults who have gone without needed medical care in Kentucky has likewise remained nearly unchanged from 2015 to 2019 (12.3% and 12.1%, respectively).
In other states, such as Kansas and Maine, rates of forgone care have followed the national trend and in 2015 begun reversing course on previous gains. The state of Kansas saw a 2.1 percentage-point increase from 2015 to 2019 (11.0% to 13.1%) and Maine saw a concerning increase of 2.9 percentage points during the same time period (9.4% in 2015 to 12.3% in 2019).
It is important to remember that these increases in forgone care occurred in the context of an economy that was growing steadily before the COVID recession. Though the release of 2020 data is at least another year away, early studies and surveys have given some indications as to the impact of the COVID-19 pandemic on health behaviors. SHADAC conducted a survey in April 2020 in which over half of U.S. adults (51.1 percent) said they had delayed or canceled health care appointments due to the pandemic.2
Adults With No Personal Doctor
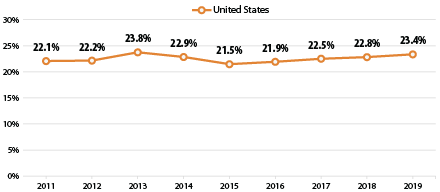 As with the measure of forgone medical care, more adults reported having a usual source of care after the passage of the ACA. However, once again this promising trend reversed itself in 2015, after which the percent of adults with no personal doctor or health care provider has increased each year, nearly reaching its pre-ACA peak in 2019 at 23.4% (23.8% in 2013). Both of these increasing trends have paralleled an increase in the rate of the uninsured across the nation, from 8.6% in 2016 to 9.2% in 2019.3
Trends by Education and Race/Ethnicity
Significant disparities by education level and race/ethnicity were again present for this measure in 2019.
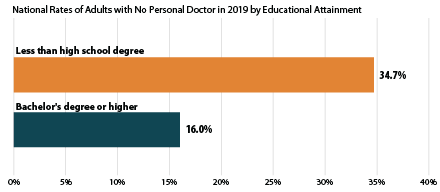 At the national level, adults with less than a high school education were more than twice as likely as adults with a bachelor’s degree to report not having a regular doctor (34.7% versus 16.0%). This pattern was consistent across more than half of states, as adults with less than a high school degree were more than twice as likely to report having no doctor as those with a bachelor’s degree in 26 states, and more than three times as likely in 5 states (Connecticut, Delaware, Maryland, Nebraska, and New Hampshire). There was no statistical difference between these educational groups in D.C. and 6 states (Kentucky, Mississippi, North Dakota, Tennessee, Vermont and West Virginia).
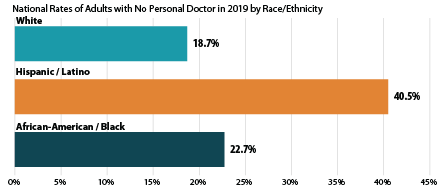 Nationally, Hispanic/Latino and Black adults were both significantly more likely to report not having a regular doctor as compared to White adults. Hispanic/Latino adults were more than twice as likely as White adults to report not having a personal doctor (40.5% vs. 18.7%), and African-American/Black adults were more than 1.2 times as likely as White adults to report not having a personal doctor (22.7% vs. 18.7%). Again this pattern persisted among over half of the nation, as Hispanic/Latino adults were more than twice as likely to report not having a regular doctor as White adults in 28 states, and more than three times as likely to report the same in 3 states (Delaware, Maryland, and Nebraska). African-American/Black adults were at least 1.2 times as likely to report not having a regular doctor as White adults in 17 states, and this gap measured 1.5 times or larger in 6 states (Nebraska, Iowa, Kansas, Massachusetts, Michigan and Utah).
Related Reading
Affordability and Access to Care in 2018: Examining Racial and Educational Inequities across the United States (Infographic)
Most U.S. Adults Report Reduced Access to Health Care due to Coronavirus Pandemic
Eleven Updated Measures are Now Available on State Health Compare
1 Hartman, M., Martin, A.B., Benson, J., & Catlin, A. (2019, December 5). National Health Care Spending in 2018: Growth Driven by Accelerations in Medicare and Private Insurance Spending. HealthAffairs, 39(1). https://doi.org/10.1377/hlthaff.2019.01451
Keehan, S.P., Cuckler, G.A., Poisal, J.A., Sisko, A.M., Smith, S.D., Madison, A.J., Rennie, K.E., Fiore, J.A., & Hardesty, J.C. (2020, March 24). National Health Expenditure Projections, 2019–28: Expected Rebound in Prices Drives Rising Spending Growth. HealthAffairs, 39(4). https://doi.org/10.1377/hlthaff.2020.00094
California Health Care Foundation (CHCF). (2019). Health Care Costs 101: Spending Keeps Growing. California Health Care Almanac. https://www.chcf.org/wp-content/uploads/2019/05/HealthCareCostsAlmanac2019.pdf
2 Planalp, C., Alarcon, G., & Blewett, L.A. (2020). Coronavirus pandemic caused more than 10 million U.S. adults to lose health insurance. https://shadac.org/news/SHADAC_COVID19_AmeriSpeak-Survey
3 State Health Access Data Assistance Center (SHADAC). (2020). 2019 ACS: Rising National Uninsured Rate Echoed Across 19 States; Virginia Only State to See Decrease (Infographics). https://www.shadac.org/sites/default/files/ACS_Estimates-2019-Infographic.pdf

