
Blog & News


State and Federal Relief Prevented Deep Backslide in Health Care Affordability in California in 2020 (CHCF Cross Post)
May 18, 2022:The following content is cross-posted from California Health Care Foundation. It was first published on May 18, 2022.
Author: Colin Planalp, Research Fellow, SHADAC
 In 2020, the start of the COVID-19 pandemic meant the imposition of incredible burdens on every corner of US society, particularly the health care system and the people it serves. There were well-founded fears that the pandemic, and the concurrent economic crisis, could make health insurance and health care unaffordable for even more people — already a long-standing problem in California.
In response to the pandemic, the US government enacted historic relief programs, including multiple instances of direct cash payments to a majority of US families. Those federal policies coincided with California health insurance reforms that, while developed before the pandemic, were implemented in 2020.
This analysis of the California Health Insurance Survey (CHIS) shows that Californians were largely protected from experiencing a major erosion in their ability to pay for health insurance and care. Despite this overall positive finding, the 2020 CHIS data on health care affordability continued to demonstrate clear inequities by income and race/ethnicity.
Key Findings
California’s uninsured rate declines, yet cost remains top reason for lacking health insurance. The rate of Californians under 65 without health insurance reached a historic low of 7.0% in 2020. However, 51.9% of uninsured people said they lacked coverage because it was too expensive.
Rate of going without needed care due to cost dropped in 2020. Among the 8.6% of Californians who reported forgoing needed medical care in 2020, 32.0% said it was concerns about the cost that caused them to go without care. That rate was significantly lower than the rate of 43.6% in 2019.
Fewer Californians reported difficulty paying medical bills. From 2019 to 2020, the rate of Californians reporting that they’ve had trouble paying medical bills in the past year declined significantly, from 13.3% to 11.1%. However, when breaking out the data by income, only those with higher incomes saw statistically significant improvement. Californians with lower incomes — 200% to 299% of federal poverty guidelines (FPG), 100% to 199% FPG, and below 100% FPG — reported no significant changes.
Less trouble affording necessities due to medical bills in 2020. In 2020, the rate of Californians who reported having trouble paying for basic necessities (such as food or clothing) because of medical bills declined significantly to 31.0% from 39.8% in 2019. Rates of trouble paying for necessities due to medical bills also declined across most income levels.
Practice of using credit card debt to finance medical bills declined. In 2020, the rate of Californians who reported taking on credit card debt to finance medical bills declined significantly, from 56.5% in 2019 to 44.3%. That finding held consistent for Californians across income levels — except for those with the lowest incomes.
Racial and ethnic disparities persisted in 2020. Although California experienced significant improvements in some measures of health care and insurance affordability in 2020, certain long-standing inequities persisted. For example, Black people reported the highest rate of trouble paying medical bills in 2020, at 14.0%, followed closely by Latinos/x, at 12.7%. Asians, Black people, and Latinos/x also reported similarly high rates of trouble paying for necessities due to medical bills (39.4%, 36.2%, and 33.1%, respectively).
Together, these findings provide some encouraging news. In a year of massive economic upheaval that would typically have caused serious financial problems for many Californians, they instead reported improvements in health care and insurance affordability. However, improvements were likely due, at least in part, to federal programs that were mostly designed to be temporary. Some have already expired. Additionally, the historically high inflation of 2021 and 2022 have since strained people’s finances.
But the fact that California experienced such measurable improvements in health insurance and health care affordability during a broad and deep recession shows that those problems don’t have to be intractable. In the future, it will be key to monitor these measures as policymakers in California and at the federal level consider initiatives to protect people against unaffordable health care and insurance costs, which remain a long-term challenge.
Blog & News

Covid-19 Vaccine Hesitancy in the U.S. has Reached a Plateau: Evidence from the Household Pulse Survey
April 1, 2022:Previous analysis produced by SHADAC using data from the Household Pulse Survey (HPS) showed promising evidence of a reduction in COVID-19 vaccine hesitancy during the first three months of 2021. However, though this report highlighted an overall decline in hesitancy, it also showed disparities in the level of hesitancy between demographic and socioeconomic groups. In an effort to continually illuminate barriers to vaccine receipt, this blog provides an updated look at vaccine hesitancy among U.S. adults (age 18 and older) using HPS data from January through October 2021.
|
The Household Pulse Survey is an ongoing weekly tracking survey designed to measure the impact of the COVID-19 pandemic. These data provide multiple snapshots of COVID-19 vaccine hesitancy and are the only data source to do so at the state level over time. Click on any graphic throughout this blog to view it in full-screen mode. |
The HPS allows respondents to identify multiple reasons for not receiving all vaccine doses.
For the survey period of January 6-July 5 the reasons listed on the survey form included:
| 1) Concerned about possible side effects 2) Plan to wait and see if it is safe and may get it later 3) Think other people need it more than I do right now 4) Don't know if a vaccine will work |
5) Don't trust the vaccine
6) Don't trust the government
7) Don't believe I need a vaccine
8) Don't like vaccines
|
9) Concerned about the cost of a COVID-19 vaccine 10) My doctor has not recommended it 11) Other reason |
For the survey period of July -October 11 the reasons listed on the survey form changed to include:
| 1) Concerned about possible side effects 2) Plan to wait and see if it is safe and may get it later 3) Don't know if a vaccine will protect me 4) Don't trust the vaccine |
5) Don't trust the government
6) Don't believe I need a vaccine
7) Don't think COVID-19 is that big of a threat
8) My doctor has not recommended it
|
9) Concerned about the cost of a COVID-19 vaccine 10) Hard for me to get a vaccine 11) Experienced side effects from 1st dose of vaccine 12) Believe one dose is enough to protect me |
Because the reasons for not receiving a vaccine changed between these two periods, they will be reported separately in our analysis.i
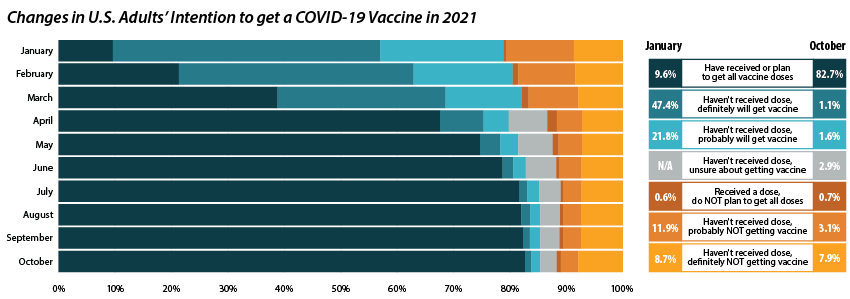
Share of adults who received or plan to receive all COVID-19 vaccine doses plateaued at the end of 2021.
From July through October 2021, the percent of people who have received or plan to receive all COVID-19 doses plateaued at around 80.0 percent.ii,iii This was after an initial jump from 9.6 percent in January to 67.6 percent in April. The initial increase drew mainly from the “Definitely planning to receive a vaccine” and “Probably going to receive a vaccine” groups. The percent of people who “Received a dose, but do not plan to receive all doses,” “Haven’t received a dose and are unsure about getting a vaccine,” “Haven’t received a dose and are probably not getting a vaccine,” and “Haven’t received a dose and definitely are not getting a vaccine” has also remained stable over the same period. Collectively, these four groups, which we define as being “hesitant,” dropped from a rate of 21.1 percent in January to 14.8 percent in July, where it’s remained since.
Vaccine Hesitancy varied by state, but nearly all states saw a reduction.
Nationally, 14.6 percent of adults reported being hesitant about the COVID-19 vaccine in October 2021. This varied across states, from a high of 28.9 percent in Wyoming to a low of 5.4 percent in the District of Columbia (D.C.).
The national rate of adult vaccine hesitancy decreased from 14.8 percent in July to 14.6 percent in October—a 0.2 percentage-point (PP) decrease. This overall decrease, though not significantly large, was reflected in 26 states plus D.C., which also saw promising reductions in vaccine hesitancy. Twenty-four states did not show reductions in hesitancy over that time period.
Concerns over possible side effects remains the top reason reported for vaccine hesitancy.
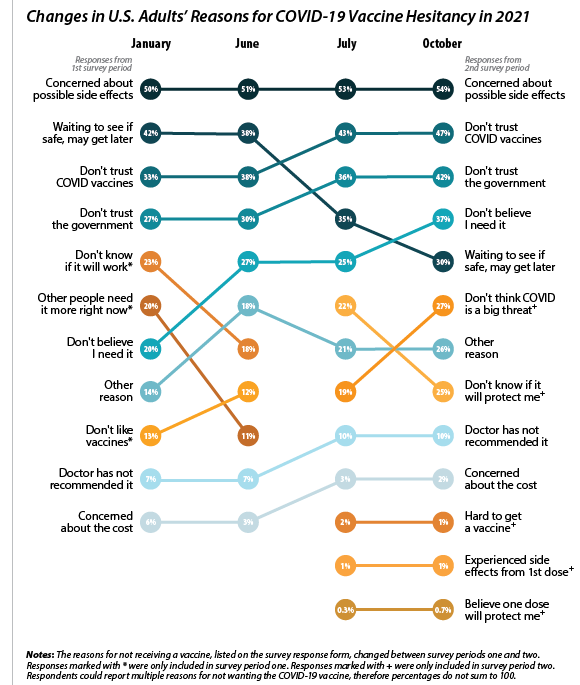 Of the 21.1 percent of people who reported hesitancy in January, nearly half (48.3 percent) cited “Concerns over possible side effects” as a reason.iv This continued to be the most reported reason for hesitancy, with 53.8 percent who were hesitant in October citing it as a reason. The percent of people reporting “Plan to wait and see if it is safe” declined over the 10-month period, from 42.1 percent in January to 30.4 percent in October, and dropped from the second to the fourth most reported reason behind “Don’t trust COVID-19 vaccine” and “Don’t trust the government.” This shift in reasoning behind vaccine hesitancy highlights a major barrier to vaccination goals, as establishing trust is a potentially more difficult and imprecise process than quelling fears of side effects.
When examining survey responses from January and October 2021, our analysis found that both the number of reasons for hesitancy (2.5 per person and 2.9 per person, respectively) and the most common reason for hesitancy (“concerns over possible side effects”) remained statistically unchanged between the two survey periods. Our analysis also found that the rankings of the reasons for hesitancy held within subpopulations by region, race/ethnicity, and income, as highlighted in the following sections.
Disparities in vaccine hesitancy improved over time, though many remain.
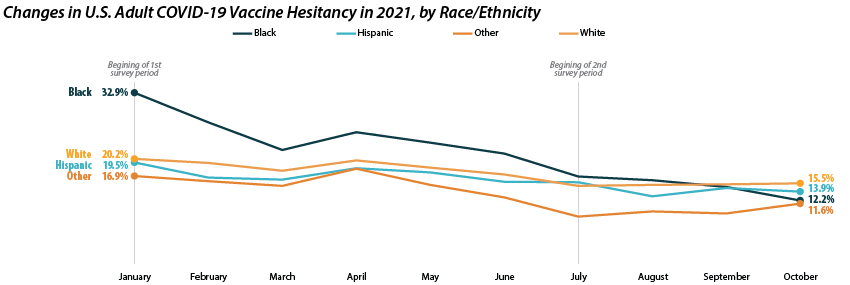
As with our previous analysis of the HPS, both overall hesitancy and disparities in vaccine hesitancy between demographic and socioeconomic groups has improved, though unevenly. The most notable reduction comes among Black adults, who registered a high of 32.9 percent in January and dropped down to 12.2 percent in October. This decline in vaccine hesitancy essentially closed the gap between Black adults and other racial/ethnical groups. Unfortunately, the rate of decline seems to have reached a plateau among certain demographics. For example, among White adults the hesitancy rate stabilized at around 15.0 percent between July and October.
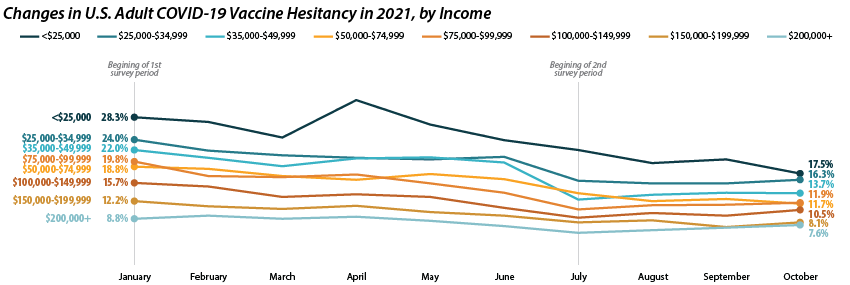
Similar patterns appear when looking within and across income level. Those making less than $25,000 reported the highest level of hesitancy in January at 28.3 percent, but have shown a marked reduction down to 17.5 percent in October. This has significantly closed the gap in hesitancy between this group and those at higher income levels. However, once again, changes within subgroups appear to have reached a stable level of hesitancy. Among those making $50,000-$74,999 this appears to be around 12.0 percent, while for those making $150,000 or more, this appears to be around 7.0 percent.
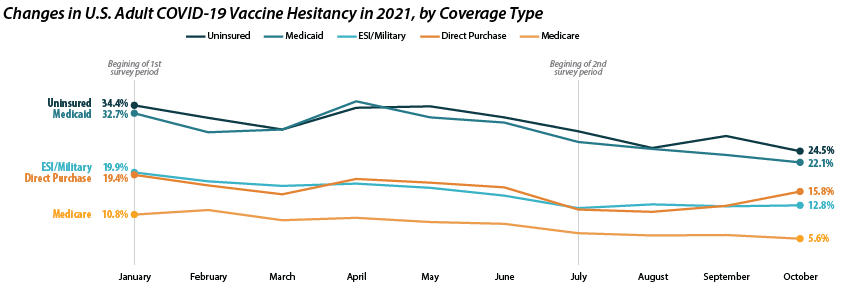
Patterns of reduced vaccine hesitancy followed by rate leveling continued to be true among groups with fewer connections to the health care system, as proxied by insurance status. Hesitancy rates have fallen generally across all insurance statuses; however, the uninsured and those with Medicaid coverage continue to have the highest rates of hesitancy, at 24.5 percent and 22.1 percent in October as compared to those with ESI/Military, Direct Purchase, or Medicare coverage.
Note: All changes and differences in this post are statistically significant at the 95% confidence level unless otherwise noted.
Related Reading
SHADAC Blog: Vaccine Hesitancy Decreased During the First Three Months of the Year: New Evidence from the Household Pulse Survey
SHADAC Blog Series: Measuring Coronavirus Impacts with the Census Bureau's New Household Pulse Survey: Utilizing the Data and Understanding the Methodology
i U.S. Census Bureau. (2021, November 3). 2021 Household Pulse Survey User Notes [Phase 3.2]. https://www2.census.gov/programs-surveys/demo/technical-documentation/hhp/Phase3-2_2021_Household_Pulse_Survey_User_Notes_11032021.pdf
ii This only includes primary series doses and excludes booster doses.
iii This percentage is higher than administratively reported COVID-19 vaccine receipt. The differences are due to both the inclusion of those who “Plan to receive all vaccine doses” and the known discrepancies between administrative and survey data.
iv The HPS allows those who are “Probably going to receive a vaccine” to report reasons for hesitancy; however, this group is not included in our definition of “hesitant.”
Blog & News

Expert Perspective and Issue Brief: Tracking the Data on Medicaid’s Continuous Coverage Unwinding (State Health & Value Strategies Cross-Post)
January 21, 2022:The following content is cross-posted from State Health and Value Strategies published on January 21, 2022.
Authors: Emily Zylla, Elizabeth Lukanen, and Lindsey Theis, SHADAC
Medicaid and Children’s Health Insurance Plan (CHIP) programs have played a key role in the response to the COVID-19 pandemic, providing a vital source of health coverage for millions of people. However, when the Families First Coronavirus Response Act (FFCRA) Medicaid “continuous coverage” requirement is discontinued states will restart eligibility redeterminations, and millions of Medicaid enrollees will be at risk of losing their coveragei.
A lack of publicly available data on Medicaid enrollment, renewal, and disenrollment makes it difficult to understand exactly who is losing Medicaid coverage and for what reasons. Publishing timely data in an easy-to-digest, visually appealing way would help improve the transparency, accountability, and equity of the Medicaid program. It would inform key stakeholders, including state staff, policymakers, and advocates, allowing them to more fully understand the impacts of Medicaid policy changes on enrollees’ access, and give them an opportunity to modify or implement intervention strategies as needed. States already collect a significant amount of data that could inform their success in enrolling and retaining eligible individuals in Medicaid. Many advocates and researchers have been calling for increased transparency around this data in order to better understand the barriers and challenges individuals face when trying to enroll in or maintain coverage.
One effective way to monitor this dynamic issue is by creating and publishing a Medicaid enrollment and retention dashboard. A typical data dashboard is designed to organize complex data in an easy-to-digest visual format, thus allowing the audience to easily interpret key trends and patterns at a glance. A new issue brief examines the current status of Medicaid enrollment and retention data collection, summarizes potential forthcoming reporting requirements, and describes some of the best practices when developing a data dashboard to display this type of information.
The issue brief lays out a phased set of priority measures and provides a model enrollment and retention dashboard template that states can use to monitor both the short-term impacts of phasing out public health emergency (PHE) protections and continuous coverage requirements, as well as longer-term enrollment and retention trends.
State Medicaid Enrollment and Retention Dashboard – Measurement Priorities
 Priority 1 – Use currently reported data: Start with the data that are already collected and submitted to the Centers for Medicare & Medicaid Services (CMS) under the 11 Medicaid performance topics.
Priority 2 – Track reasons for disenrollment: Include measures in the proposed Build Back Better Act (BBB) legislative language that address the reasons why people are being disenrolled.
Priority 3 – Monitor coverage transitions: Add measures to address issues of transitions between programs and churn—the moving in and out of coverage—that frequently occurs in Medicaid and CHIP.
Priority 4 – Explore reasons for and consequences of disenrollment: Field disenrollment surveys that could provide quantitative and qualitative data that could be used to understand both the enrollee’s experience navigating Medicaid processes as well as the consequences of disenrollment.
Regardless of the measures highlighted, an overarching goal of any Medicaid enrollment and retention dashboard should be a focus on displaying disaggregated data. Providing data broken down by various population characteristics (e.g., age, race/ethnicity, income, gender, language, or program type) or geographic areas (urban, rural) will make it easier to understand the potentially disproportionate impact of administrative enrollment and renewal policies on communities of color, persons with lower incomes, and other populations that face disparities. Access to this type of granular data provides stakeholders an opportunity to take action in order to minimize needless loss of coverage.
Designing an easy-to-understand dashboard that is accessible to all interested stakeholders—state or county program staff, navigators or enrollment assisters, and advocates—will highlight the early warning signs of large numbers of people losing Medicaid coverage. States should start small, using data dashboard best practices and as they gain experience publicly reporting this data, consider adding additional measures over time.
i Buettgens, M. & Green, A. (September 2021). What Will Happen to Unprecedented High Medicaid Enrollment after the Public Health Emergency? [Research report]. Urban Institute. https://www.urban.org/sites/default/files/publication/104785/what-will-happen-to-unprecedented-high-medicaid-enrollment-after-the-public-health-emergency_0.pd
Publication
COVID-19 illness personally affected nearly 97 million U.S. adults
New brief shows results from SHADAC COVID-19 Survey on population experiences with COVID sickness and death
Researchers at SHADAC have fielded an updated version of the SHADAC COVID-19 Survey in April 2021, aimed at understanding respondents’ experiences with illness and death due to COVID-19 for themselves, their families, and their contacts.

Results from the survey, presented in the brief to the right, showed that almost 40% of adults in the U.S.:
- Know someone who has died from COVID.
Among the adults surveyed, 37.7 percent responded that they know someone who died from the coronavirus. By race/ethnicity, roughly half of Black (56.9 percent) and Hispanic (48.2 percent) adults reported knowing someone who died of COVID-19, a significantly higher amount than White adults or those who reported as “any other” or multiple races. Other breakdowns for this question included age, income level, and education level, for which adults reported similar rates to the overall total (37.7 percent), for knowing someone who died from the coronavirus.
- Either themselves have, or had a family member who has, contracted COVID.
Among the adults surveyed, 37.6 percent responded that either they or a family member had become ill due to COVID. Notable breakdowns included about half of Hispanic adults (51.5 percent) who reported that they or an immediate family member had COVID-19, and adults with some college or associate’s degree (44.0 percent) were also more likely to report that they or an immediate family member had COVID-19. Among other categories of age and income level, significantly different percentages from the overall total (37.6 percent) were not seen.
More on the survey
The SHADAC COVID-19 Survey on the impacts of the pandemic on respondents’ experiences with COVID-related illness and death was conducted as part of the AmeriSpeak Omnibus Survey conducted by NORC at the University of Chicago. The survey was conducted using a mix of phone and online modes in April 2021 among a nationally representative sample of 1,007 respondents age 18 and older.
This survey is a continuation of the initial SHADAC COVID-19 Survey, which was aimed at understanding the impacts of the coronavirus pandemic on health care access and insurance coverage and pandemic-related stress, and was conducted as part of the same survey, by the same agency, during a similar time frame (April 24-26, 2020), using the same methods, and a similar population sample.
Results from the first iteration of the survey are available in separate briefs on health insurance coverage and access to care and pandemic-related stress, as well as in a pair of chartbooks.
Publication
Changes in Federal Surveys Due to and During COVID-19 Brief
 On a recent webinar, the U.S. Census Bureau made the announcement that they will not be releasing 2020 data from the American Community Survey (ACS) as usual in September. Instead, due to the impact of the coronavirus pandemic, “experimental” estimates will be available in November. This substantial change to the data release of a major federal survey highlights one (among many) of the disruptive effects of the coronavirus—the interruption of data collection processes and falling response rates for yearly federal surveys.
Other federal agencies have made their own attempts at adapting surveys to address pandemic-related challenges: delaying data release dates, shifting in-person collection methods to phone and email, adding COVID-related questions to their questionnaire, canceling survey collection for the year, or even creating an entirely new survey, such as the Census Bureau’s new Household Pulse Survey (HPS).
A new brief from SHADAC summarizes these and other COVID-era changes and challenges for four major federal surveys—American Community Survey (ACS), Current Population Survey (CPS), Medical Expenditure Panel Survey (MEPS), and National Health Interview Survey (NHIS)—and explains what effects these adaptations may have for understanding 2020 data as it becomes available.
For more announcements and information related to the 2020 ACS data release changes, visit our webpage.

