
Blog & News
Lukanen, Elizabeth
Zylla, Emily


Best Practices for Publicly Reporting State Unwinding Data (Cross-Post)
June 30, 2023:
The following content is cross-posted from State Health & Value Strategies.
Authors: Elizabeth Lukanen, Emily Zylla, SHADAC
Original publication date: June 30, 2023.
The unwinding of the Medicaid continuous coverage requirement represents the largest nationwide coverage transition since the Affordable Care Act. With the restarting of eligibility redeterminations, millions of Medicaid enrollees are now at risk of losing their coverage and there is intense interest in monitoring the impact on coverage. To promote transparency, the Centers for Medicare & Medicaid Services (CMS) is requiring that states report the results of eligibility redeterminations and many states are making that data public. SHVS continues to monitor the states that are publicly reporting their unwinding data either in the form of data dashboards or static pdfs and the states posting copies of their required CMS Monthly Unwinding Data reports.
As advocates and researchers start to analyze unwinding data, it has become clear that it is difficult to compare different states for a variety of reasons. For example, states are initiating redeterminations and therefore disenrollments in different months and some states are staging redeterminations in a way that focuses on certain groups first, such as starting with people least likely to remain eligible. States are using a variety of different strategies to mitigate procedural terminations. States also use different terminology, definitions, population denominators, and timeframes on their reporting, which also makes it difficult to compare one state’s data to another.
In spite of data challenges, there are some best practices states can follow when reporting unwinding data.
- Release CMS Monthly Reports. While we typically don’t recommend releasing competing sources of data on the same topic, in this case, we recommend releasing CMS Monthly Reports alongside any state-specific data reporting to help satisfy calls from advocates and the media for comparable data across states. However, we recommend that states provide context about why the information may differ on state dashboards from CMS monthly reports. Kansas, for example, explains that data on their monthly unwinding reports is different from data on their dashboard because members move between reported categories.
- Timely release. Given the magnitude and scrutiny of unwinding coverage transitions, we recommend that states produce a data report that can be updated easily and frequently – at least monthly. We recommend prioritizing accuracy and timeliness over depth. And, if states are refreshing state unwinding data monthly, they should consider releasing it in tandem with the CMS Monthly Unwinding data reports.
- Prioritize key measures. Because timeliness of this data is so important, the report or dashboard needs to have enough data points to convey key information, but be limited enough to update quickly. In this case, we recommend focusing on measures that are already being reported (CMS Performance Indicators and indicators from the CMS Monthly Unwinding Data report). Key measures include:
- Renewals initiated
- Successful renewals
- Ex-parte/passive renewals
- Coverage terminations
- Procedural terminations
- Medicaid cases sent to the Marketplace
- Call center volume
- Number of terminations who reenroll in a specific period of time (e.g. 90 days)
- Publish disaggregated data. While required CMS data reporting includes very limited data disaggregation, there is a great interest in understanding who is being impacted by the unwinding. At a minimum, we recommend displaying data breakdowns by:
- Program type
- Age (children versus adults)
- Race
- Ethnicity
- Language
- Income
- Geography (ZIP code is best, but by county or any other level lower than statewide is helpful)
- Provide context and transparency. As noted above, there are many reasons that the data reported by different states might be difficult to compare. We strongly encourage states to use their reporting vehicle to contextualize and explain various measures. This includes:
- Document data revisions. We anticipate that states may be asked by CMS to make various adjustments retroactively to their data. States do not need to wait until data is final to post it publicly. They can address this by including revision dates when new data are posted. And wherever possible, maintain an archive of older data for comparability.
- Include both proportions and counts. Proportions are especially useful to help make comparisons across states on measures like procedural denials, but counts are critical for understanding the denominators being used and to get a sense for the magnitude of impacts within states.
- Include data labels, definitions, and context. Provide clear data labels, establish defined date ranges for data being displayed, add data refresh dates (as needed), describe population numerators and denominators if relevant (including exclusions such as pending cases). If the format allows, link to information that can help contextualize the information. This might include the state’s unwinding timeline, information about how redeterminations are being staged or any analysis or reaction to the results to date. For example, California posts their plan for prioritizing and distributing renewals on the same page as their unwinding data. Kentucky also has a webpage dedicated to unwinding that includes the state’s unwinding dashboard (the Kentucky Medicaid Renewals Data Snapshot), their required CMS unwinding reports and materials from monthly stakeholder sessions that provide a summary of the federal requirements, state goals and activities and their progress to-date.
Related SHVS Expert Perspectives:
Blog & News

SHADAC at the 2023 AcademyHealth Annual Research Meeting
June 1, 2023:A number of SHADAC researchers will be presenting their work at the 2023 AcademyHealth Annual Research Meeting (ARM) taking place in Seattle, WA from Saturday, June 24 to Tuesday, June 27. For details on research topics and where you can find their posters and presentations, see below.
Association of Discrimination Based on Sexual Orientation and Gender Identity with Health Care Access and Health Outcomes

Presented in “Building the Evidence on Under-Recognized Populations” session on Monday, June 26, 2023 at 1:00 PM.
Discrimination based on sexual orientation and gender identity (SOGI) represents an important barrier to health care access. Few studies have examined SOGI-based discrimination experienced in a health care setting and its association with health care access and health outcomes, including confidence in getting care and physical and mental health. Our study fills this gap by using inclusive SOGI data and correlating direct reports of discrimination with a range of health-related outcomes. Download the presentation slides here.
Authors: Natalie Schwehr Mac Arthur (Presenter), Kathleen Panas, Kathleen T. Call
Supporting Families: Associations between Neighborhood Support and Child Health Outcomes

Presented in “Child and Family Health Poster Session” on Monday, June 26th from 2:45 PM-4:00 PM.
Living in a supportive neighborhood is one measure of social capital, which is an important social determinant of health. However, few nationally representative studies have examined the relationship between neighborhood support and the health status of children, including adverse childhood experiences (ACEs). We fill this gap using nationally representative data that includes important information on neighborhood and family characteristics.
Authors: Natalie Schwehr Mac Arthur (Presenter), Colin Planalp, Lynn A. Blewett
Factors Associated with COVID-19 Symptoms Longer Than Three Months (long COVID): Evidence from the Household Pulse Survey
Presented in “Best Student Poster Symposium” from 11:00 AM-12:30 PM and “Poster Session A” from 3:30 PM-4:45 PM, on Sunday, June 25th.
Prior research on long COVID focuses on biological determinants; however, recent commentary suggests incorporating social and experiential factors into models of the disease may provide more explanatory power. We use the Household Pulse Survey–a survey administered collaboratively through multiple federal agencies–to help answer this question.
Authors: James Campbell (Presenter), Lynn A. Blewett, Robert Hest
Blog & News
Reporting Requirements Related to Unwinding Medicaid Continuous Coverage: Considerations for Medicaid and the Marketplace (State Health & Value Strategies Expert Perspective Cross-Post)
February 9. 2023:
The following content is cross-posted from State Health & Value Strategies.
Original publication date: February 9, 2023.
Authors: Elizabeth Lukanen, Emily Zylla, SHADAC
The Families First Coronavirus Response Act implemented a Medicaid continuous enrollment requirement which was enacted to preserve coverage during the COVID-19 public health emergency and has resulted in a sharp increase in enrollment. Since February 2020, enrollment in Medicaid and the Children's Health Insurance Program (CHIP) has increased by 20.2 million enrollees. When the unwinding of the Medicaid continuous coverage requirement begins, it will represent the largest nationwide coverage transition since the Affordable Care Act. As states restart eligibility redeterminations, millions of Medicaid enrollees will transition to other coverage and some will become uninsured. Now that the details and timing associated with the unwinding of the Medicaid continuous enrollment requirement have been established by the Consolidated Appropriations Act, 2023 (CAA), states can start refining and implementing long laid plans to restart eligibility redeterminations and return to routine eligibility and enrollment operations.
As part of this process, states will be required to closely track and monitor the impacts of the resumption of eligibility redeterminations and disenrollments and to make that data public. The Centers for Medicare and Medicaid Services’ (CMS) commitment to transparency is mirrored by calls from advocates and researchers eager to see how progress is being made as people enrolled in Medicaid have their eligibility redetermined. This expert perspective outlines the relevant reporting requirements that were included in the CAA and the corresponding reporting guidance provided by CMS in its January 2023 State Health Official letter, and presents considerations for state officials as they fulfill their federal obligations and address calls from advocates and others for transparency.
Reporting Requirements During Unwinding
The Consolidated Appropriations Act, 2023 established a set of reporting requirements related to unwinding that will, for the first time, be made publicly available by CMS. Box 1 provides an overview of the CAA required reporting indicators. CMS believes that all of the measures overlap with indicators Medicaid/CHIP agencies and state-based marketplaces (SBMs) are currently required to report, including as part of: the monthly Unwinding Data Report (outlined in a March 2022 State Health Officer letter and detailed in subsequent Data Specifications; through existing Performance Indicators and T-MSIS submissions; or via existing SBM Priority Metrics.i Therefore, CMS does not anticipate that states or SBMs will need to submit a separate report (or additional reporting) to comply with the new CAA requirements. Additionally, CMS plans to report on behalf of states that use the federal eligibility and enrollment platform (FFM states) as well as SBMs on the federal platform (SBM-FP states).
Although there is no new data reporting being required, the indicators that states report will be made public for the first time; in addition, there are new enforcement provisions and penalties for noncompliance. Reporting and enforcement provisions released as part of the CAA start on page 3,859, and more detail is available in a CMCS Informational Bulletin from January 5, 2023 (“Key Dates Related to the Medicaid Continuous Enrollment Condition Provisions in the Consolidated Appropriations Act, 2023”) which also revises due dates for existing unwinding reports such as the Renewal Distribution Planii (due February 1, 2023 for states initiating renewals in February or February 15, 2023 for all other states ) and the Baseline Unwinding Report (due the eighth day of the month in the month that the state initiates renewals). Additional reporting requirement information is also available beginning on page 17 of the January 2023 SHO letter.
| Box 1. CAA Required Monthly Indicators and Data Sources | |
|---|---|
| Reporting Element | Mode of Submission |
| Medicaid/CHIP Indicators | |
| Applies to all states | |
| · Total number of renewals initiated | Monthly Unwinding Report, Metric 4 |
| · Total number of successful renewals | Monthly Unwinding Report, Metric 5a |
| - Number of ex-parte renewals | Monthly Unwinding Report, Metric 5a(1) |
| · Total number of coverage terminations | Monthly Unwinding Report, Metric 5b & 5c |
| - Number of procedural terminations | Monthly Unwinding Report, Metric 5c |
| · Total number enrolled in a separate CHIP | T-MSIS, CHIP-CODE |
| · Total call center volume | Medicaid/CHIP Performance Indicator 1 |
| · Average wait times | Medicaid/CHIP Performance Indicator 2 |
| · Average abandonment rate | Medicaid/CHIP Performance Indicator 3 |
| Marketplace Indicators | |
| Applies to states that use the federal eligibility and enrollment platform | |
| · Total number of individual accounts received at the marketplace from Medicaid/CHIP due to a redetermination | N/A—CMS plans to report on behalf of states with FFMs and SBMs on the federal platform (SBM-FPs). |
| - Number determined eligible for a qualified health plan (QHP) | |
| - Of those determined eligible, number who selected a QHP | |
| Applies to states that use an SBM without an integrated eligibility system | |
| · Number of individuals whose accounts are received by the SBM or basic health program (BHP) | Monthly SBM Priority Metrics, 7a & 7b |
| - Number determined eligible for a QHP or BHP | Monthly SBM Priority Metrics, 9a & 172a |
| - Of those determined eligible, number who selected a QHP or enrolled in a BHP | Monthly SBM Priority Metrics, 1a & 169a |
| Applies to states that use an SBM with an integrated eligibility system | |
| · Number determined eligible for a QHP or a BHP | Monthly SBM Priority Metrics, 9a & 172a |
| - Of those determined eligible, number who selected a QHP or enrolled in a BHP | Monthly SBM Priority Metrics, 1a & 169a |
| Important Notes: · CMS also reserves the right to add reporting metrics, if needed, in the future. · The CAA specifically indicates that these data should be reported monthly from April 1, 2023 through June 30, 2024 and that they will be made publicly available. · Failure to comply with the reporting requirements is associated with penalties, which include regular FMAP reductions and the necessity of a corrective action plan (See Enforcement and Penalty section below). · States should also continue to report other related Medicaid data; this was highlighted in recent CMS guidance. This includes Medicaid and CHIP eligibility and enrollment Performance Indicators as well as the submission of state files to the Transformed Medicaid Statistical Information System (T-MSIS). · Currently, the standards to qualify as an integrated eligibility determination system are undefined. · The CAA also requires a one-time submission of systems readiness artifacts that include configuration plans (e.g., Implementation Plan), testing plans, and test results. System readiness artifact documents should be based on state or vendor developed formats. CMS templates will not be provided. Details on what should be included in the readiness documents and how these documents should be submitted are outlined in a refresher document released by CMS in January 2023. |
|
Reporting Timeline
Although CMS expects states will be able to meet the reporting requirements outlined above through existing reports and tools, the timing of certain state reporting may need to change in order to meet the requirements of the CAA. See Box 2 for an overall reporting timeline. All states will now have to submit monthly unwinding data reports from April 1, 2023 through June 30, 2024. This means that states who initiate their first batch of renewals in February 2022 will now have to submit monthly unwinding data for a period that exceeds 14 months.
| Box 2. Reporting Timeline | ||
|---|---|---|
| Requirement | Due Date | |
| States Initiating Renewals in February | States Initiating Renewals After February | |
| Renewal Distribution Plan | 1-Feb-23 | 15-Feb-23 |
| Systems Readiness Artifacts | 1-Feb-23 | 15-Feb-23 |
| Baseline Unwinding Data Report | 8-Feb-23 | Eighth day of the month in which renewals begin |
| Monthly Unwinding Data* Reports | Eighth day of the month during unwinding through June 30, 2024 | |
| Monthly Performance Indicators* | Eighth day of the calendar month | |
| SBM Priority Monthly Metrics* | TBD | |
*Reporting overlaps with requirements in the CAA.
Note: Should the eighth calendar day fall on a weekend or holiday, states may submit by the next business day.
Enforcement and Penalty
To assure transparency and timely reporting, the CAA includes penalties for states that do not meet the reporting requirements (Box 3). Most notably, if a state does not report the required data starting in July 2023, it will face a reduction in the state’s Federal Medical Assistance Percentage (FMAP) by .25 percentage points for each quarter in which the state fails to satisfy the reporting requirements (up to a maximum of one percentage point). The full set of penalties associated with non-compliance are summarized below and were presented in a State Health and Value Strategies webinar, “Omnibus Unwinding Provisions and Implications for States.”
| BOX 3. | ||
|---|---|---|
| The CAA vests CMS with targeted oversight and enforcement powers related to unwinding. These enforcement mechanisms extend beyond the ability for CMS to eliminate the enhanced FMAP for states that do not meet required conditions. | ||
| Penalty | Trigger | Notes |
| 1) Regular FMAP reduction for failure to report required information | CMS determines that for the period from July 1, 2023 through June 30, 2024, a state fails to comply with the CAA reporting requirements. | A state’s FMAP for the quarter will be reduced by 0.25 percentage points, plus an additional 0.25 points for each prior quarter of noncompliance (not to exceed 1 percentage point). |
| 2) Corrective Action Plan | CMS determines that for the period from April 1, 2023, through June 30, 2024, a state has failed to comply with: - The CAA reporting requirements; or - Any “federal requirements applicable to eligibility redeterminations.” |
The legislation establishes timelines for timely submission, CMS approval, and implementation of the CAP. |
| 3) Suspension of procedural terminations* and/or civil monetary penalties of up to $100,000 a day | CMS determines that a state has failed to submit or implement its corrective action plan. | It remains to be seen how and the degree to which CMS will exercise these enforcement actions and how states will respond. |
*Procedural terminations occur when potentially eligible individuals fail to respond to a state Medicaid/CHIP agency’s request for additional information as part of the redetermination process.
Consideration for Unwinding Reporting Requirements for States
As states prepare for the unwinding of the continuous coverage requirement and the implementation of new required reporting activities, they should consider ways to demonstrate and communicate progress with key partners. The following strategies will ensure transparency to stakeholders, who will be critical in supporting coverage retention for eligible enrollees, while also keeping policymakers informed about the success of this transition.
| Seek technical assistance from CMS or SHVS to improve reporting. States that are unable to submit data as defined are directed to check a box labeled “Unable to Report” and include an explanation of why the state cannot report the metric. Guidance goes on to say that CMS may follow up to discuss further. States that cannot report these baseline metrics can take advantage of any technical assistance that CMS offers in order to improve the reporting of this data. Without this minimum, up-to-date data, states, policymakers, advocates, and other key stakeholders lose the opportunity to identify barriers that populations may be facing to enroll or renew their Medicaid coverage, as well as opportunities to identify effective solutions. SHVS is also available to support states through technical assistance. Please contact Heather Howard at heatherh@princeton.edu. |
Coordination Between Medicaid and Marketplaces. The reporting requirements in the CAA include measures from both Medicaid and the marketplace. At a minimum, state Medicaid agencies will want to coordinate with their state-based marketplace (SBM) or the federally facilitated marketplace (FFM) on metrics that affect both groups, such as call center data or information on the number and outcomes of electronic transfers. For states in which the same agency operates its Medicaid program and the SBM, there may be fewer barriers to coordinating the data, but all states should align to operationalize how and when the data are shared with the public. Pre-planning and coordination in advance of the first report can help streamline staff effort and reduce confusion.
Sharing Relevant Information Publicly. The CAA clearly states that metrics submitted to monitor eligibility redeterminations will be made publicly available. Details on how and when these data will be shared with the public are forthcoming, but states should expect this and consider releasing their own communications to ensure accurate interpretation of their data and to provide context about their successes and challenges. This could include measures required for the unwinding as well as Performance Indicator data that could help serve as an early warning sign as to how applicants and enrollees are faring on renewals and redeterminations. States will likely face requests for information from advocates and researchers who have already called for increased transparency. By publishing information on retention and disenrollment, successful transitions to new coverage, and changes to the numbers and rates of uninsured, states can meet these information needs in an organized and timely way while also controlling their data and message. Some states, such as Utah, are considering publishing new Medicaid enrollment and retention dashboards that would track this type of data in more easily digestible, visually appealing ways, and we encourage states to explore that possibility. SHVS will continue to monitor state activities in this area and will plan additional programming or publications as public dashboards become available.
Consider Reporting Data That Is Disaggregated Beyond What CMS Requires. The CMS guidance does not require states to report data disaggregated any further than by modified adjusted gross income and non-disability applications versus disability applications. Data broken down by various population characteristics (e.g., age, race/ethnicity, income, gender, language, or program type) or geographic areas make it easier to understand the disproportionate impact enrollment and renewal policies have on groups that have been economically and socially marginalized. States can prioritize the monitoring and reporting of disaggregated data even though CMS has not required it. At a minimum, we recommend displaying data breakdowns by program type, age, race, ethnicity, and geography (ZIP code is best, but county or region is also helpful). States should also consider additional breakdowns as the data is available, such as by language, income, and disability status. Data reported in this way would help improve the transparency, accountability, and equity of the Medicaid program.
Consider the Guidelines a “Floor” and Expand Monitoring Measures to Get Better Insights Into Unwinding. The reporting requirements and resources from CMS set the minimum amount of reporting that all 50 states should produce. For states with the bandwidth and resources, additional analysis could include an in-depth study of churn during this period or for specific groups, or an evaluation of outreach and enrollment strategies designed to identify what worked to keep people enrolled (e.g., color letter campaigns, assister training, ad campaigns, etc.). States could also assess coverage transitions and reasons for and consequences of disenrollment by fielding a disenrollment survey. This could provide quantitative and qualitative data that could be used to understand both enrollees’ experiences navigating Medicaid processes as well as the consequences of disenrollment.
Blog & News
Issue Brief: Unwinding the Medicaid Continuous Coverage Requirement - Transitioning to Employer-Sponsored Coverage (State Health & Value Strategies Cross-Post)
January 2023:The following content is cross-posted from State Health and Value Strategies, published on January 19, 2023.
Authors: Elizabeth Lukanen and Robert Hest, SHADAC
 Medicaid and the Children’s Health Insurance Program (CHIP) have played a key role in the response to the COVID-19 pandemic, providing a vital source of health coverage for millions of people. The Families First Coronavirus Response Act (FFCRA) implemented a continuous coverage requirement in Medicaid, coupled with an increase in federal payments to states. The requirement has prevented states from disenrolling Medicaid enrollees, except in limited circumstances, allowing millions of Americans continued access to healthcare services during the pandemic.
Enrollment in Medicaid and CHIP has grown sharply since February 2020, with more than 20 million enrollees added to state rosters as of September 2022. Continuous coverage can also likely be credited for the decrease in the number of people who were uninsured in 2021, down to 8.6% from a pre-pandemic level of 9.2% in 2019. This was driven by a 1.4 percentage point increase in public coverage in 2021, to 36.8% from 35.4% in 2019. These trends were mirrored across states, with 28 states experiencing significant decreases in their rates of uninsurance. Meanwhile, 36 states saw rising rates of public coverage with none seeing a decline in public coverage.
When the unwinding of the Medicaid continuous coverage requirement begins, states will restart eligibility redeterminations, and millions of Medicaid enrollees will be at risk of losing their coverage. Estimates vary, but most approximate that in the range of 15 million to 18 million people will lose Medicaid coverage, with some portion exiting because they are no longer eligible, some losing coverage due to administrative challenges despite continued eligibility, and some transitioning to another source of coverage. While much attention has been paid to how states can approach the unwinding of the continuous coverage requirement to prioritize the retention of Medicaid coverage and transitions to marketplace coverage, less attention has been paid to the role of employer-sponsored insurance.
To get a sense for the size of the group that might have employer-sponsored coverage as an option, this issue brief discusses the proportion of individuals with an offer of employer-sponsored coverage by income and state, and the proportion of those offers that are considered affordable based on premium cost. The issue brief also discusses the importance of a Medicaid disenrollment survey to monitor the coverage transitions associated with the unwinding.
A companion issue brief, Helping Consumers Navigate Medicaid, the Marketplace, and Employer Coverage, discusses how state Medicaid agencies, state-based marketplaces, labor departments, and employers can play critical roles in helping people understand and navigate their employer coverage options.
To support communications efforts during the unwinding, SHVS has also produced sample messaging for state departments of labor to share with the employer community which explains the unwinding and coverage options for employees.
Blog & News

Pandemic-Era Trends in Employer-Sponsored Health Insurance (ESI), 2019-2020
July 7, 2022:The COVID-19 pandemic continues to disrupt many patterns of life and work in the United States and internationally, while exacerbating many long-standing concerns regarding health care affordability, access, and utilization as well as rates of health insurance coverage for Americans. In this regard, one area of potential pandemic-related impact to consider is coverage rates for employer-sponsored health insurance (ESI), which remains the largest source of coverage for Americans, with 60.1 million private-sector employees enrolled in ESI in 2020.1
In anticipation of the release of the 2021 Medical Expenditure Panel Survey Insurance Component (MEPS-IC) data, SHADAC researchers analyzed private-sector ESI estimates from the 2020 MEPS-IC to better contextualize the forthcoming 2021 estimates. Understanding 2020 coverage data will supply a pandemic-era baseline, while providing a critical vantage point from which to observe and interpret trends in ESI composition, affordability, and access in this critical market.
This narrative provides an overview of the 2020 MEPS-IC private-sector ESI estimates, covering firm size, ESI cost, and access. It’s important to note that the overlay of COVID-19 on this data makes it difficult to interpret the cause of certain changes when compared to pre-pandemic estimates. One area where this is evident is within the composition of private-sector employees by employer firm size.
Small firms declined significantly in 2020
Many employers offer ESI to their employees, regardless of the number of individuals they employ. However, while ESI remains the most common source of coverage for Americans, the composition of private sector employees enrolled in ESI shifted significantly from 2019 to 2020. Specifically, the number of employees in small firms (defined here as <50 employees) experienced a 19 percent decline over this timeframe, leaving a greater proportion of medium and large firms (defined here as >50 employees) to drive trends in ESI access to coverage and cost.
With larger firms comprising an increasingly significant portion of the private sector, trends among this subset of firms are driving overall changes between 2020 and 2019. For this reason, it is difficult to analyze changes in ESI estimates from 2020 to 2019, as these changes could be attributed to actual trends in access, cost, and affordability, or they could be directly tied to this shift in composition of employers and employees.
Number of private-sector employees in the United States, by firm size: 2019—2020
| Employees, all firms |
Less than 50 employees |
50 or more employees |
|
| 2019 | 131,333,000 | 35,113,000 | 96,220,000 |
| 2020 | 122,677,000 | 28,507,000 | 94,171,000 |
| 2019-2020 Change | -8,656,000 | -6,606,000 | -2,049,000 |
| 2019-2020 Percent Change | -7% | -19% | -2% |
Source: SHADAC analysis of the Medical Expenditure Panel Survey—Insurance Component, 2019, 2020.
ESI costs and premiums remain mostly stable
Monitoring costs associated with ESI is essential for understanding health care-related financial burdens for employees. Nationally, 2020 premiums and cost sharing remained relatively stable for employees enrolled in ESI. While premiums for single coverage increased slightly by 2.5 percent ($177), family premiums, employee contributions, and deductibles (for both single and family coverage) remained steady when compared to 2019.
When examined on a state-level, 2020 ESI costs are more varied. Nationally, the average premium for single coverage was $7,149. Certain states exceeded that average in 2020, with Alaska and New York monthly premiums surpassing $8,000 ($8,635 and $8,177 respectively). Meanwhile, Alabama had the lowest premium for single coverage at $6,393. There was also a great deal of variation across states in the size of deductibles. Nationally, the average deducible for single coverage was just under $2,000 in 2020. However, deductibles ranged from an average of $2,500 in Montana to less than $1,500 in Hawaii.
High-deductible health plans (HDHP) represent one common form of ESI. Nationwide, the percent of employees enrolled in a HDHP increased in 2020, rising from 50.5 to 52.9 percent. Moreover, the majority of private-sector employees were enrolled in a HDHP across 36 states in 2020. North Carolina had the highest percentage of HDHP-enrolled employees at 69.5 percent, and Hawaii was at the other end of the spectrum with only 17.6 percent of employees enrolled in HDHPs.
Access to coverage varies by state
Employee access to ESI has three components:
Employee Offer: An employee must work in an establishment that offers coverage.
Employee Eligibility: An employee must meet the criteria established by the employer to be eligible for coverage that is offered.
Employee Take-Up: The employee must decide to enroll in (“take up”) the offer of ESI coverage.
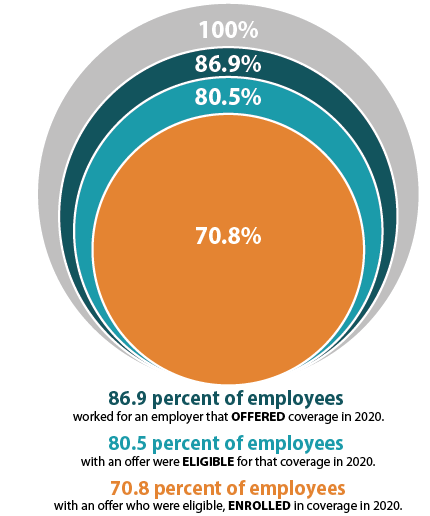
The decision to offer ESI to employees is determined by the employer, with 51.1 percent of private sector firms choosing to offer coverage in 2020 (compared to 47.4 percent in 2019). However, although over half of employers provided optional ESI, not all of their employees were eligible to enroll in that coverage. Meaning, while 86.9 percent of employees worked for an employer offering ESI coverage in 2020, only 80.5 percent were eligible for that coverage; eligibility could be based on a minimum number of hours worked per pay period or a minimum length of service with an employer, for example. Among employees eligible for ESI, overall enrollment declined in 2020, dropping from 71.9 percent to 70.8 percent—a difference of 1.745 million employees.
ESI access also varied across states in 2020. In Hawaii, Tennessee, Massachusetts, Illinois, Pennsylvania, New Jersey, and the District of Columbia (D.C.), more than 90 percent of employees worked at a firm that offered ESI. Meanwhile, less than 75 percent of Montana and Wyoming employees worked for an employer that offered ESI (73.8 percent and 70.6 percent, respectively).
It’s important to note that trends in access are particularly difficult to interpret due to the sharp decline in employees who work in firms with <50 employees, as small firms are much less likely to offer coverage.
To revisit 2019 ESI findings from SHADAC, see the following products:
- Printable version of 2019 ESI Report Narrative
- Companion Blog and Infographic highlighting key findings at the national level regarding ESI coverage affordability and access
- Two-Page Profiles on ESI trends for each state
- 50-State Interactive Map showing levels of, and changes in, average annual premiums for single and family coverage in 2019, with links to state profile pages
- 50-State Comparison Tables including 2015-2019 ESI data
Notes and Sources
Hawaii has a broad employer mandate that preceded the ACA. The Hawaii Prepaid Health Care Act, enacted in 1974, requires private employers to provide health insurance for employees who work at least 20 hours (some exceptions apply).
High-deductible health plans (HDHP) are defined as plans that meet the minimum deductible amount required for Health Savings Account (HSA) eligibility (e.g., $1,400 for an individual and $2,800 for a family in 2020).
The labor market changed significantly between 2019 and 2020 with a dramatic reduction in small firm employment. It is difficult to determine whether 2020 changes in ESI were driven by this change in the labor force or reflect actual changes in ESI access and cost.
Data are from the 2019–2020 Medical Expenditure Panel Survey–Insurance Component (MEPS-IC), produced by the Agency for Healthcare Research and Quality (AHRQ), and are available on SHADAC’s State Health Compare web tool at statehealthcompare.shadac.org.
1 State Health Access Data Assistance Center. (n.d.). Health Insurance Coverage Type (2020)* http://statehealthcompare.shadac.org/bar/279/health-insurance-coverage-type-2020-by-total#0/1/5,4,1,10,86,9,8,6/32/325

