
Basics Blog
SHADAC has created a series of “Basics Blogs” to familiarize readers with common terms, concepts, and topics that are frequently covered. See all Basics Blogs here.
As we enter 2026 and on the heels of the release of the final data-year 2024 ACS product, the 5-year data files released on January 29, 2026, SHADAC wanted to take a moment to honor a milestone from 2025: the 20th anniversary of the American Community Survey (ACS)!
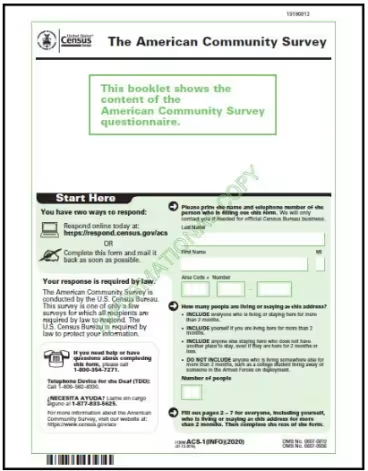
What is the American Community Survey? The ACS began as a long-form supplement to the decennial U.S. census short-form questionnaire, which you may know as simply, “the census.” In 2005, after nearly 15 years of planning and testing, the American Community Survey was launched nationwide as a standalone, full-length household survey with questionnaires mailed to 250,000 addresses. Today, the Census Bureau samples about 3.5 million households for the ACS each year.
So, what data does the ACS collect? The data collected through the ACS work to provide a detailed picture of the population of the U.S., including demographic, socioeconomic, and housing data. This information is used by researchers, local government officials, community leaders, and more to make important decisions that impact communities, such as infrastructure planning and government funding distribution. For health policy researchers, including those here at SHADAC, the ACS provides crucial insights into health insurance coverage and uninsurance rates across the nation, as well as in cities and states.
As the ACS celebrates its 20th anniversary, SHADAC honors this milestone in our latest blog by walking readers through a brief history of the ACS, including a basic explanation of how the ACS operates and how it’s used. We also highlight the unique and pivotal role of the ACS in surveying American communities for the past 20 years.
A Brief History of ACS Origins in the U.S. Census
As previously noted, the ACS originated as part of the decennial U.S. census.[i] The census is also the original source for multiple other Census Bureau surveys that are now standalone products, including both the ACS and the Current Population Survey (CPS).
Thus, in order to understand the ACS, we need to start with understanding the census and how the ACS was made in response to it.
The United States Census
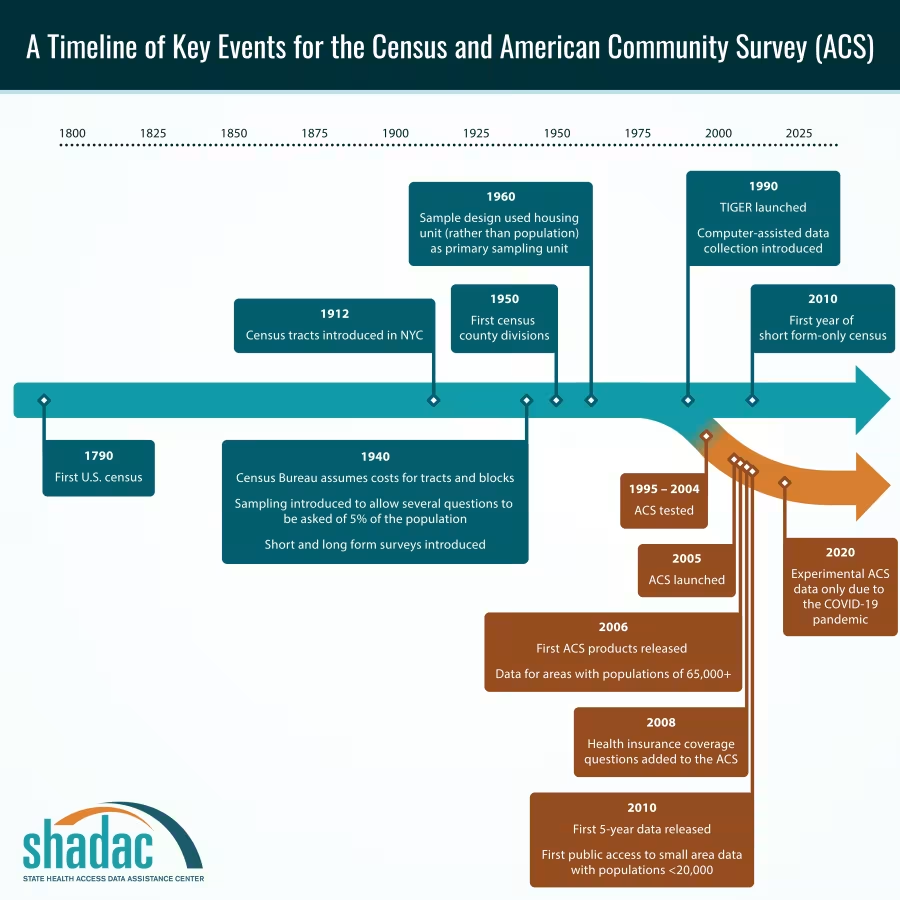
The first U.S. census was collected in 1790 and has been collected every decade since. The census was originally mandated to count populations to determine representation of and taxation for different regions throughout the country.[i] While it has continued to serve this function for centuries, the census has also become an important tool to inform policymaking at national and local levels.
However, almost since its inception, local government officials have asked for more granular data to be collected in the census, as well, in order to inform their work at the community level.[i] The 1790 census only included 6 questions provided to the 13 states existing at that time, all relating to population demographics.[ii]
In 1890, the first steps towards providing data at a local level were taken: The Census Bureau published small area data for certain cities for the first time, dividing areas into “wards” and introducing a new metric—death rate per 1,000 persons by ward.[i] The Bureau also published special reports for some major cities, which subdivided wards into “sanitary districts” and provided further granulation of data by reporting on cause of death by age, sex, and immigration status.[i]
Throughout the 1900s, community leaders continued the push for more localized data, which resulted in the creation of census tracts (i.e., geographic regions defined by the Census Bureau to provide consistent boundaries for the purposes of comparison and analysis) and the collection of more detailed housing information in the census.[i]
In 1940, the decennial census officially began fielding both a “short-form” survey, which most addresses received, and a “long-form” survey (also referred to as ‘supplemental questions’), which about 5% of the sample addresses received. The short-form survey covered only basic questions such as age, sex, and race. Those who received the long-form survey were asked to respond to both the short-form questions and about 50 additional questions, which would provide more detail about their socioeconomic status and housing information.[i]
Over time, more and more granular data were collected, especially as technological advancements like computers and geographic information systems (GIS) improved. Some key innovations include the launch of the Topologically Integrated Geographic Encoding and Referencing (TIGER) system in 1990, allowing for better storage and processing of geographic data, and the implementation of technology like computer-assisted interviewing for more efficient data collection.[iii]
Between the TIGER system and the spread of personal computers, granular geographic data started to become available in real time. By 1990, block group data (the smallest level of geographic data in both the census and ACS) was made available to the entire United States.[i]
The American Community Survey: Beginnings
Despite the gradual implementation of more granular data collection as part of the census over many decades, data users and politicians alike had also long recognized the need for more timely data that would be available more frequently than every 10 years that the decennial census could provide.[i]
Recognizing this need for intercensal data, politicians in the 1930s authorized the creation and dissemination of sample surveys instead of fielding a mid-decade census, which they felt was politically and financially infeasible. One of these surveys, conducted by the Works Progress Administration in 1940, was called the Sample Survey of the Unemployed. By 1942, the Census Bureau took over ownership of this survey, which, in 1947, would go on to become the CPS.[i]
In the 1990s, the desire for a cost-effective, consistent, and more frequent data collection tool again came to the forefront of federal surveying. The Census Bureau had been fielding complaints from local governments about the impact of data delays, as some programs were being created from 14-year-old data.[i] Additionally, there were concerns about undercounts (where some populations or groups are missed, or not counted, in the census). So, in 1990, discussions and planning to pilot a continuous data collection survey began.[i]
Between 1990 and 1995, dozens of proposals for a new census were reviewed and tested, ranging from proposals to have a “bare bones” decennial census, a more frequent, continuous measurement survey, or even using existing administrative data to answer questions. Proposals were weighed by cost, administrative and statistical feasibility, and the needs of local governments; finally, in 1995, the Census Bureau recommended conducting the long-form sample survey and continuous measurement in the year 2000 after a period of testing.[i]
The Census Bureau conducted the first field test of continuous measurement in 1996: The first iteration of what was newly coined the American Community Survey (ACS). After years of continued testing, the ACS 3-year pilot estimates were compared against the 2000 Census data[iv], its full potential as a standalone survey was finally understood, as the results of the ACS proved to be as strong as if not stronger than Census data.[i]
In 2005, the first official ACS questionnaires were sent to a chosen sample of 250,000 addresses. The ACS has continued to be fielded every year since, although not without continued testing, updates, and additions over time. For example, small area data users raised the issue of high sampling errors in one-year time frames. This concern is why it took until 2010 for the Bureau to be able to release ACS data for populations under 20,000 people.[i] It was also in 2010 that the Bureau fully eliminated the long-form component of the decennial census, as that role was now filled by the ACS.[v]
For more information about the early design ideas and goals of the ACS, see this PowerPoint presentation given by the Census Bureau in 2010.
For a more detailed timeline of the U.S. census against the context of U.S. history, see the Census Bureau’s census timeline here.
The American Community Survey Today: Data Collection and Applications
Now that we know some of the history that led to the creation of the American Community Survey, let’s dig into the following questions:
- How is ACS data collected?
- What kind of data is collected by the American Community Survey?
- How do researchers, community workers, and policymakers use this data?
How American Community Survey Data Is Collected
The United States Census Bureau conducts data collection for the ACS throughout the year, from January to December. Using mail, internet, and in-person surveying methods, the Census Bureau reaches about 3.5 million addresses in the 50 states, District of Columbia, and Puerto Rico* each year.[vi] This kind of continuous data collection is in part made possible by the TIGER system, allowing for storage and analysis of geographic data, as described in the history section above.[iii]
The ACS, like the decennial census, is mandatory.[vii]
Due to the COVID-19 pandemic, in-person and mailing activities for the ACS were halted in March 2020; mailing was resumed in a limited capacity in July 2020, in-person activities resumed fully in September 2020, and mailing resumed fully in April 2021. Because of these disruptions, ACS data from 2020 is considered “experimental”; the Census Bureau cautions against comparing the ACS single-year estimates for 2020 to any other data year.[viii]
What Data Does the ACS Collect?
In 2025, the ACS included 44 questions per person in a household. The ACS covers over 40 topics, some of which include:[v]
- Health insurance coverage
- Jobs and occupations
- Educational attainment
- Information on veterans
- Whether people own or rent their home
- Employment status
- Disability information
- Housing costs
- Demographic data collection (e.g., age, race, sex, etc.)
There is also a process for adding or changing questions on the American Community Survey. This process includes proposals, testing, evaluation, and decision-making. A federal agency can propose a new or revised question at any time, and all proposals must undergo legal, technical, and policy review.[ix]
For example, in 2008, questions on health insurance coverage were added to the ACS. Another example is the implementation of SPD 15, which requires adding a Middle Eastern or North African (MENA) response category to race/ethnicity questions. After soliciting comments from the public, the Census Bureau weighed responses, and made the decision that full implementation in the ACS would occur by 2027 data collection.[x]
Let’s look at a couple of examples of questions on the ACS to give a better idea of their format and how this information might be used by researchers and policymakers.
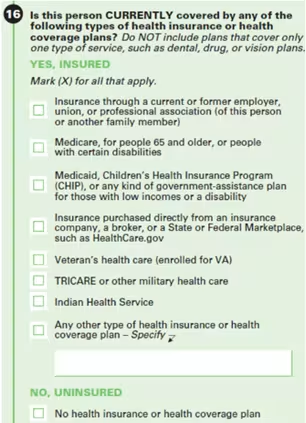
First, here is an example of an ACS question regarding health insurance coverage. Question 16 asks:
“Is this person CURRENTLY covered by any of the following types of health insurance or health coverage plans?”
The respondent is offered detailed options for coverage, such as insurance through an employer, Medicare, Medicaid, Marketplace, and TRICARE, amongst others (see image to the right).
Data from a question like this allows researchers, policymakers, and local officials to understand what type(s) of insurance is most relied on by different communities, states, and populations.
Below is another example of a question on the ACS. Question 25 asks:
“In the PAST 12 MONTHS, has this person given birth to any children?”
This question can help estimate the overall number of births per year in the U.S. as well as the percentage of people who gave birth in the last 12 months who are in the labor force to help in understanding U.S. families and their needs.
For more information about the purpose of each question asked on the ACS, visit the Census Bureau website.
How Data from the ACS Is Used
The data collected from the ACS can be used to look at national estimates, state estimates, and sub-state estimates. Historically, the ACS has released single-year estimates for each data year during the second week in September, and releases combined 5-year estimates, usually in December or January. Five-year estimates have been combined annually since December 2009.[vii]
While all estimates from the ACS support geographic analysis at the national and state levels, the ability for sub-state level analysis differs between the 1-year estimates, which only support geographies with populations above 65,000, and the 5-year estimates, which are more robust and allow for geographic breakdowns by counties and ZIP code tabulation areas (ZCTA).[vii]
The ACS is used by local government officials, community leaders and members, and policymakers to evaluate and inform policy decision making, including local funding, programming, and priority-setting. This data is also used by researchers in a variety of fields to answer questions about health policy, public health, health outcomes and behaviors, and more. With its more formal uses in mind, ACS data can be used by anyone with access to the internet, as the Census Bureau publishes much of the data online to be made searchable by the public.[v]
SHADAC relies on the ACS for many of its research projects. In one health insurance coverage analysis, SHADAC used 2023 ACS data to explore Medicaid coverage rates for those who report having a disability. Using this data, our researchers found that “while 34% of all individuals with Medicaid coverage report having a disability, only 10% qualified for Medicaid based on a disability determination.”[xi] These findings highlight a gap between Medicaid enrollees who self-report a disability and the ability to qualify for coverage based on that disability, revealing discrepancies in the lived experience of disability compared to Medicaid’s definition of disability.[x]
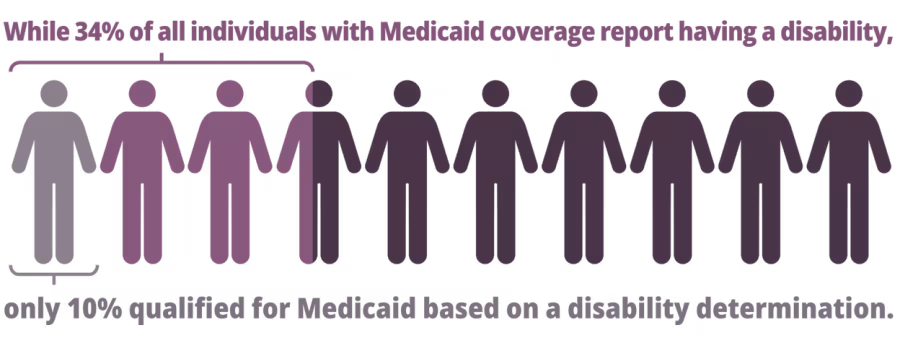
With recent policy changes to Medicaid, like the upcoming implementation of work requirements, the ability to access and analyze reliable health insurance coverage data like the data from the ACS will be pivotal for understanding the impact of these changes.
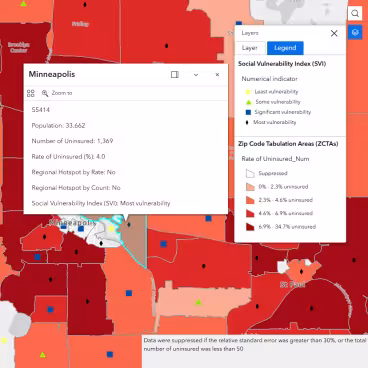
Another example of how SHADAC uses ACS data is with our interactive tool: The Minnesota Community and Uninsured Profile, a project funded by the Blue Cross and Blue Shield of Minnesota Foundation. Updated annually with the latest available ACS data, this tool provides rates and counts of uninsured Minnesotans at various geographic levels, also providing users with demographic information (e.g., sex, race, etc.).
We have also incorporated measures like “Social Vulnerability Index” into the tool, which provides a measure for how vulnerable communities are to stressors, with categories of least, some, significant, or most vulnerability. Along with the tool in the form of a downloadable Excel spreadsheet, we also made this information visual and accessible through an interactive map.[xii]
Both the Excel tool and the interactive map are used by health insurance navigators, Minnesota policymakers, and other advocates to better understand Minnesotans who are experiencing uninsurance. For example, let’s say SHADAC wanted to learn more about the uninsured population in the ZIP code of SHADAC’s office, 55414. Searching for this ZIP code on the interactive map shows that there are an estimated 1,369 people in ZIP 55414 who are uninsured, and the ZIP has a Social Vulnerability Index (SVI) of “Most Vulnerability”—the highest SVI rank.[xi]
You can explore the latest version of the tool and the interactive map on SHADAC’s website here.
The Census Bureau also collects stories directly from data users on how the ACS can be and has been used to evaluate policy, answer research questions, set community priorities, and more. Find those stories on the Census Bureau website.
Conclusion
The ACS has undergone many changes from its beginnings as part of the decennial census to the standalone survey it is today. Many factors played a role in the development of the ACS, including the need for continuous, detailed, and more granular data available with greater frequency than the census alone could provide. The rise of more sophisticated computing technologies, like GIS and TIGER, allowed the ACS to fill these needs while also ushering in an era of transparency.[i]
By the early 2000s, advancements in computing and the Internet allowed the Census Bureau to make data from the census, the ACS, and other Bureau surveys available and searchable online, making it usable by various agencies and the public. Not only did technological advancements allow for the development of the ACS as a standalone survey providing continuous, detailed, and granular data on key topics, but these advancements also made this data more accessible.[iii] Being able to provide these data to U.S. residents as a public good is one of the most impactful and lasting changes to the census and ACS.
As the ACS enters its next year in 2026, it continues to be used by researchers, policymakers, and community leaders to impact and serve communities across the nation.
Stay up-to-date with SHADAC’s latest ACS analyses, blogs, and publications by signing up for our monthly newsletter or following us on LinkedIn.
Notes
*Puerto Rico receives a customized version of the ACS, called the Puerto Rico Community Survey.
References
[i] United States Census Bureau. (2024, January). History of the American Community Survey. U.S. Department of Commerce. https://www2.census.gov/library/publications/2024/acs/history-of-the-acs.pdf
[ii] United States Census Bureau. (2021, November 23). Decennial Census of Population and Housing Questionnaires & Instructions: 1790 Census. U.S Department of Commerce. https://www.census.gov/programs-surveys/decennial-census/technical-documentation/questionnaires.1790_Census.html
[iii] United States Census Bureau. (2024, May). Census Bureau Innovations. U.S. Department of Commerce.https://www.census.gov/about/history/bureau-history/census-innovations.html
[iv] United States Census Bureau. (2023, October 2). About the 2000 Decennial Census. U.S. Department of Commerce. https://www.census.gov/programs-surveys/decennial-census/decade/2000/about-2000.html
[v] Population Reference Bureau. (2009, April). How the 2010 Census Is Different. https://www.prb.org/resources/how-the-2010-census-is-different/
[vi] United States Census Bureau. (2025, December). American Community Survey (ACS). U.S. Department of Commerce. https://www.census.gov/programs-surveys/acs
[vii] United States Census Bureau. (2025, April 17). Top Questions About the Survey. U.S. Department of Commerce. https://www.census.gov/programs-surveys/acs/about/top-questions-about-the-survey.html#accordion-85c987d3be-item-6d0b669813
[viii] Hest, R., Stewart, A., Walsh, E. (2024, October 2). Survey Data Season Essentials: ACS vs. CPS: What is the Difference Between These Two Federal Surveys? State Health Access Data Assistance Center. https://www.shadac.org/news/acs-vs-cps-what-difference-between-american-community-survey-current-population-survey
[ix] United States Census Bureau. (2025, April 23). Explore How a Question becomes Part of the American Community Survey. Department of Commerce. https://www.youtube.com/watch?v=5f5ZXbd99BM&t=522s
[x] United States Census Bureau. (2025, November 13). Implementation of SPD 15 in the American Community Survey. Department of Commerce. https://www.census.gov/newsroom/blogs/random-samplings/2024/11/implementation-spd-15-acs.html
[xi] Zylla, E. & Lukanen, E. (2025, June 20). The Disability Gap in Medicaid: Implications for the Federal Work Requirement Proposal. State Health and Value Strategies, Princeton University. https://shvs.org/the-disability-gap-in-medicaid-implications-for-the-federal-work-requirement-proposal/
[xii] State Health Access Data Assistance Center. (n.d.). Resource: Minnesota’s Community and Uninsured Profile. https://www.shadac.org/resource-minnesotas-community-and-uninsured-profile