In 2024, SHADAC reported on the rise of uninsured rates among children (age 0-18), which increased from 2022 to 2023. This increase followed two prior years of declining uninsured rates, marking a concerning shift. Digging deeper, SHADAC researchers found that low-income children, defined as those living below 200% of the Census poverty threshold, experienced higher rates of uninsurance compared to their peers.
Just as in 2023, new 2024 American Community Survey (ACS) health insurance coverage data released in September 2025 shows a concerning rise in children’s uninsured rates. And, once again, this change is particularly apparent for low-income children.
In an effort to better understand what might be driving this now two-year trend in children’s health insurance coverage changes, this blog post will summarize and compare our findings from 2023 ACS data along with our latest findings from 2024 ACS data.
A Brief Review of SHADAC’s 2023 ACS Data Analysis
As we mentioned above, findings from SHADAC analysis of 2023 ACS saw uninsured rates for all U.S. children rise 0.3 percentage points (PP) to 5.4% from 5.1% in 2022. Seeking to better understand this unexpected rise after two years of declining uninsurance for kids, SHADAC researchers examined insurance coverage rates for children across a number of subcategories, such state Medicaid expansion status and income level.
In doing so, we found a concerning result: a 0.4PP jump in uninsurance from 6.9% in 2022 to 7.3% in 2023 among low-income children. This meant that the uninsured rate among low-income children was 1.9PP higher than the rate of uninsured children overall.
As we detail in the full blog on children’s coverage estimates from the 2023 ACS:
“This significant increase [in uninsurance among low-income children] was likely driven by a 0.6PP decrease in public coverage (bringing that national rate down to 72.6%) and a statistically unchanged rate of private coverage (27.0% in 2023).”
In brief, this recorded loss of public coverage without a corresponding increase in private is the most likely factor driving the rise in uninsurance for all children and low-income children.
At a state-level, uninsurance among all children increased in five states and decreased in three. Uninsurance among low-income children specifically increased in four states with no states experiencing decreases.
Interestingly, and unlike the national-level results, none of the states that saw increased uninsurance for low-income children also saw any significant changes in private coverage, and only one state (Texas) saw declines in both uninsured rates and in public coverage for low-income children.
2024 ACS Health Insurance Coverage Estimates Show Continued Increase in Uninsurance for All and Low-Income Children
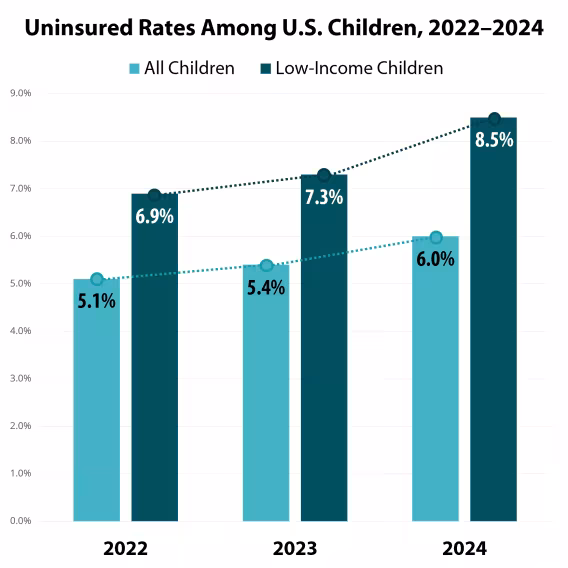
Analysis of 2024 ACS data finds the rate of all uninsured children in the U.S. rising by 0.6PP, up to 6.0% from 5.4% in the prior data year. Using data from the ACS HI-11 table, SHADAC estimates that the rate of uninsured low-income children rose by 1.2PP (twice that of all children), up to 8.5% from 7.3% in 2023.
Put another way:
- Of all children in the U.S., 6.0% do not have health insurance coverage, and
- Of all low-income children in the U.S., 8.5% do not have health insurance coverage.
Though private insurance coverage rates increased by 0.7PP among all children (from 60.6% in 2023 to 61.3% in 2024), rates among low-income children remained statistically unchanged (from 27.0% in 2023 to 26.9% in 2024). These data show a clear disparity in rates of private insurance coverage for low-income children compared to all children.
Rates of public coverage, on the other hand, decreased significantly for both groups, falling by 1.5PP (39.4% in 2023 to 37.9% in 2024) for all children and by a nearly identical rate of 1.4 PP for low-income children (72.6% in 2023 to 71.2% in 2024).
This decrease in public coverage without a corresponding rise in private coverage could once again help to explain the increase in uninsured rates among children, particularly for low-income children.
It is important to note that while there was a 0.7PP increase in private coverage amongst all children, this increase did not match the 1.5PP decrease in public coverage meaning that while some that lost public coverage likely enrolled in private coverage, others were left uninsured.
State-Level 2024 ACS Data Show Significant Correlation Between Increased Uninsurance and Decreased Public Coverage
State-level data can help provide perspective on and reveal state-specific differences from national findings and trends.
Among all children in the U.S., only two states saw a significant decrease in uninsured rates: New Hampshire (1.1PP decrease to 3.4%) and Connecticut (0.8PP decrease to 2.6%). While New Hampshire saw an increase in private insurance coverage, neither state saw a significant change in public insurance coverage.
Nineteen states saw a significant increase in uninsurance for all children, with North Dakota seeing the largest increase, up 3.1PP from 2023 (3.6%) to 2024 (6.7%).
Among only low-income children in the U.S., Connecticut was the one state to see a statistically significant decrease in uninsured rates, with a 2.4 PP decrease from 5.1% in 2023 to 2.7% in 2024. Meanwhile, 14 states saw a statistically significant increase in uninsured rates, with North Dakota again seeing the largest increase in the rate of uninsured low-income children with a 6.6 PP change from 6.1% in 2023 to 12.7% in 2024.
Unlike our analysis of changes in coverage for low-income children between 2022 and 2023, data comparisons for 2023 to 2024 showed high correlation between states that experienced both significant increases in uninsured rates for low-income children and significant decreases in public coverage rates for low-income children. Of the 14 states that saw rises in uninsured rates for low-income children between these two years, nine also saw significant decreases in public coverage rates.
Only one state (Oregon) experienced any significant increase in public coverage rates for low-income children between 2023 and 2024.
Table 1. States with Significant Increase in Uninsured Rates 2023 to 2024 for Low-Income Children with Corresponding Change to Public Coverage
State | Change to Uninsurance (PP) | Change to Public Coverage (PP) |
|---|---|---|
Arizona | 3.0* | -0.8 |
Colorado | 4.5* | -4.3* |
District of Columbia | 4.6* | -7.9 |
Florida | 1.7* | -4.3* |
Georgia | 3.4* | -6.3* |
Idaho | 5.0* | -7.4* |
Kansas | 3.3* | -6.0* |
Kentucky | 2.8* | -4.6* |
Missouri | 3.1* | -1.6 |
New Jersey | 1.7* | -2.9* |
North Dakota | 6.6* | -6.1 |
Tennessee | 2.2* | -3.9* |
Texas | 3.0* | -4.0* |
Virginia | 2.4* | -2.9 |
* Indicates that the percentage point change between 2023 and 2024 is statistically at the 90% confidence level.
Discussion and Further Considerations
For the second year in a row, the national rate of uninsured children in the U.S. has risen and, as our analysis has shown, low-income children are being disproportionately affected by this increase. One potential driver behind this increase seems to be the decline in children who are enrolled in public coverage, particularly in Medicaid coverage, which also includes the Children’s Health Insurance Program, or “CHIP.”
As our own analysis, as well as that from the Georgetown Center for Children and Families, has shown, uninsured rates and public coverage rates over the past two years have experienced respective, and often correlating, increases and decreases at both the national and state level. Other traditional sources of coverage for children, such as private coverage through a parent or guardian’s employer-sponsored insurance, or “ESI,” have remained unchanged between 2023 and 2024, meaning that those children who are no longer enrolled in Medicaid may not be transitioning to other sources of health insurance coverage and therefore may become uninsured.
Another factor that is likely impacting this rise is the Medicaid unwinding. After the end of the continuous coverage requirement put in place during the COVID-19 public health emergency, redeterminations are now taking effect. While some public coverage loss has been expected, as 2024 represents the final year of the Medicaid unwinding process, it is worrying that rates of private coverage, which could potentially bridge the coverage loss gap, have not risen for low-income children as they have for all children.
These declines in insurance coverage among children are particularly worrisome when considered against the concept of insurance churn, where repeated health insurance coverage status changes occur. Insurance churn can be especially dangerous for children compared to adults, as they often require much more frequent preventive medical care. In fact, studies have shown that childhood Medicaid expansions increase health care utilization among children and also improve long-term health outcomes.
As this is now the second year in a row that uninsured rates have risen for all children, and once again rising even more significantly among low-income children, states may want to consider potential solutions to address coverage losses that occurred as a result of the unwinding, especially for low-income children and related groups. Areas to target could include efforts to improve access to and enrollment in alternative forms of private insurance if ESI is unavailable, such as direct purchase and Marketplace coverage.
A Look at Rhode Island
Let’s look to Rhode Island, the only state that saw a decrease in uninsured rates among all children in 2024, for an example of how states can use Marketplace coverage as a way to combat uninsured rates among all children.
In anticipation of the Medicaid unwinding, Rhode Island invested in awareness campaigns, mainly through the use of billboards, encouraging Medicaid enrollees to check their coverage status. Additionally, managed care organizations in the state conducted mass outreach through mailings, phone calls, emails, text messages, and events.
Thanks to these and other efforts, 1 in 4 Rhode Island enrollees who were terminated from Medicaid during the unwinding process were able to continue coverage through Rhode Island’s marketplace insurance option, which could have helped to mitigate rises in uninsurance. Additionally, half of those eligible for advance premium tax credits enrolled during this process, an essential support for maintaining health care affordability, especially for those losing affordable public health coverage. Rhode Island now has 43,000 Medicaid enrollments, a record high for the state.
Learning from Rhode Island’s work and from recent patterns in uninsurance, private, and public insurance coverage rates can help states as they move through policy, environmental, and coverage changes.
Sign up for our monthly newsletter for our most up-to-date resources and efforts informing on state and federal health policy, public health, and more.