
This post is a part of our Survey Data Season series where we examine data from various surveys that are released annually from the summer through early fall. Find all of the Survey Data Season series posts on our Survey Data Season 2025 page here.
The U.S. Census Bureau released 2024 health insurance coverage estimates from the American Community Survey (ACS) on Thursday, September 11, 2025. These estimates include both national- and state-level information about health insurance coverage by type, as well by certain demographic categories.
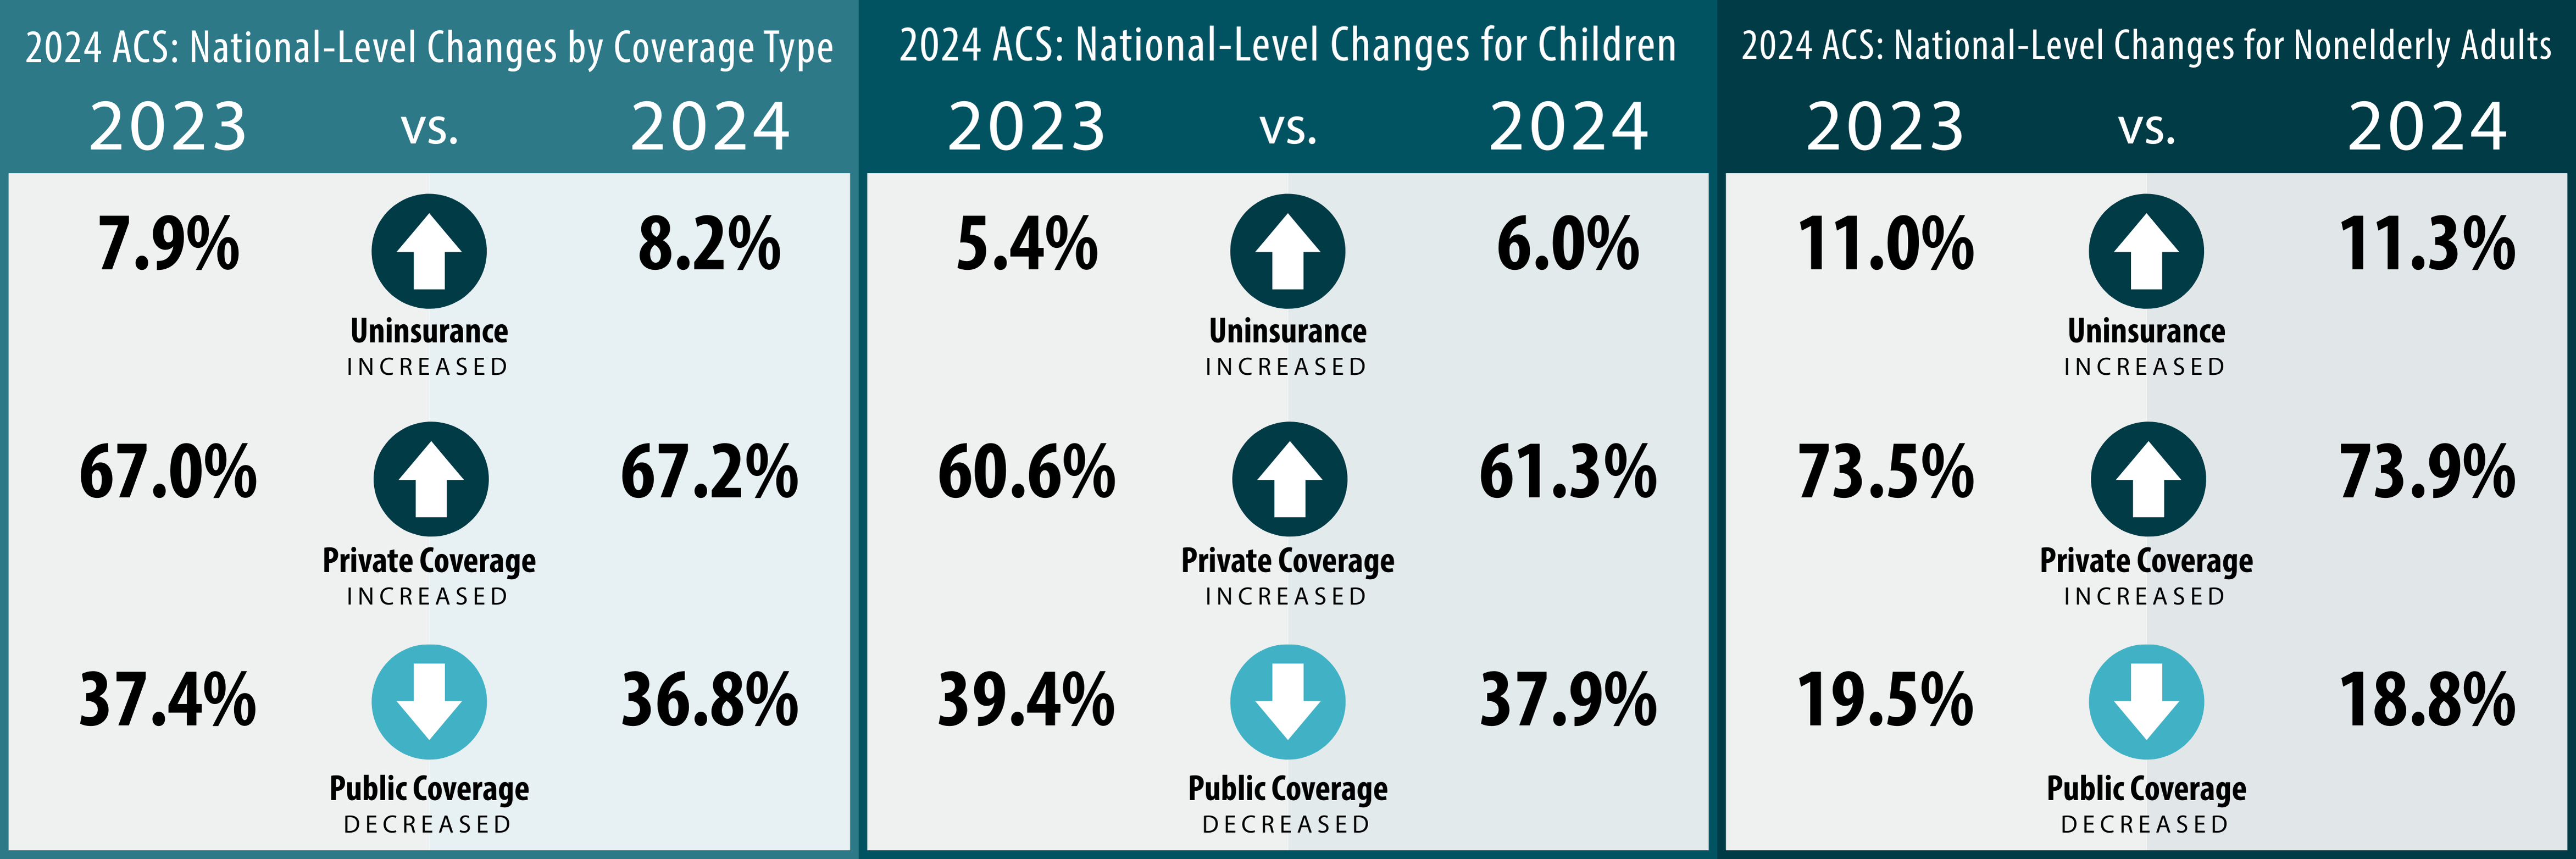
Findings from the ACS show a complex and highly dynamic picture of the health insurance coverage landscape in 2024. Like the Current Population Survey (CPS)—data from which was released on Tuesday, September 9—the ACS shows increases in private insurance coverage at the national level for the total U.S. population, with decreases in public coverage rates across the same population.
However, unlike the CPS, the ACS data shows a significant increase in uninsured rates across the U.S., rising from 7.9% in 2023 to 8.2% in 2024.
This increase in the percent of the population without health insurance coverage was echoed both across the states and by age group, with children and nonelderly adults seeing increases in uninsured rates from 2023 to 2024.
This blog will walk through these findings in more detail, including examining rates of each coverage type (uninsurance, private coverage, and public coverage) by state and age group.
Key Findings from the 2024 ACS by Health Insurance Coverage Types
No Health Insurance Coverage (Uninsurance)
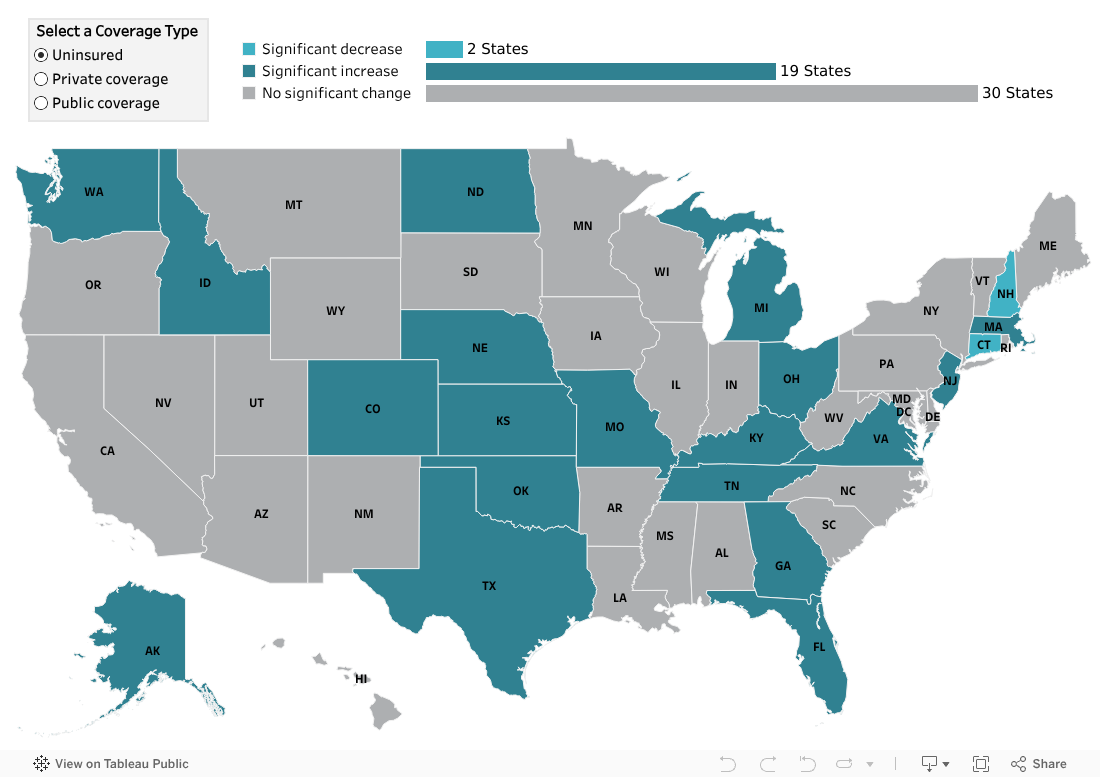
The national increase in uninsured rates from 2023 to 2024 was echoed across a number of states. Of the 22 states and localities (including Washington D.C.) that experienced significant changes in uninsured rates between the two years, 20 saw increases while California and North Carolina were the only states to see decreases.
Uninsured rates increased the most in Washington, D.C., rising by 1.8 percentage points (PP) from 2.7% in 2023 to 4.5% in 2024. Of the two states whose uninsured rates declined, North Carolina saw the larger decrease, dropping by 0.6 PP from 9.4% in 2023 to 8.6% in 2024 (compared to California’s decrease of 0.5 PP from 6.4% to 5.9%).
As has been the case for a number of years, Texas and Massachusetts continued their trend as the states with the highest and lowest rates of uninsurance at 16.7% and 2.8%, respectively, with Texas being among the states whose rate of uninsured persons increased significantly by 0.3 PP from 2023 (16.4%) to 2024.
Private Coverage
2024 ACS data show that the national rate of private coverage increased, rising to 67.2% from 67.0% in 2023.
Change occurred at the state level, as well, with seven states and localities seeing increases in private coverage and four—D.C., Minnesota, New Mexico, and New York—seeing decreases. Florida and Maine saw the largest increases in private coverage, both rising by 1.2 PP from their respective 2023 rates (64.2% and 67.5%) to 2024 (65.4% and 68.7%).
Interestingly, the increase in private insurance coverage did not come from any change to employer-sponsored insurance (ESI), which is another similarity to findings from the CPS. 2024 ACS data show rates of ESI were statistically unchanged between the two years (54.7% in 2023 and 54.6% in 2024). Rates of direct coverage, however, rose significantly by 0.2 PP from 13.9% in 2023 to 14.2% in 2024.
Public Coverage
Nationally, the rate of public insurance coverage fell significantly from 2023 to 2024, decreasing from 37.4% in 2023 to 36.8% in 2024. Over half of states and localities (26) also saw decreases in their rates of public coverage, led by Idaho and Wyoming whose rates of public coverage declined by 2.0 PP from 2023 (35.7% and 33.2%, respectively) to 2024 (33.7% and 31.2%, respectively).
This decrease was driven in large part by decreases in Medicaid coverage, which fell 0.8 PP nationally, from 21.3% in 2023 to 20.5% in 2024. Thirty states also saw declining Medicaid coverage rates from 2023 to 2024, while just two—California and North Carolina—saw their Medicaid coverage rates rise.
Montana saw the largest decrease between the two years, falling by 2.7 PP from 21.0% in 2023 to 18.3% in 2024. Of the two states whose Medicaid coverage rates increased, North Carolina saw the larger growth, climbing by 1.0 PP from 19.1% in 2023 to 20.1% in 2024 (compared to California’s increase of 0.7 PP from 27.2% to 27.9%).
Key State-Level Findings from the 2024 ACS by Age: Children (0-18)
No Health Insurance Coverage (Uninsurance)
For the second year in a row, the national rate of uninsurance among children (age 0-18) increased significantly. In 2023, the uninsured rate for children was 5.4% (an increase from 5.1% in 2022). This figure rose significantly by 0.6 PP to 6.0% in 2024, according to the ACS data.
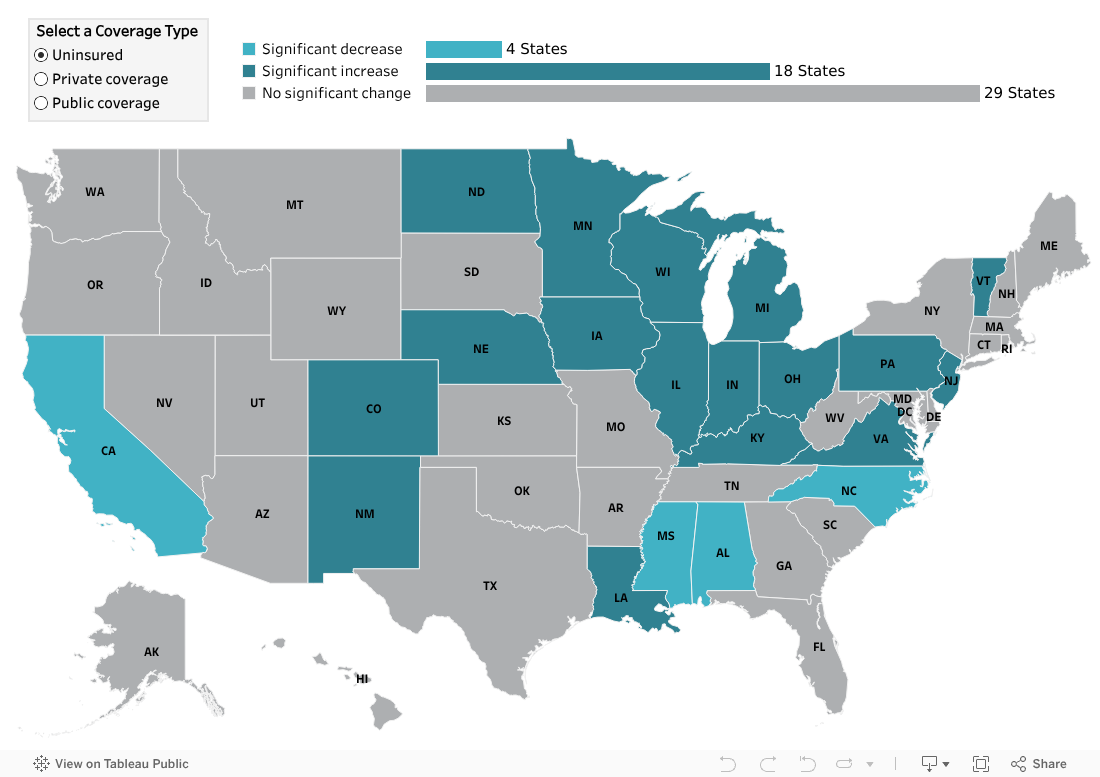
Children’s uninsured rates rose significantly in 19 states and declined in only 2—Connecticut and New Hampshire. The largest increase in uninsured rates for children occurred in North Dakota: The state’s uninsured rate for children notably rose by 3.1 PP from 3.6% in 2023 to 6.7% in 2024.
New Hampshire saw the largest decrease in uninsured rates for children falling significantly by 1.1 PP from 3.4% in 2023 to 2.3% in 2024. Connecticut’s rate of uninsured children fell by 0.8 PP from 3.4% in 2023 to 2.6% in 2024.
Private Coverage
The rate of private coverage among children in 2024 increased, climbing by 0.7 PP from 60.6% in 2023 to 61.3% last year. Twelve states also experienced significant rises in rates of private insurance coverage among children, with Wyoming recording the largest increase of 4.8 PP from 2023 (65.2%) to 2024 (70.0%).
Only three states and localities saw decreases among private coverage rates for children— Washington, D.C., Hawaii, and Rhode Island. Washington, D.C., experienced the largest decrease between the two years, falling sharply by 11.9 PP from 66.1% in 2023 to 54.2% in 2024.
Public Coverage
The rate of public coverage among children in 2024 fell significantly by 1.5 PP at the national level, dropping from 39.4% in 2023 to 37.9% in 2024. Among the 20 states that also saw significant declines in public insurance coverage for children, Wyoming experienced the largest decline, falling by 9.2 PP from 33.6% in 2023 to 24.4% in 2024.
Just one state, Rhode Island, saw a significant increase in children’s public coverage rates from 2023 (36.8%) to 2024 (41.4%), a difference of 4.6 percentage points.
Key State-Level Findings from the 2024 ACS by Age: Nonelderly Adults (19-64)
No Health Insurance Coverage (Uninsurance)
Uninsured rates rose among nonelderly adults (age 19–64) in 2024, growing by 0.3 PP from 11.0% in 2023 to 11.3% in 2024. Eighteen states and localities also saw rising uninsured rates among nonelderly adults, with Washington, D.C. seeing the largest increase of 2.2 PP between its measured rate for 2023 (3.5%) and 2024 (5.7%).
Alabama, California, Mississippi, and North Carolina all experienced declines in uninsured rates for nonelderly adults from 2023 to 2024. North Carolina saw the largest decrease across the four states, declining by 1.2 PP from 13.3% in 2023 to 12.1% in 2024.
Private Coverage
From 2023 to 2024 rates of private coverage among nonelderly adults increased significantly by 0.4 PP at the national level, rising from 73.5% in 2023 to 73.9% in 2024.
Sixteen states also saw an increase in rates of private insurance coverage for nonelderly adults between 2023 and 2024, with Minnesota, New Mexico, and New York seeing a decrease between these two years. Private coverage increased most significantly among nonelderly adults in Maine, rising by 2.4 PP between 2023 and 2024, measuring at 73.8% to 76.2%, respectively.
Just three states—Minnesota, New Mexico, and New York—experienced significant decreases in private insurance coverage among nonelderly adults between 2023 to 2024. The largest drop in private coverage occurred in New Mexico, where nonelderly adults experienced a 1.7 PP decline in private coverage rates from 2023 (59.8%) to 2024 (58.1%).
Public Coverage
Across the U.S., public coverage rates fell significantly (by 0.7 PP) among nonelderly adults between 2023 (19.5%) and 2024 (18.8%).
Thirty states also experienced significant decreases in public coverage for nonelderly adults, ranging from a high of a 3.4 PP decline in Vermont (23.1% in 2023 to 19.7% in 2024) to a low of a 0.5 PP decline in Texas (11.3% in 2023 to 10.8% in 2024).
California and North Carolina were once again the two states to see significant oppositional changes from other state trends. Rates of public coverage among nonelderly adults in North Carolina increased by 1.9 PP from 16.4% in 2023 to 18.3%, and rates of public coverage among nonelderly adults in California increased by 0.9 PP from 24.8% in 2023 to 25.7% in 2024.
Future Data Releases and Products
Supplemental tables for the 2024 ACS 1-Year Estimates will be released from the U.S. Census Bureau on October 16, 2025, and 2020–2024 ACS 5-Year Estimates will be available on December 11, 2025.*
Stay tuned for more granular details about insurance coverage changes in the states from 2023 to 2024 via customized SHADAC tables examining coverage at the state and county level, and for an announcement of updated health insurance coverage measures available on State Health Compare.
To stay up to date on our latest releases and resources, sign up for our monthly newsletter.
Concluding the Continuous Coverage Requirement and the Medicaid Unwinding
The continuous coverage requirement that prevented states from terminating individuals’ Medicaid coverage during the COVID-19 pandemic ended on March 31, 2023. Each state was given a 14-month period—beginning on April 1, 2023 and ending on June 30, 2024—to resume normal Medicaid eligibility redeterminations and renewals (and potential disenrollments). This process has been commonly referred to as “the Medicaid unwinding” or even more simply as “the unwinding.”
Due to this mid-year shift in Medicaid processes and the fact that different states implemented the unwinding at different speeds, it is important to note that full-year 2024 estimates from all surveys, including the CPS and ACS, will not be fully reflective of the coverage shifts and changes that researchers have documented during the unwinding process. However, provisional data from sources like the Census Bureau’s Household Pulse Survey (HPS)—now rebranded to the Household Trends and Outlook Survey, (HTOPS)—can give a more responsive indicator of coverage trends during the unwinding If you are interested in learning more about the nuances of change that occurred during this period, SHADAC researchers compiled a concise and informative historical data resource that can be found here:
Notes
All changes described in this document are significant at the 90% level. Private coverage includes individually purchased, employer-sponsored coverage, and TRICARE military health coverage. Public coverage includes Medicare, Medicaid/CHIP, and VA health care. Public and private coverage types are not exclusive and include individuals with those types of coverage alone or in combination with other coverage. Estimates represent the civilian noninstitutionalized population.
Overarching estimates of uninsurance and public and private coverage are for all ages, except where noted for children (age 0–18) and nonelderly adults (19–64).
2024 ACS data come from the U.S. Census Bureau's data.census.gov site, and more specifically from Table S2701.
*Updated note: Due to the federal government shutdown the 2024 1-year ACS public use microdata (PUMS) file has been delayed from its expected release date of October 16, 2025. SHADAC is monitoring this and other survey release dates through our Federal Survey Data Release Schedule page, as well as a newer project that, among other activities, is tracking the status of data releases for all major federal health and health-related surveys in 2025.
Related Materials
Recent Data Release: Current Population Survey, Blog and Infographic
Current Population Survey (CPS) data were released on September 9, 2025. SHADAC analysis of 2024 health insurance coverage estimates from CPS data show the national uninsured rate holding steady at 8.0% with some notable changes across private & public coverage at the national level and for certain groups.
Notable national-level findings include:
- Medicaid coverage dropped to 17.6% in 2024
- Children’s public coverage rates decreased by 1.9 percentage points
- In nonexpansion states, rates of private coverage increased significantly by 1.2 percentage points
Find more details, including further breakdowns by demographic characteristics and key considerations & context, in the full blog and infographic.
Upcoming Webinar: 2024 Health Insurance Coverage: Exploring the Latest Data from the ACS and CPS
On Thursday, September 25th at 1:00 PM CST, SHADAC will host a webinar covering the release of new Census data on health insurance coverage estimates for 2024. The estimates come from two key federal surveys conducted by the U.S. Census Bureau: The American Community Survey (ACS) and the Current Population Survey (CPS).
SHADAC researchers and presenters will discuss larger health insurance data trends for 2024 at national and state levels, and will also cover more granular data by different insurance coverage types and demographic categories, such as age, geography, poverty level, and more.
In addition, SHADAC will walk through how to access the data and examples of how to use it to answer research questions. We are also pleased to once again welcome a special guest—U.S. Census Bureau Assistant Division Chief Sharon Stern—who will join us to answer questions from attendees after the main discussion.