
Blog & News


2019 ACS: Rising National Uninsured Rate Echoed Across 19 States; Virginia Only State to See Decrease (Infographics)
September 15, 2020:New 2019 health insurance coverage estimates from the U.S. Census Bureau’s American Community Survey (ACS) were released this morning, and findings from the survey show the national rate of uninsured increased from 8.9% in 2018 to 9.2% in 2019.
This 0.3 percentage-point increase represents approximately 1.07 million more individuals without health insurance in 2019, almost double the increase from 2017-2018 (535,000 individuals). Additionally, this is the third consecutive year of increases in the rate of uninsured after 0.1 percentage-point increases seen in both 2017 and 2018.
State-Level Uninsured Rate Changes from 2018 to 2019
Along with the nationwide growth in uninsurance, 19 states also experienced significant increases in their rates of uninsured. Wyoming saw the largest increase, with its uninsured rate growing from 10.5% in 2018 to 12.3% in 2019, or 1.8 percentage points. This is double the next-largest increase of 0.9 percentage points seen by both Louisiana and Arkansas.
Massachusetts and Pennsylvania saw the smallest increases in uninsurance (0.2 percentage points), with rates rising from 2.8% to 3.0% and 5.5% to 5.8%, respectively.
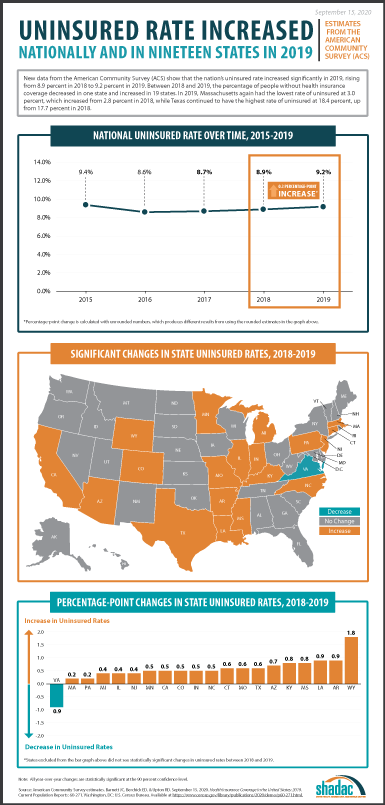
Virginia was the only state to experience a decrease in its uninsured rate, which fell from 8.8% to 7.9% in 2019—a drop of 0.9 percentage points. Virginia implemented Medicaid expansion on January 1, 2019.
States with significant changes in uninsured rates, 2018-2019
| State | 2018 Percent Uninsured | 2019 Percent Uninsured |
Percentage-Point Change, 2018-2019* |
| Wyoming | 10.5 | 12.3 | 1.8 |
| Louisiana | 8.8 | 7.9 | 0.9 |
| Arkansas | 8.2 | 9.1 | 0.9 |
| Kentucky | 5.6 | 6.4 | 0.8 |
| Mississippi | 12.1 | 13.0 | 0.8 |
| Arizona | 10.6 | 11.3 | 0.7 |
| Connecticut | 5.3 | 5.9 | 0.6 |
| Missouri | 9.4 | 10.0 | 0.6 |
| Texas | 17.7 | 18.4 | 0.6 |
| Minnesota | 4.4 | 4.9 | 0.5 |
| California | 7.2 | 7.7 | 0.5 |
| Colorado | 7.5 | 8.0 | 0.5 |
| Indiana | 8.3 | 8.7 | 0.5 |
| North Carolina | 10.7 | 11.3 | 0.5 |
| Michigan | 5.4 | 5.8 | 0.4 |
| Illinois | 7.0 | 7.4 | 0.4 |
| New Jersey | 7.4 | 7.9 | 0.4 |
| United States | 8.9 | 9.2 | 0.3 |
| Massachusetts | 2.8 | 3.0 | 0.2 |
| Pennsylvania | 5.5 | 5.8 | 0.2 |
| Virginia | 8.8 | 7.9 | -0.9 |
The states with the lowest and highest uninsured rates in 2019 were unchanged from the previous year. Massachusetts again had the lowest rate of uninsured at 3.0%, though this rate did increase by 0.2 percentage points from 2.8% in 2018, and Texas continued to have the highest rate of uninsured at 18.4%, a 0.6 percentage-point increase from 17.7% in 2018.
Medicaid Expansion Status and State Uninsured Levels, 2019
Expansion States
Among the 32 states and D.C. that had adopted Medicaid expansion as of January 1, 2019, an overall 14 states saw increases in their uninsured rates. Massachusetts had the lowest rate of uninsured at 3.0% and Alaska had the highest rate at 12.2%.
Louisiana had the largest increase at 0.9 percentage points, jumping to 8.9% from 8.0% in 2018, and Pennsylvania had the smallest significant increase at 0.2 percentage points from 5.5% in 2018 to 5.8% in 2019.
After implementing Medicaid expansion on January 1, 2019, Virginia was the only state to experience a decrease in the uninsured rate, falling 0.9 percentage points to 7.9% in 2019 from 8.8% in 2018.
Non-Expansion States
Among the 18 states that had not adopted Medicaid expansion as of January 1, 2019, Wisconsin had the lowest rate of uninsured at 5.7% and Texas had the highest rate of uninsured at 18.4%.
Additionally, across these same states that had not adopted Medicaid expansion, five (Wyoming, Mississippi, Missouri, Texas and North Carolina) experienced increases in their rates of uninsured. Wyoming saw the largest increase at 1.8 percentage points, with its rate climbing to 12.3% in 2019 from 10.5% in 2018. North Carolina saw the smallest significant increase in its uninsured rate, rising to 11.3% in 2019 from 10.7% in 2018, a change of 0.5 percentage points.
More Insights on the 2019 Health Insurance Coverage Estimates at Upcoming September 23rd Webinar with SHADAC and Census Bureau Experts
On Wednesday, September 23rd at 12:00 PM Central Time (1:00 PM Eastern), SHADAC will host a webinar to examine the new 2019 coverage estimates from the ACS as well as from the Current Population Survey (CPS), with technical insight provided by researchers from SHADAC and from the U.S. Census Bureau, which administers both surveys.
Speakers will discuss the new national and state-level estimates, and attendees will learn:
- When to use which estimates from which survey
- How to access the estimates via Census reports and the new data.census.gov site
- How to access state-level estimates from the ACS using SHADAC tables
- Attendees will have an opportunity to ask questions after the speaker presentations.
Related Materials:
- 2019 ACS: Insurance Coverage Overall Fell Nationwide and among the States, with Private and Public Coverage Declines Seen at the State Level
- 2019 ACS Tables: State and County Uninsured Rates, with Comparison Year 2018
- New Subsidized Marketplace Data and Other Data Tables Now Available from the 2019 American Community Survey (ACS)
Notes
All differences described here are statistically significant at the 90% level of confidence unless otherwise specified.
All estimates are for the civilian noninstitutionalized population and come from the American Community Survey 1-Year Estimates as reported in Table A3 of “Health Insurance Coverage in the United States: 2019,” available at https://www.census.gov/library/publications/2020/demo/p60-271.html
Blog & News
2019 NHIS Full-Year Insurance Coverage Estimates Early Release: Uninsurance Increases, Variation among Public and Private Coverage
September 11, 2020:The National Center for Health Statistics (NCHS) released health insurance coverage estimates for 2019 from the National Health Interview Survey (NHIS) as part of the NHIS Early Release Program. These are both the first available full-year coverage estimates for 2019 from a federal survey as well as the first full-year estimates released since the NHIS questionnaire was redesigned and launched in January 2019—further details on which can be found at the end of this post.
National-level estimates are available by breakdowns including age group, sex, poverty status, race and ethnicity, and by state Medicaid expansion status. This is the first time that the NHIS full-year estimates have not included either full or partial state-level data.
More Americans without Health Insurance Coverage in 2019; Public Coverage Remained Steady and Private Coverage Fell among Certain Subgroups
The uninsured rate for all ages increased by 0.9 percentage points to 10.3% in 2019, up from 9.4% in 2018. This represents 33.2 million uninsured persons of all ages and is the first significant rise in the uninsured rate in several years as shown by the NHIS. Uninsured rates also increased from 2018 among all nonelderly persons (0-64) and nonelderly adults (19-64)—with the nonelderly rate rising 1.0 percentage points from 11.1% to 12.1% in 2019, and nonelderly adult rate increasing 1.4 percentage points from 13.3% to 14.7% in 2019.
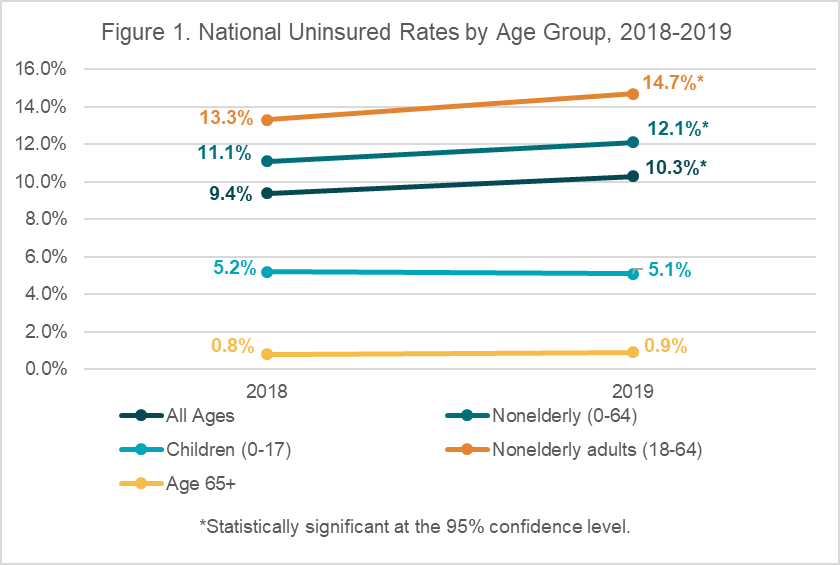
Rates of public coverage were statistically unchanged across all age groups, while among nonelderly adults, rates of private coverage fell 2.1 percentage points in 2019 to 66.8% from 68.9% in 2018. Rates of uninsurance, private coverage, and public coverage were stable in 2019 for children (age 0-17).
More Black Americans had public coverage, fewer had private coverage; Uninsured rate increased among Whites*
Among the nonelderly population, the only racial/ethnic group that saw an increase in the uninsured rate were non-Hispanic Whites, whose rate increased to 9.0% in 2019 from 7.8%, a rise of 1.2 percentage points. Uninsured rates remained statistically unchanged for other racial/ethnic groups between 2018 and 2019.
One of the most significant findings in this category was a relatively large decrease in rates of private coverage of 3.7 percentage points among non-Hispanic Blacks, whose rate fell to 48.5% from 52.2% in 2018. Rates of private coverage were again statistically unchanged among other racial/ethnic groups.
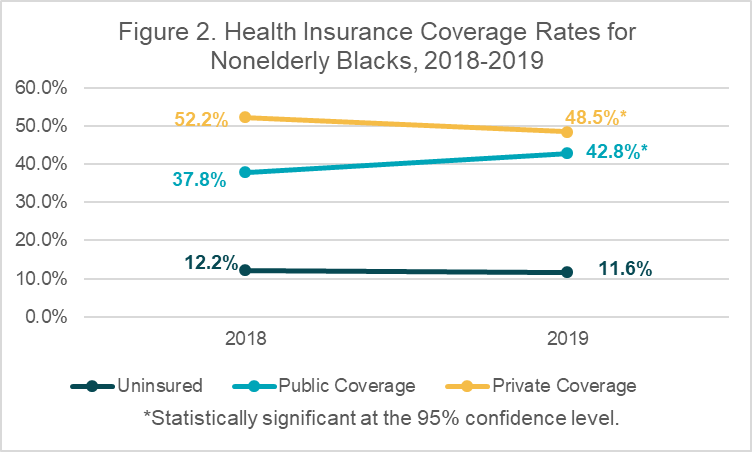
Conversely, non-Hispanic Blacks experienced a large increase in rates of public coverage, which rose by 5.0 percentage points to 42.8% in 2019 from 37.8%. Rates of public coverage were statistically unchanged for other racial/ethnic groups.
More Women were Uninsured in 2019
The uninsured rate among nonelderly women increased to 11.0% in 2019, up from 10.0% in 2018, representing a 1.0 percentage-point increase. The uninsured rate among nonelderly men remained steady at 13.2%.
Uninsurance, Public and Private Coverage Rates See Similar Trends by State Medicaid Expansion Status
Across both those states that opted to expand Medicaid and those states that have yet to adopt Medicaid expansion, the nonelderly uninsured rate significantly increased in 2019 from 2018, rising to 9.1% from 8.3% (a 0.8 percentage-point increase) in expansion states and rising to 17.1% from 15.4% (a 1.7 percentage-point increase) in non-expansion states.
Though the year-over-year changes did not reach the specified threshold for statistical significance, both expansion and non-expansion states experienced possible erosions in rates of private coverage, with rates falling 1.4 percentage points to 65.0% in the former and falling 1.6 percentage points to 61.4% in the latter. Rates of public coverage experienced smaller, statistically insignificant changes in both categories of states.
Notes about the Estimates
*All subsequent category breakdowns (Race/Ethnicity, Sex, and Medicaid Expansion Status) encompass the nonelderly population, age 0-64.
The above estimates provide a point-in-time measure of health insurance coverage, indicating the percent of persons with that type of coverage at the time of the interview.
All changes described compare full-year 2018 to full-year 2019 and are statistically significant at the 95% confidence level unless otherwise specified.
2019 NHIS Redesign
The NHIS recently underwent a substantial redesign of its content and structure, the goals of which were to “improve the measurement of covered health topics, reduce respondent burden by shortening the length of the questionnaire, harmonize overlapping content with other federal health surveys, establish a long-term structure of ongoing and periodic topics, and incorporate advances in survey methodology and measurement.”[1]
One of the largest changes made under the redesign is the elimination of the family questionnaire, which previously asked questions about the family as a whole as well as separately of each member of the family. Most of the family questionnaire content was moved to revised sample adult and sample child questionnaires, which are asked of one adult and one selected at random from members of the household and has the effect of substantially reducing the available sample size. For example, the 2019 full-year early release report has a total sample of 32,391 persons, whereas the same report in 2018 was based on a sample size of 72,762 persons. However, NCHS anticipates that the redesign’s reduction in respondent burden will result in more sample adult and sample child interviews due to higher response rates.
[1] National Center for Health Statistics (NCHS). (2019, November 27). 2019 Questionnaire Redesign. Available from https://www.cdc.gov/nchs/nhis/2019_quest_redesign.htm
Publication
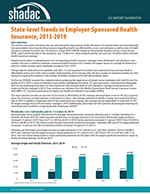
State-level Trends in Employer-sponsored Health Insurance (ESI), 2015-2019
| ESI PRODUCTS |
|
State Profiles 50-State Comparison Tables
Interactive Maps See the bottom of the companion blog for an interactive map showing levels of, and changes in, average annual premiums for single and family coverage in 2019. |
Introduction
The arrival of the novel coronavirus has not only disrupted many patterns of life and work in the United States and internationally, but exacerbated many long-standing concerns regarding health care affordability, access, and utilization as well as rates of health insurance coverage for Americans. For instance, in April 2020 SHADAC fielded an AmeriSpeak Omnibus survey, conducted by NORC, which found that due to the pandemic, over 7 million U.S. adults delayed needed care and over 10 million adults lost their health insurance coverage.1
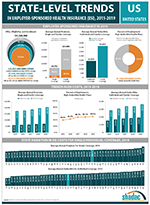
Despite record spikes in unemployment and corresponding health insurance coverage losses attributed to the pandemic (estimated in the tens of millions), employer-sponsored health insurance (ESI) remains the largest source of coverage for Americans,2 with 62.5 million private-sector employees enrolled in ESI in 2019.
Though data for 2020 will not be available until 2021, it is still important to monitor and understand long-running trends in affordability and access in this critical market. Understanding 2019 coverage data will also provide an important baseline for measuring the ongoing fluctuations in the number of workers covered by ESI until the pandemic eases.
To this end, SHADAC presents four related products analyzing the experiences of private-sector employees who had ESI over the period of 2015-2019: a series of individual state profiles highlighting ESI trends, a national-level infographic with an accompanying blog, 50-state data tables, and a 50-state interactive map showing levels of, and changes in, average annual premiums for single coverage in 2019. These analyses use estimates from the Medical Expenditure Panel Survey–Insurance Component (MEPS–IC), recently produced by the Agency for Healthcare Research and Quality (AHRQ).
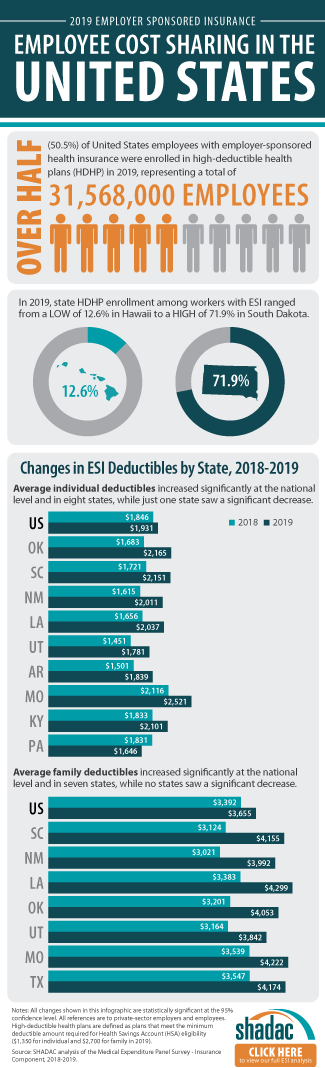
This brief narrative provides an overview of the trends in affordability of ESI coverage and employees’ access to ESI. As in previous years, ESI premiums are high and have continued to increase—the average premium for family coverage was nearly $20,500 per year in 2019. In addition, employees with ESI face substantial cost sharing, with average annual deductibles of more than $1,931 for single coverage and $3,655 for family coverage in 2019. Additionally, more than half (50.5 percent) of employees receiving ESI nationwide were enrolled in a high-deductible health plan (HDHP).3
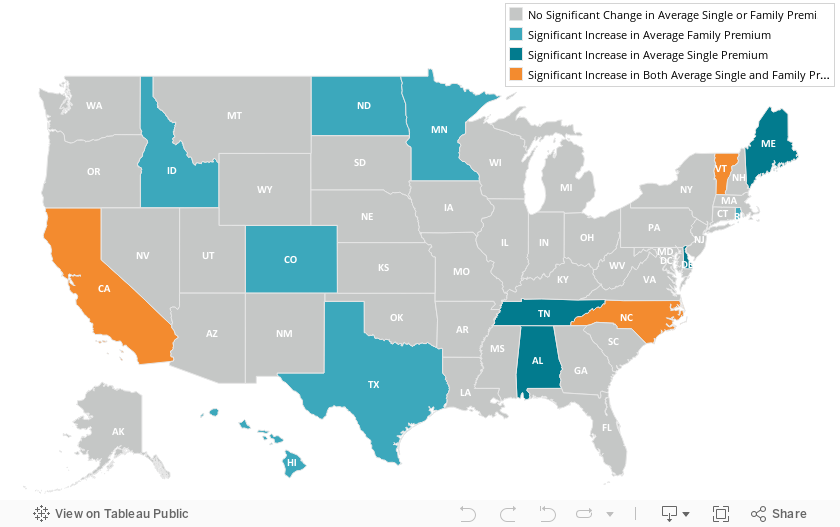
Premiums rose nationally and in 13 states in 2019
Among private sector workers who receive ESI, average annual premiums increased nationally and in 13 states (including D.C.) between 2018 and 2019. No states experienced decreases in average premiums over that period. Nationally, single premiums increased 3.8 percent ($257) from $6,715 in 2018 to $6,972 in 2019. Family premiums increased 4.7 percent ($921) from $19,565 in 2018 to $20,486 in 2019. This follows a near decades-long trend of premium increases—between 2002 and 2019, single premiums increased 119 percent ($3,783) and family premiums increased 142 percent ($12,017).4
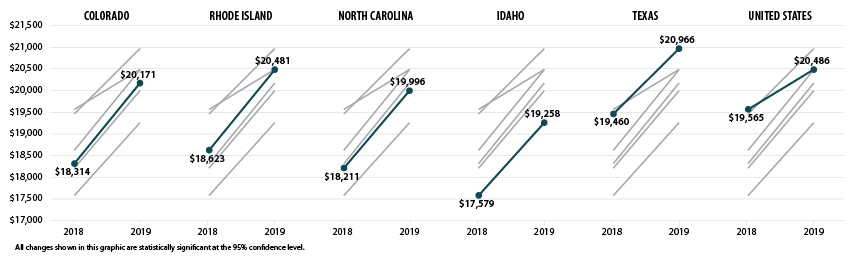
Delaware saw the largest percentage increase in single premiums at 18.1 percent (or $1,242) from $6,848 in 2018 to $8,090 in 2019, and Colorado had the largest increase in family premiums at 10.1 percent (or $1,857) from $18,314 in 2018 to $20,171 in 2019. The chart below shows trends in single and family premiums for the states with the largest significant increases in single or family premiums between 2018 and 2019.
Average Single and Family Premiums, 2015-2019

States with the Largest Increases in Average Single Premiums, 2018-2019

States with the Largest Increases in Average Family Premiums, 2018-2019
Premiums also ranged significantly across the states in 2019, from $6,054 in Arkansas to $8,933 in Alaska for single coverage and from $17,734 in Alabama to $22,969 in Alaska for family coverage.
Deductibles rose nationally and in 10 states
Employees with coverage through their employer continued to face large and rising deductibles in 2019. Nationally, the average deductible reached $1,931 (an increase from $1,846 in 2018) for individuals and $3,655 for families (an increase from $3,392 in 2018). Eight states saw increases in individual deductibles, and seven states saw increases in family deductibles.
Only Pennsylvania saw a decline in average individual deductibles, falling by $73, from $1,831 in 2018 to $1,646 in 2019.
Average Individual and Family Deductibles, 2015-2019
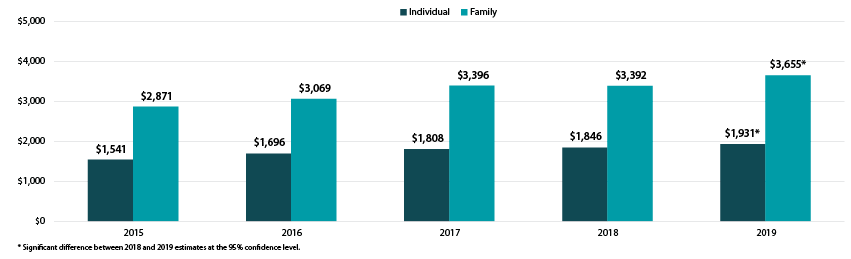
There was a great deal of variation across states in the size of deductibles, ranging from $1,267 in Hawaii to $2,521 in Montana for individual deductibles and from $2,619 in Hawaii to $4,615 in Tennessee for family deductibles.
High-deductible health plan enrollment changes across the states
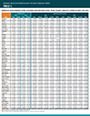
Nationwide, the percent of employees enrolled in a high-deductible health plan (HDHP) held steady in 2019 at 50.5 percent. This was the second consecutive year of no significant national change in HDHP enrollment.
Percent of employees enrolled in a high-deductible health plan by state, 2019
Interactive Map: Hover over a state on the map below to view the percent of employees enrolled in a HDHP in 2019, or click a state to view and download its individual state profile.
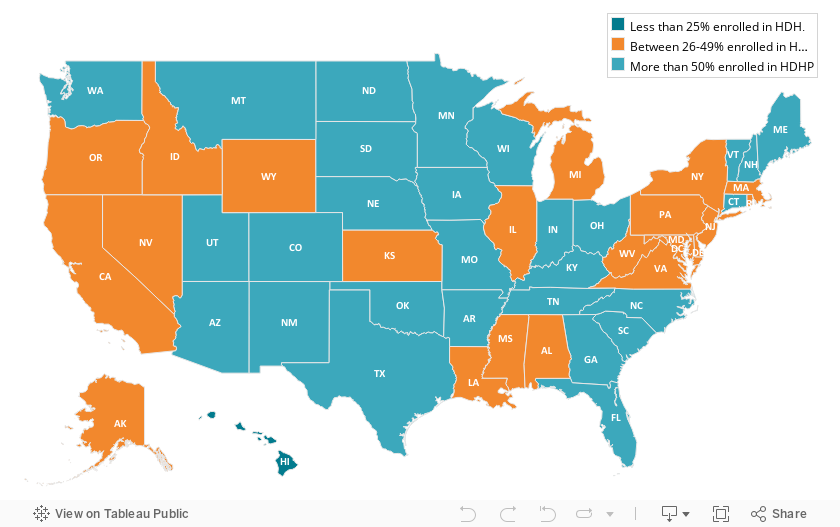
Examining HDHP enrollment at the state level reveals some interesting changes between last year and the year prior. In 2018, a majority of employees were enrolled in a HDHP in nine states. In 2019, however, a majority of employees were enrolled in a HDHP in 28 states, as illustrated by the above map. Additionally, in just one state (Hawaii) less than a quarter of employees were enrolled in an HDHP.
Employees’ access to employer-sponsored coverage largely unchanged in 2019
Employee access to ESI has three components:
1. Employee Offer: An employee must work in an establishment that offers coverage.
2. Employee Eligibility: An employee must meet the criteria established by the employer to be eligible for coverage that is offered. (For example, the employee might have to work a minimum number of hours per pay period or complete a minimum length of service with the employer in order to be eligible.)
3. Employee Take-Up: The employee must decide to enroll in (“take up”) the offer of ESI coverage.
Less than half (47.4 percent) of private-sector establishments offered coverage to their employees in 2019, statistically unchanged from 2018. Substantial variation across the states remained, with offer rates ranging from 37.9 percent in Utah to 84.1 percent in Hawaii.5
Nationally, 85.3 percent of employees worked at an establishment that offered ESI in 2019, a slight increase from 2018. This was driven by an increase in three states (Delaware, New Jersey, and South Carolina); no states saw a decrease in the percent of employees in establishments that offer coverage.
Among employees working at an offering establishment, 77.7 percent were eligible for ESI coverage in 2019 (no change from 2018). In 2018, three states (Kansas, New Mexico, and South Dakota) saw increases in the eligibility rate; no states saw a decrease.
Among employees eligible for coverage, 71.9 percent enrolled in ESI in 2019 (statistically unchanged from 2018), and only two states (Connecticut and Utah) saw a decline in enrollment.
It is important to remember that these trends pre-date the COVID-19 pandemic and the associated employment losses. It is likely that millions of Americans have lost ESI coverage since March of 2020. It seems likely, however, that the long-running trends in health care costs remain unchanged—our analysis shows continued increase in premiums and deductibles and high rates of enrollment in HDHP.
For more detailed information on ESI findings from SHADAC, see the following products:
- Printable version of this ESI Report Narrative
- Companion Blog and Infographic highlighting key findings at the national level regarding ESI coverage affordability and access
- Two-page profiles on ESI trends for each state
- 50-state interactive map showing levels of, and changes in, average annual premiums for single and family coverage in 2019, with links to state profile pages
- 50-state comparison tables including 2015-2019 ESI data
Notes and Sources
Notes. All changes and differences described in this report are statistically significant at the 95 percent confidence level, unless otherwise specified. This analysis and linked products only pertain to employers, establishments, and employees in the private sector. Average premium prices have not been adjusted to account for variation in actuarial value.
Sources. Data are from the 2015–2019 Medical Expenditure Panel Survey–Insurance Component (MEPS-IC), produced by the Agency for Healthcare Research and Quality (AHRQ) and are available on SHADAC’s State Health Compare web tool at statehealthcompare.shadac.org.
References
1 State Health Access Data Assistance Center (SHADAC). (2020, August 24). SHADAC COVID-19 Survey Chartbooks Provide Visualizations of Coronavirus Impacts of Health Insurance Coverage, Access and Affordability of Care, and Pandemic Stress Levels of U.S. Adults. Available at https://shadac.org/SHADAC-COVID-19-Survey-Chartbooks
2 Zipperer, B. & Bivens, J. (2020, May 14). 16.2 million workers have likely lost employer-provided health insurance since the coronavirus shock began. Retrieved from https://www.epi.org/blog/16-2-million-workers-have-likely-lost-employer-provided-health-insurance-since-the-coronavirus-shock-began/
Golberstein, E., Abraham, J.M., Blewett, L.A., Fried, B., Hest, R., & Lukanen, E. (April 2020). University of Minnesota COVID-19 Health Insurance Model estimates that as many as 18.4 million individuals may be at risk of losing their employer-sponsored health insurance coverage (ESI). Available at https://shadac.org/publications/COVID-19-MNHealth-Insurance-Model
Health Management Associates (HMA). (2020, April 3). COVID-19 Impact on Medicaid, Marketplace, and the Uninsured, by State. Retrieved from https://www.healthmanagement.com/wp-content/uploads/HMA-Estimates-of-COVID-Impact-on-Coverage-public-version-for-April-3-830-CT.pdf
3 Defined as plans that qualify for a tax-advantaged health savings account. In 2019, qualifying plans had to have an annual deductible of at least $1,350 for individual coverage or at least $2,700 for family coverage.
4 State Health Compare. (2020). Average Annual ESI Premium: 2002-2019 [data set]. Available at http://statehealthcompare.shadac.org/trend/34/average-annual-employer-sponsored-insurance-premium-by-plan-type#14/1/57,58/9,10,11,12,13,1,2,3,4,5,6,7,8,15,24,25,27/65
5 Hawaii has a broad employer mandate that preceded the ACA. The Hawaii Prepaid Health Care Act, enacted in 1974, requires private employers to provide health insurance for employees who work at least 20 hours (some exceptions apply).
Blog & News
Employer-Sponsored Insurance, 2015-2019: Premiums Hit New Highs and Deductibles Resume Increases after Brief Plateau (Infographic)
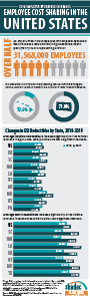
September 10, 2020:More than 62.5 million private sector workers in the United States received health insurance benefits from their employer in 2019, and, according to SHADAC researchers, paid higher-than-ever premiums for their health plans last year. Using data from the Medical Expenditure Panel Survey-Insurance Component (MEPS-IC), a new analysis from SHADAC highlights the experiences of private sector workers with employer-sponsored insurance (ESI) from 2015 through 2019 at the national level and within the states.
 Key Findings
Premiums
- The national average annual single-coverage premium rose by $257, or 3.8 percent, to $6,972 in 2019.
- Premium increases for single coverage were also seen in seven states (Alabama, California, Delaware, Maine, North Carolina, Tennessee, and Vermont), and no state saw a significant decrease in single coverage premiums.
- In 2019, the average annual family-coverage premium nationwide rose by $921 to $20,486—a 4.7 percent increase from 2018.
- Family premiums for ESI also increased in 10 states, with no significant state-level decreases seen.
Deductibles
- The national average annual single-coverage deductible increased to $1,931 in 2019, rising 4.6 percent from $1,846 the year before.
- Among the states, eight saw increases in average deductibles for single coverage while just one state (Pennsylvania) saw a significant decrease.
- The 2019 average annual family-coverage deductible also increased to $3,655, or 7.8 percent, from $3,392 in 2018.
- Seven states also saw their annual deductibles for family coverage increase in 2019; however, no states saw a significant decrease.
High-Deductible Health Plan Enrollment
- In 2019, half of private-sector employees nationwide who had ESI (50.5 percent) were enrolled in a high-deductible health plan (HDHP), a rate that was statistically unchanged from 2018 (49.1 percent) but that is 11.1 percentage points higher than in 2015 (39.4 percent).1
Coverage
- Nationwide, the percentage of employers offering health insurance coverage remained steady at 47.4 percent in 2019.
- This offer extends to the majority of private-sector employees - in 2019, 85.3 percent of employees worked in establishments that offer health insurance coverage.
- Employee eligibility for employer-sponsored insurance held steady as well, at 77.7 in 2019.
- The percent of eligible U.S. employees enrolled in health coverage through ESI also saw no significant change between 2018 and 2019—registering at 71.9 percent in 2019.
The Takeaway
As the majority of the United States population continues to receive health insurance coverage from their employer, it is important to remember that trends in ESI data such as rising premiums and continuing high enrollment in HDHPs affect a significant number of people. And while 2018 saw a plateau in deductible growth, 2019 once again saw increases in both single and family deductibles, with SHADAC’s State Health Compare estimates confirming an overall trend in rising deductibles for employer-sponsored insurance more than doubling nationwide over the past 10 years.
Explore the Analysis
The following products present detailed findings from this analysis:
Average Single and Family Premiums, 2019
Interactive Map: Hover over a state on the map below to view the average single- and family-coverage premiums in 2019, or click a state to view and download its individual state profile.
 For more detailed information on ESI findings from SHADAC, see the following products:
- Report Narrative highlighting key findings on levels of, and trends in: average ESI premiums and deductibles as well as employee access to and take-up of ESI coverage
- Two-page profiles on ESI trends for each state
- 50-state comparison tables 2015-2019 ESI data
Related Resources
SHADAC Blog
Now Available on State Health Compare: 12 Updated and New Measures on Health Insurance Coverage, Cost of Care, Public Health, Health Behaviors and Outcomes, and Quality of Care
SHADAC ESI Report (2019)
Employer-Sponsored Health Insurance at the State Level, 2014-2018
SHADAC ESI Blog (2019)
Employer-Sponsored Insurance, 2014-2018: Premiums Reach New Heights while Deductibles Hold Steady
1 For the purposes of this analysis, high-deductible health plans are defined as plans that meet the minimum deductible amount required for Health Savings Account (HSA) eligibility ($1,350 for an individual and $2,700 for a family in 2019). This includes employees enrolled in single- and family-coverage plans.
Blog & News
New Brief details 2020 update for the SHADAC Health Insurance Unit (HIU)
July 31, 2020: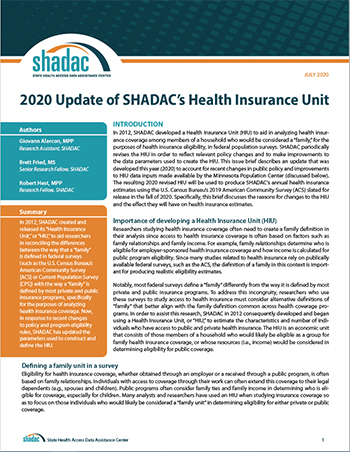 In the years following the passage of the Patient Protection and Affordable Care Act (ACA), SHADAC developed and introduced its Health Insurance Unit, or “HIU,” a tool to aid in defining family interrelationships in federal population surveys for the purpose of analyzing health insurance coverage.
Now, SHADAC has revised its HIU in response to recent policy shifts, such as changes to eligibility for public and private insurance programs and changes to how relationships are coded in the federal surveys. A new brief from SHADAC researchers describes the revisions to the HIU, details the associated updates and improvements made to the data parameters used to create the HIU, and shows how this new HIU can be applied to federal survey research.
What is the SHADAC HIU?
Originally released in 2012, one of the goals of the SHADAC HIU is to establish a common definition of a “family unit” to help ensure consistent and comparative research across major national surveys when analyzing health insurance coverage.
Most federal surveys define a “family” differently from the way it is defined by most private and public insurance programs. For instance, the definition of "family" or "household" in U.S. Census Bureau surveys includes all related members of a household, no matter the degree of relationship, and does not necessarily align with dependent coverage or public program eligibility.
The SHADAC HIU attempts to more closely align with a definition of family used for private and public health insurance coverage eligibility. The SHADAC HIU uses a narrower definition of family that looks at specific interrelationships between individuals within a household and excludes all non-dependent relatives (grandparents, adult siblings, aunts/uncles, etc.) who may be household members but are unlikely to be considered as part of the “family unit” as defined for the purposes of determining eligibility for health insurance.
The SHADAC HIU, then, is defined as an economic unit that consists of those members of a household who would likely be eligible as a group for family health insurance coverage, or whose resources (i.e., income) would be considered in determining eligibility for public coverage.
Original vs. Revised: How the SHADAC HIU is constructed
The SHADAC HIU is constructed based on a set of rules for assigning individuals within a household into family groups based on their familial relationships. The updates to the revised SHADAC HIU center around changes to these assignment rules.
The original version of the HIU created “family units” using the following assignment rules:
- single adults with no children of their own living with them are assigned to their own HIU
- married couples with no children of their own living with them are placed together in an HIU
- single or married parents and their eligible children (i.e., children 18 years of age or younger, who do not have a spouse in the household and have no children of their own) are assigned to an HIU
- eligible children with no parent in their household, but who are related to the household reference person are placed in the reference person’s HIU
- eligible children with no parent in the household and who are not related to the household reference person are placed in their own HIU
As a result of recent policy and health landscape changes, the revised version of the HIU creates “family units” using the following assignment rules:
- single adults with no children of their own living with them are placed in their own HIU
- married couples with no children of their own living with them, now including same-sex couples as well as couples who report being separated but still live together, are placed together in an HIU1
- single or married parents and their eligible children (i.e., children 18 years of age or younger, who do not have a spouse in the household and have no children of their own), now including same-sex couples as well as couples who report being separated but still live together are placed together in an HIU1
- eligible children with more than one unmarried parent in the household are now placed in the HIU of the parent with the highest income
- eligible children with no parent in their household, but who are related to the household reference person are placed in the reference person’s HIU
- eligible children with no parent in the household and who are not related to the household reference person are placed in their own HIU
- eligible married children who live apart from their spouse but in the same household as one or more of their parents are now incorporated into the HIU of the parent(s)
Click on the brief to download a PDF and learn more about the revisions to the SHADAC HIU.
Explore current and upcoming data using the SHADAC HIU
While SHADAC’s HIU was originally constructed with the intention to be broadly consistent with the family unit that is relevant for public and private insurance, it is able to be tailored to specific criteria used in individual states, for specific programs, or for specific types of analysis.
Our State Health Compare web tool currently houses estimates produced using the original SHADAC HIU, including breakdowns from the Health Insurance Coverage measure such as income and poverty level.
For more on the original version of the HIU, see our issue brief with more on creation and definitions of the HIU and our technical brief with information, and example STATA and SAS code for using the HIU. Estimates and code using the revised HIU will be available following this year’s U.S. Census Bureau American Community Survey (ACS) and Current Population Survey (CPS) release in September.
NOTES
1 Same-sex couples are now included as of the 2015 ruling by the Supreme Court in Obergefell v. Hodges granting their legal right to marry.
Couples who report being separated but still live together are considered legally married and therefore still considered eligible for coverage under their spouse’s insurance.

