
Blog & News


New Subsidized Marketplace Data and Other Data Tables Now Available from the 2019 American Community Survey (ACS)
September 23, 2020:The U.S. Census Bureau recently released 2019 estimates of income, poverty, and health insurance coverage from both the Current Population Survey Annual Social and Economic Supplement (CPS ASEC) and the American Community Survey (ACS).
Along with the new estimates, several new data sets and features from the surveys are also now available for this year, including new estimates of subsidized marketplace insurance coverage, which is the main subject of this post.
New Data
In 2019, for the first time, the American Community Survey (ACS) asked respondents if they or a family member received a “tax credit or subsidy based on family income” to help pay for their coverage.1 These subsidies are only available through the Affordable Care Act (ACA) marketplaces for individuals who are eligible based on their family income. By adding this question, researchers at the Census Bureau and other data users are now able to create estimates for the number and percent of the population who receive subsidized ACA marketplace coverage.
As part of a high-level analysis, SHADAC researchers found that at the national level, approximately 1.6% of the civilian noninstitutionalized population reported having subsidized marketplace coverage—representing nearly 5.3 million individuals.
Across the states, rates of subsidized marketplace coverage ranged significantly from a low of 0.7% in West Virginia and D.C. to a high of 3.4% in Florida and Utah.
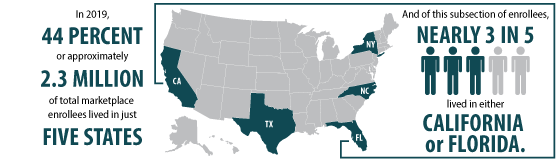
The five states with the largest populations of individuals with subsidized marketplace coverage were California, Florida New York, North Carolina, and Texas. More than 40% of total marketplace enrollees lived in one of these five states, and of that subsection of enrollees, nearly 3 in 5 lived in either California or Florida.
Eleven states (Florida, Idaho, Maine, Montana, Nebraska, North Carolina, South Carolina, South Dakota, Utah, Wisconsin, and Wyoming) had rates of subsidized marketplace coverage that were significantly higher than the national rate in 2019. Of these states, only Montana and Maine had implemented Medicaid expansion for the majority of 2019, which expands the portion of the population eligible for ACA subsidies. (Montana implemented Medicaid expansion as of January 1, 2019, and Maine implemented expansion on January 10, 2019.)
Twenty states (Alaska, Arizona, Arkansas, Connecticut, Delaware, Hawaii, Iowa, Illinois, Indiana, Kentucky, Louisiana, Massachusetts, Maryland, Minnesota, Mississippi, New Mexico, New York, Ohio, Washington, and West Virginia) and D.C. had rates of subsidized marketplace coverage that were significantly lower than the national rate in 2019. Of these 20 states and D.C., only Mississippi had chosen not to expand Medicaid as of January 1, 2019.
Nineteen states had rates of subsidized marketplace coverage that were not statistically different from the national rate.
New Data Tables and Geographic Breakdowns
Along with the new question and corresponding data table on subsidized coverage discussed above, other new data tables available from the ACS this year include:
- Population: a new table on place of birth shows the year of entry among the foreign-born population for the nine largest country of birth groups. Estimates are divided between year of entry before 2010 and year of entry beginning 2010 and later.
- Households and Families: two new tables provide information regarding (1) couples who live together with biological children, stepchildren, or adopted children of the main householder who are under 18 and have not been married; and (2) married couples, cohabiting couples, and single householders (male or female) with no spouse or partner present who also live with either relatives or their own children under 18.
- Quality Measure: this new table provides the unweighted total population sample for the nation, states, counties, and places.
Extensive modifications have also been made to existing ACS data tables, a full listing of which can be found here.
In addition to data table changes, the Census Bureau has also created an updated posting regarding geographic entities of varying sizes and designations (cities, towns, townships, school districts, Native American reservations, etc.) that have either come into existence, been absorbed into other entities, or have been dissolved in 2019. A full listing of all new, modified, or removed geographic breakdowns used for the 2019 ACS estimates can be found here.
Related Materials:
- 2019 ACS: Rising National Uninsured Rate Echoed Across 19 States; Virginia Only State to See Decrease (Infographics)
- 2019 ACS: Insurance Coverage Overall Fell Nationwide and among the States, with Private and Public Coverage Declines Seen at the State Level
- 2019 ACS Tables: State and County Uninsured Rates, with Comparison Year 2018
Note: All differences described here are significant at the 90% confidence level
Reference:
1 U.S. Census Bureau. (2018, August 2.) The American Community Survey: Questionnaire. Retrieved from https://www2.census.gov/programs-surveys/acs/methodology/questionnaires/2019/quest19.pdf
Blog & News
September 23rd Webinar - An Annual Conversation with the U.S. Census Bureau: 2019 Health Insurance Coverage Data from the American Community Survey (ACS) & Current Population Survey (CPS)
September 4, 2020:On Wednesday, September 23, 2020, SHADAC researchers and U.S. Census Bureau experts held a webinar that examined the new 2019 health insurance coverage data at both the national and the state level, as well as by coverage type, from both the American Community Survey (ACS) and the Current Population Survey Annual Social and Economic Supplement (CPS ASEC).
In addition to further details on important health insurance coverage data and trends,
webinar attendees learned about:
- When to use which estimates from which survey
- How to access the estimates via Census reports and Census data site: data.census.gov
- How to access state-level estimates from the ACS using SHADAC tables
Panelists on this webinar included:
 Lynn Blewett, PhD - the founding Director of SHADAC, as well as a Professor in the Division of Health Policy and Management at the University of Minnesota, School of Public Health, where she teaches graduate courses on the U.S. health care system and international health systems. Dr. Blewett has a committed history in working and researching health policy, access to care, Medicaid coverage, and payment policy with experience at both the state and national levels. She has expertise in leading applied policy research, directing research with diverse funding, analyzing state and federal data resources and translating research to inform health policy. Her health policy experience includes legislative work for the U.S. Senate and state policy work as Director of the Health Economics Program for the Minnesota Department of Health. Dr. Blewett holds a Ph.D. and a master's in Public Affairs from the University of Minnesota, and a B.A. from the University of Wisconsin at Madison.
 Laryssa Mykyta, PhD - the chief of the Health and Disability Statistics Branch in the Social, Economic and Housing Statistics Division at the U.S. Census Bureau. The Health and Disability Statistics Branch is primarily responsible for analyzing and publishing data collected on health insurance coverage, health status and health care utilization, and disability. These data are collected in the Current Population Survey Annual Social and Economic Supplement, the American Community Survey, and the Survey of Income and Program Participation. Her research interests focus on how changing economic conditions influence health and well-being. Ms. Mykyta was previously an assistant professor in sociology and director of the Center for Survey Research and Policy Analysis at the University of Texas Rio Grande Valley. Ms. Mykyta received her doctorate in sociology and demography from the University of Pennsylvania.
 Katherine Keisler-Starkey, PhD - an Economist and Survey Statistician at the U.S. Census Bureau. Ms. Keisler-Starkey's research interests focus on Applied Microeconomics, including Health Economics, Public Finance, and Labor Statistics. Ms. Keisler-Starkey received a Ph.D in Economics, a Bachelor of Science degree in Statistics, and a Bachelor of Arts degree in Economics from the University of Texas at Austin.
 Robert Hest, MPP - manages SHADAC’s State Health Compare website, coordinating data processing, quality assurance, dissemination and documentation of data used on the cite. Robert also works on SHADAC’s Minnesota Long-term Care Projection Model (MN-LPM), which projects future long-term care utilization and spending among older adults in Minnesota. In addition, Mr. Hest leads a project tracking and analyzing 1332 State Innovation Waivers for State-Based Reinsurance programs. Before joining the SHADAC staff as a Research Fellow in October 2017, Robert worked at SHADAC as a Graduate Research Assistant. He earned his Master of Public Policy from the Humphrey School of Public Affairs with an emphasis in Policy Analysis, and he received his Bachelor of Arts from Carleton College in Political Science.
A recording of the webinar is available to view and download at the top of this page, and slides and a transcript are also available for download.
Related Resources
2019 ACS Tables: State and County Uninsured Rates, with Comparison Year 2018
Publication
2019 ACS Tables: State and County Uninsured Rates, with Comparison Year 2018
The interactive map on this page links to tables containing state and county uninsurance estimates for 2019. These estimates come from the 2019 American Community Survey (ACS) via the U.S. Census Bureau's data.census.gov tool.
Click on a state below to see state and county uninsurance rates by characteristics (for example, age, race/ethnicity, and poverty level) for 2019 and comparison year 2018. Due to sample size constraints, single-year ACS estimates are available at the county level only for counties with a population greater than 65,000.

Click here to view uninsurance estimates for the United States.
Click here to view uninsurance estimates for Puerto Rico and its municipios.
Note: These tables present uninsured rates, which indicate the share of the population that is uninsured. For example, a 10 percent uninsured rate for adult women indicates that 10 percent of all adult women are uninsured.
Additional Estimates (50-State Comparisons)
Maps & Tables of Private, Public, & Uninsured Changes from 2018 to 2019
Private Coverage Rates by State, Change from 2018 to 2019, for All People
Public Coverage Rates by State, Change from 2018 to 2019, for All People
Uninsurance Rates by State, Change from 2018 to 2019, for All People
About the ACS
The ACS is a household survey that began in 2005 and produces annually updated data on a variety of population characteristics, including health insurance coverage. In total, the ACS surveys approximately three million US households each year. An important feature of the ACS is that it includes a large enough sample for state‐level and sub‐state estimates.
The ACS began asking survey respondents about health insurance coverage during the 2008 calendar year. Specifically, the survey asks respondents about current coverage for each person in the respondent’s household. A person is categorized as “insured” if he or she has coverage at the point in time at which the survey is administered.
Why Aren’t Estimates Provided for All Counties?
Due to sample size constraints, single-year ACS estimates are available at the county level only for counties with a population greater than 65,000.
How Are These Estimates Different from the Estimates that SHADAC Publishes Using Census Bureau Micro-Data Files?
Two definitions used by the Census Bureau to generate the tabulations above differ from those that SHADAC uses to generate tabulations for State Health Compare. The definitional differences are as follows:
Family
- The Census Bureau defines a family as all related people in a household.
- SHADAC defines a family using a measure called the “Health Insurance Unit” (HIU), which includes all individuals who would likely be considered a family unit in determining eligibility for either private or public coverage.
- To learn more about the 2020 update of SHADAC's Health Insurance Unit (HIU) click here.
Family Income
- The Census Bureau determines family income as a percentage of the Federal Poverty Level (FPL), which is a definition of poverty used primarily for statistical purposes. For example, FPL is used to estimate the number of Americans living in poverty each year.
- SHADAC determines family income as a percentage of the U.S. Department of Health and Human Services’ Federal Poverty Guidelines (FPG), which is a measure used for administrative purposes. For example, FPG is used to determine eligibility for federal programs such as Medicaid and the Supplemental Nutrition Assistance Program (SNAP).
- To learn more about the difference between FPL and FPG click here.
Related ACS Materials:
- New Subsidized Marketplace Data and Other Data Tables Now Available from the 2019 American Community Survey (ACS)
- 2019 ACS: Rising National Uninsured Rate Echoed Across 19 States; Virginia Only State to See Decrease (Infographics)
- 2019 ACS: Insurance Coverage Overall Fell Nationwide and among the States, with Private and Public Coverage Declines Seen at the State Level
Blog & News
2019 ACS: Insurance Coverage Overall Fell Nationwide and among the States, with Private and Public Coverage Declines Seen at the State Level
September 17, 2020:The U.S. Census Bureau has released 1-year estimates from the 2019 American Community Survey (ACS), including state-level information about health insurance coverage by type. This post focuses on private and public coverage.
The State Story
Nationally, the health insurance coverage rate was 90.8% in 2019, down from 91.1% in 2018. This overall drop in coverage was reflected by significant decreases in coverage rates across 19 states in 2019. Health insurance coverage increased in just one state, Virginia, in 2019. There was variation in the extent to which states saw changes in public and private coverage in particular, and in whether these changes represented increases or decreases.
Private Coverage Changes by State, 2018-2019: Significant Decreases in 10 States, Increases in Just Two States
Nationally, private coverage was statistically unchanged from 2018, coming in at 67.4% in 2019. Rates of private coverage varied substantially by state in 2019, ranging from a low of 53.7% in New Mexico to a high of 79.1% in North Dakota.
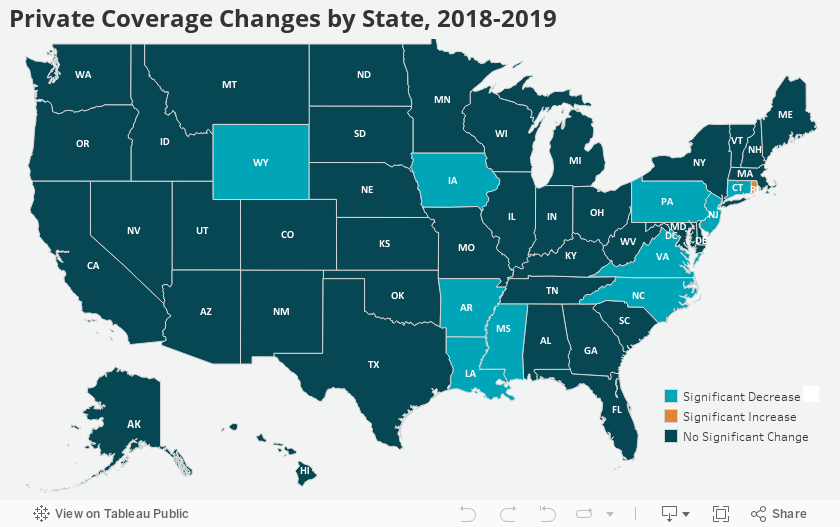
- From 2018 to 2019, ten states (Arkansas, Connecticut, Iowa, Louisiana, Mississippi, New Jersey, North Carolina, Pennsylvania, Virginia, and Wyoming) saw decreases in rates of private coverage in 2019—a substantial change from 2018, when just four states experienced decreases in private coverage (2017-2018). Wyoming saw the largest decrease in private coverage in 2019, dropping 3.3 percentage points to 71.6% from 74.9% in 2018.
- Only Rhode Island and the District of Columbia (D.C.) saw increases in rates of private coverage in 2019—half the number of states (four) that experienced increases in 2018 (looking at 2017-2018 data). Rhode Island experienced the largest increase in private coverage at 3.3 percentage points, increasing from 70.0% to 73.3% in 2019.
- 39 states experienced no significant changes in their rates of private health insurance coverage.
Public Coverage Changes by State, 2018-2019: Significant Decreases Seen by 11 States while Six States Saw Increases
Rates of public coverage fell 0.2 percentage points nationwide from 2018 to 2019, decreasing to 35.4% from 35.6% in 2018. As with private coverage, more states experienced decreases in public coverage than increases in public coverage. Rates of public coverage also continued to vary widely across states in 2019, ranging from a low of 20.7% in Utah to a high of 50.1% in New Mexico.
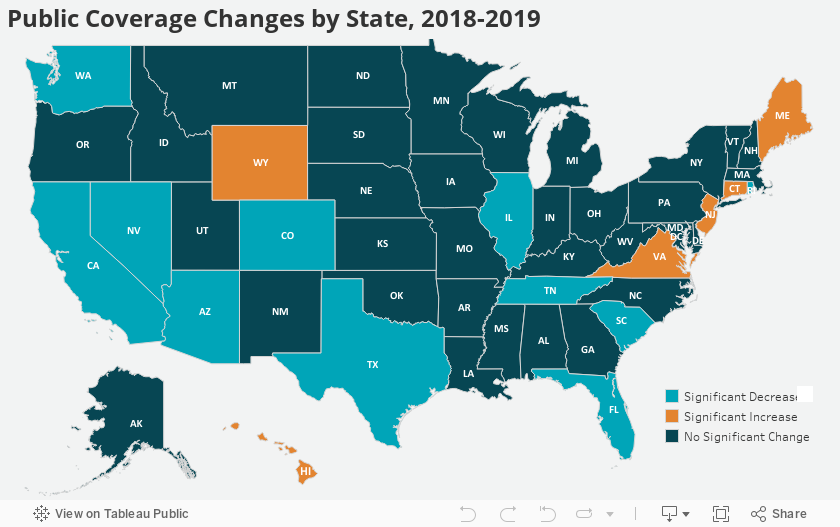
- From 2018 to 2019, 11 states (Arizona, California, Colorado, Florida, Illinois, Nevada, Rhode Island, South Carolina, Tennessee, Texas, and Washington) experienced significant decreases in rates of public coverage. This represents a considerable increase from the previous year when just two states experienced decreases in public coverage (2017-2018). Rhode Island, which experienced the largest increase in private coverage in 2019, conversely saw the largest decrease in public coverage—falling 2.5 percentage points to 36.2% in 2019 from 38.7% in 2018.
- Six states (Connecticut, Hawaii, Maine, New Jersey, Virginia, and Wyoming) experienced significant increases in public coverage, a drop from the previous year when 11 states saw increases in public coverage (2017-2018). Virginia’s public coverage rose to 30.7% in 2019 from 28.6% in 2018—the largest increase seen by any state, at 2.1 percentage points.
- 33 states and the District of Columbia (D.C.) saw no significant changes in rates of public coverage between 2018 and 2019.
Access the 2019 ACS 1-year tables here.
Future Data Releases and Products
Stay tuned for more granular details about insurance coverage changes in the states from 2018 to 2019 via customized SHADAC tables examining coverage at the state and county level.
Supplemental tables for the 2019 ACS 1-Year Estimates will be released from the U.S. Census Bureau on October 15, 2020, and 2015-2019 ACS 5-Year Estimates will be available on December 10, 2020.
Related Materials
2019 ACS: Rising National Uninsured Rate Echoed Across 19 States; Virginia Only State to See Decrease (Infographics)
2019 ACS Tables: State and County Uninsured Rates, with Comparison Year 2018
New Subsidized Marketplace Data and Other Data Tables Now Available from the 2019 American Community Survey (ACS)
More Coverage Insights to Come at September 23rd Webinar with SHADAC and Census Bureau Experts
On Wednesday, September 23rd at 12:00 PM Central Time (1:00 PM Eastern), SHADAC will host a webinar to examine the new 2019 coverage estimates from the ACS as well as from the Current Population Survey (CPS), with technical insight provided by researchers from SHADAC and from the U.S. Census Bureau, which administers both surveys.
Speakers will discuss the new national and state-level estimates, and attendees will learn:
- When to use which estimates from which survey
- How to access the estimates via Census reports and the new data.census.gov site
- How to access state-level estimates from the ACS using SHADAC tables
- Attendees will have an opportunity to ask questions after the speaker presentations.
Publication
Factors in Financial Burdens Related to Health Care for Californians
Though robust Affordable Care Act (ACA) implementation efforts in California have resulted in larger numbers of residents with health care coverage, Californians are now facing coverage-related issues regarding rising costs of care and increasing financial burdens as a result of lack of affordable health care.
In this brief prepared for the California Health Care Foundation (CHCF), SHADAC researchers Colin Planalp, MPA, and Lacey Hartman, MPP, use a multitude of measures from the California Health Insurance Study (CHIS) to measure affordability of health care coverage in California in 2018.
Foundations of Analysis
As found in previous surveys, a number of Californians have reported spending large portions of income on medical bills, with corresponding ramifications such as trouble paying off medical bills, credit card debts, and affording basic necessities such as food and housing. Other consequences, such as skipping or delaying care have also been reported by recent surveys.1
In order to better understand these affordability issues, SHADAC used 2018 data from the California Health Insurance Study (CHIS), the latest year of available data, to perform an analysis of the following cost-of-care measures:
- Health insurance deductibles
- Trouble paying medical bills - Difficulty paying for basic necessities among those reporting trouble paying medical bills
- Medical bill-related credit card debt
SHADAC examined statistically significant changes over time—between 2013, the last year before ACA implementation in 2014, as well as between 2017 and 2018—and between certain demographic groups and the overall state population.
Key Findings
Deductibles
In 2018, 31% of individuals in California reported a deductible of more than $2,000, which was roughly double the rate of 16% in 2013—a statistically significant difference.2 Significant increases in the proportion of California residents with a $2,000 deductible also occurred in key subgroups, including all income levels (up to 138% of FPG, 139% to 249% of FPG, 250% to 399% of FPG, and more than 400% of FPG); Asian, Latin(x), and White Californians; individuals living in both urban and rural areas of the state; and Californians with employer-sponsored insurance (ESI).
Trouble Paying Medical Bills
In 2018, 10% of Californians reported having trouble paying medical bills. Compared to this state average, subgroups reporting a higher percentage of trouble paying medical bills included: individuals with an income level at 139%-249% of Federal Poverty Guidelines (FPG); individuals reporting as multiracial; and uninsured individuals and those with Medicare coverage
Medical Bill-related Burdens
Of those reporting trouble paying medical bills in 2018, 44% said they used credit card debt in order to pay their medical bills. Of that population using credit cards, 35% of people incurring debt of $4,000 or more. Across key subpopulations, those reporting using credit card debt to pay medicals bills at a significantly higher percentage than the statewide average included: individuals with an income level 250% to 399% FPG; White Californians; and those with individual-market coverage. Additionally, the report found a statewide average of 32% of individuals who reported trouble paying medical bills also said those bills caused difficulties affording basic necessities, such as housing and food.
Looking ahead
Though this brief was written before both the arrival of the COVID-19 pandemic and the release of 2019 employer-sponsored insurance (ESI) measures, it is important to note that trends of increasing costs of care and medical bill-related trouble and financial burden found in 2018 are being echoed in data for 2019.
For instance, SHADAC’s recently released annual employer-sponsored insurance report found that Californians experienced significant increases in premiums from 2018 to 2019. Single-coverage premiums rose by $397 from $6,229 to $6,939, and family-coverage premiums rose by $1,221 from $19,567 to $20,788—both of which mark continued concerns around health care affordability for Californians even before the arrival of COVID-19 and our understanding of how that public health crisis will affect these same issues.
Notes
1 Ben-Porath, E., Hachey, E., Sutton, J., & Su, J. (2020). Health Care Priorities and Experiences of California Residents: Findings from the California Health Policy Survey. Retrieved from https://www.chcf.org/wp-content/uploads/2020/02/HealthPolicySurvey2020.pdf
2 “High deductibles” are defined as $1,300 for individual or $2,600 for family-coverage ESI.

