Blog & News
Tracking Health Insurance Coverage During the Unwinding: Monthly Data from the Household Pulse Survey
Originally posted on July 24, 2023 - Last updated on April 22, 2024:This update was posted on April 22, 2024 uses data from the April 2024 release of the Household Pulse Survey, collected March 5 - April 1, 2024.
Introduction
The unwinding of the Medicaid continuous coverage requirement represents the largest nationwide coverage transition since the Affordable Care Act. Since February 2020, enrollment in Medicaid and the Children’s Health Insurance Program (CHIP) has increased by 23 million enrollees and analysis indicates that as many as 15 million individuals will exit Medicaid to other coverage or become uninsured. This blog uses data from the U.S. Census Bureau’s Household Pulse Survey (HPS) to track trends in adult health insurance coverage rates as states “unwind” the Medicaid continuous coverage requirement and restart standard redetermination procedures.
Given the intense interest from policymakers and the media in monitoring coverage transitions during the unwinding, many states have released Medicaid administrative data showing their progress, with some State-based Marketplaces also reporting transition data. Though administrative data can show the number of successful Medicaid renewals and coverage terminations along with transitions to Marketplace coverage, they cannot provide information on transitions to other sources of coverage, such as employer-sponsored insurance or provide an estimate of changing rates of uninsured individuals.
As states continue the process of redetermining beneficiaries’ Medicaid eligibility, this resource will help track transitions in coverage. Specifically, it will present rates of primary source of health insurance coverage by type (Employer/Military, Direct Purchase, Medicaid/CHIP) and rates of no insurance as they are observed in the HPS. Estimates will be presented at the state and national level by selected individual and geographic characteristics. The survey does not include children, so the analysis is limited to adults 18 and older.
This blog will be updated on a monthly basis as new HPS data are released and compare the latest monthly coverage estimates (reference above in the subtitle) to estimates from March 2023, the last month before the unwinding began.
Highlighted Findings
Limited to statistically significant changes at the 95% confidence level.
-
Rates of Medicaid as a primary source of coverage decreased among Hispanic adults and adults with 2023 household incomes of $25,000 - $34,999, and in the states of Georgia and Montana. Minnesota, Missouri, and Tennessee saw increases in the rate of Medicaid as a primary source of coverage.
-
Other than changes in Medicaid as a primary source of coverage, very few statistically significant changes in insurance coverage were seen in this cycle of the Household Pulse Survey. Other than the following changes, insurance coverage rates remained mostly unchanged:
-
The rate of any Medicaid coverage decreased among adults with 2023 household incomes of $50,000 - $74,999
-
The uninsurance rate increased among Non-Hispanic White adults
-
The rate of ESI coverage increased among adults with 2023 household incomes of $100,000+
-
Select a coverage type from the orange box on the right in the dashboard below to filter the visualizations.
Methods and Data
This analysis uses public use microdata from the Household Pulse Survey (HPS), a monthly, nationally representative, quick-turnaround survey that collects data on topics including household demographics, education, employment, food sufficiency, financial spending, housing security, and physical and mental health, in addition to current health insurance coverage.
The survey has a typical monthly sample size of 60,000 to 80,000 U.S. adults and is designed to produce state-level (and a select number of metropolitan-level) estimates of the civilian noninstitutionalized adult population. The survey does not include children (those age 17 or younger).
As of January 2024, data is collected for approximately four weeks each month from adults age 18 or older via a short, online survey and is released on a monthly basis. Prior to this, data was collected for approximately two weeks each month and released on a monthly basis. Readers should keep in mind that the HPS emphasis on producing near-real-time data comes with the tradeoff of lower levels of data quality compared with “gold standard” surveys such as the American Community Survey (ACS).
These data quality issues include very low response rates (e.g., 6.7% response rate in the March 2023 survey), underrepresentation of harder-to-reach groups (e.g., adults with lower levels of education, young adults), a lack of editing and imputation for most variables, and likely some degree of nonresponse bias. For these reasons, HPS estimates should be treated with a greater degree of caution than estimates from other federal surveys.
Further, like other surveys, the HPS relies on respondents’ self-reporting their coverage, which is often associated with known biases such as the Medicaid Undercount and reflects respondents’ (sometimes imperfect) knowledge of their own coverage rather than the reality reflected in administrative data sources.
The HPS’ health insurance coverage measure is similar to that used in the ACS and asks respondents: “Are you currently covered by any of the following types of health insurance or health coverage plans?” Respondents are allowed to select “Yes” or “No” from among the following coverage types:
1. “Insurance through a current or former employer or union (through yourself or another family member)”;
2. “Insurance purchased directly from an insurance company, including marketplace coverage (through yourself or another family member)”;
3. “Medicare, for people 65 and older, or people with certain disabilities”;
4. “Medicaid, Medical Assistance, or any kind of government-assistance plan for those with low incomes or a disability”;
5. “TRICARE or other military health care”;
6. “VA (including those who have ever used or enrolled for VA health care)”;
7. “Indian Health Service”; or
8. “Other”
The response options for employer coverage [1], TRICARE [5], and VA [6] were combined into one Employer/Military coverage category, and respondents were considered uninsured if they didn’t affirmatively report any coverage under options 1-6.
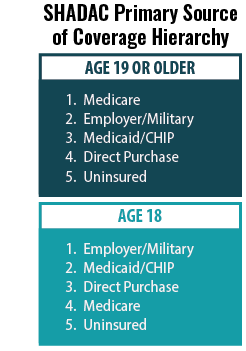 SHADAC’s primary source of coverage hierarchy was applied to determine which payer was likely primary when a respondent reported multiple sources of coverage (see SHADAC brief for more information).
For example, the hierarchy would classify a respondent reporting both Medicaid/CHIP coverage and Employer/Military coverage as having Employer/Military as a primary source of coverage, as Employer coverage typically acts as the primary payer for individuals with Employer and Medicaid coverage.
Estimates with a relative standard error (standard error divided by the percentage estimate) of 30% or greater, based on an unweighted denominator count of less than 50, based on an unweighted numerator count of less than five, or with a weighted estimate of exactly 0% or 100% were considered statistically unreliable and were suppressed.
Two-sided t-tests (95% confidence level) were used to assess statistically significant differences between the most recent data month and the baseline month (i.e., March). A lack of statistically significant difference does not affirmatively establish that there was no significant difference but rather that the data presented here are not sufficient to show a significant difference.
Blog & News
2023 NHIS Early Release: Estimates from Quarter 3 (July to September) Hold Steady
April 01, 2024:The National Center for Health Statistics (NCHS) has released quarterly estimates of health insurance coverage beginning in July 2022 through September 2023 from the National Health Interview Survey (NHIS) as part of the NHIS Early Release Program. Each quarter covers a three-month span, and this blog specifically looks at survey data from the most recent quarter (Q3 - July to September 2023) and notes any differences compared to the same time period in 2022.
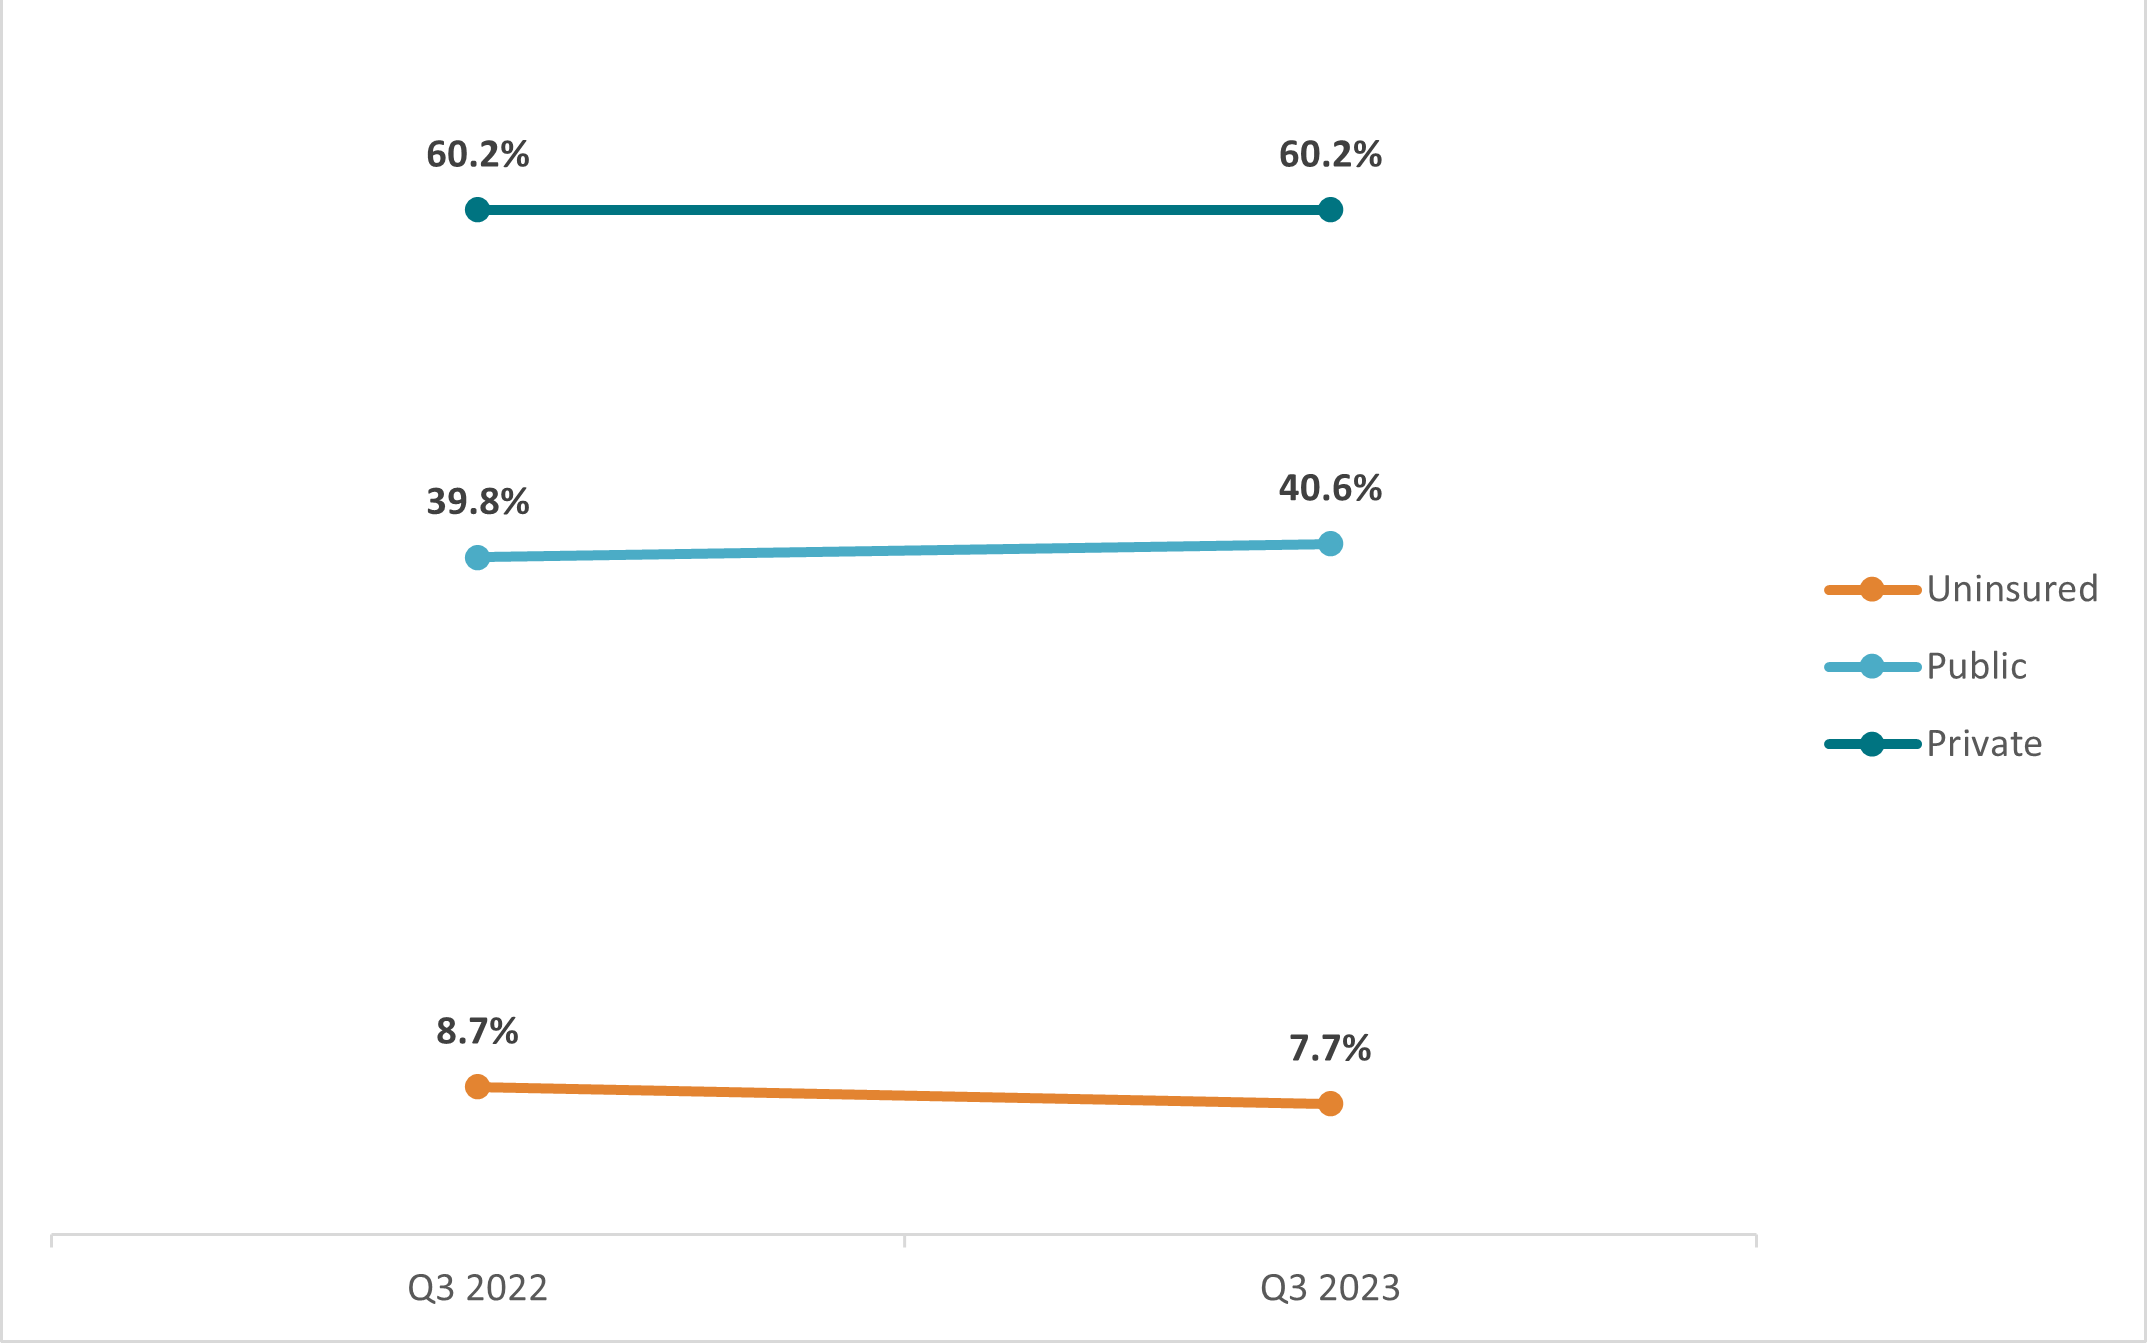
Between Q3 of 2022 and Q3 of 2023, rates of uninsurance, public coverage, and private coverage for adults (age 18-64) remained mostly unchanged. There was a small increase in the rate of public coverage for all ages and a small decrease in the rate of uninsurance overall, but these changes were not statistically significant.
Figure 1: Health Insurance Coverage Rates by Type (Adults Age 18-64), Q3 2022 vs. Q3 2023
[1] Centers for Medicare & Medicaid Services (CMS). (2023, December 18). Medicaid and CHIP Enrollment: Child and Youth Data Snapshot. https://www.medicaid.gov/sites/default/files/2023-12/medicaid-unwinding-child-data-snapshot.pdf
Blog & News
State-Based Marketplace Transition Data During the Unwinding (Cross-Post)
January 11, 2024:
 The following content is cross-posted from State Health & Value Strategies. Authors: Elizabeth Lukanen, Emily Zylla, and Lindsey Theis, SHADAC
This expert perspective (EP) will be updated by SHADAC experts as additional dashboards/reports go live. Please visit the State Health & Values Strategies webpage for the most recent version of this EP.
Original publication date: August 16, 2023. Updated: January 11, 2024.
As the unwinding of the Medicaid continuous coverage requirement progresses, SHVS is closely monitoring state reporting on the impacts of redeterminations and disenrollments. There is intense interest in data that monitors transitions between Medicaid and Marketplace coverage and, more importantly, the outcomes of those transitions. (Virginia, which would be the 19th State-Based Marketplace, launched on November 1, 2023. Virginia is not included in the total number of SBMs since it was not operating as an SBM from the beginning of the unwinding.)
The Centers for Medicare & Medicaid Services (CMS) continues to release required state data reporting metrics. In December, CMS released a new batch of data which included information on Marketplace enrollment transition data as of September 2023. CMS also continued to point to the increase in Marketplace enrollment (an increase of 1.5 million people between March and September 2023) as a signal of strong transition rates. CMS continues to report slightly different data for states that use HealthCare.gov compared to SBMs. And among SBMs, for states with an integrated system versus those who transfer accounts between Medicaid and the Marketplace. Broadly, these data include:
- Consumers who were transferred to or applied for Marketplace coverage.
- Consumers who were eligible for a QHP or Basic Health Plan (BHP) coverage (disaggregated by those eligible for financial assistance).
- Consumers with a QHP selection or BHP enrollment.
In all cases, CMS provides both counts and percentages. Among SBM states without an integrated system, CMS provides two percentage calculations – one where the denominator is applications and one where the denominator is account transfers. This distinction is important, because using the much larger account transfers number as a denominator makes the successful rate of transitions to QHP coverage seem much smaller. While the presentation of the CMS data is clear and the availability of counts and percentages is useful, it could leave room for misinterpreting the denominator.
Data reporting and interpretation have been complicated by several factors causing delays in renewal processing and changes to states’ timelines. First, the announcement from CMS on August 30, 2023 that 29 states and the District of Columbia had been making ex parte renewal determinations on a household, rather than an individual level, as regulations require. This included 16 of the 18 SBMs (California and Rhode Island were in compliance). This caused some states to pause procedural terminations, reinstate coverage, and/or implement temporary extensions for renewal. Second, CMS offered states the option of delaying procedural disenrollments while they conduct targeted renewal outreach. To date, 15 states have opted to take advantage of this flexibility.
Given the ongoing data concerns and cautions regarding state comparisons, differences in how states are managing changes to ex parte renewals and potential confusion regarding the use of different denominators, it is more important than ever for SBMs to release their own data.
SHADAC will continue to update this expert perspective as more states publish their unwinding data
State-Based Marketplace Reporting Marketplace Transition Outcome Data
Note: In some cases, SBMs publish Marketplace transition outcome data in administrative documents (e.g., board meeting minutes and legislative reports). Because these data are more difficult to access, they are not represented in the map above.
Variation in State Reporting
To date, 12 of the 18 SBMs that use their own eligibility platform are reporting outcomes for individuals who exited Medicaid and were transitioned to the Marketplace. While most of these states continue to update their data frequently, three states haven’t released updated data since October 2023. In summary:
- Seven states are reporting whether individuals were eligible for a QHP.
- 11 states are reporting whether individuals selected a plan.
- Five states are reporting enrollment and/or eligibility broken down by whether the individual received financial assistance (e.g., advance premium tax credit or cost-sharing reduction payments).
- Three states are reporting on the demographics of people transitioning from Medicaid to Marketplace coverage.
- One state, Idaho, reports having completed its redeterminations.
Select Data Highlights
In addition to general information on transition outcomes, most of the states reporting outcome measures are providing additional information of interest, though this detail differs by state. Select data highlights are provided on the SHVS Expert Perspective .
Blog & News
State Dashboards to Monitor the Unwinding of the Medicaid Continuous Coverage Requirement (Cross-Post)
January 11, 2024:
The following content is cross-posted from State Health & Value Strategies.
Authors: Elizabeth Lukanen, Emily Zylla, and Lindsey Theis, SHADAC
This expert perspective (EP) will be updated by SHADAC experts as additional dashboards/reports go live. Please visit the State Health & Values Strategies webpage for the most recent version of this EP.
Original publication date: March 16, 2023. Updated January 11, 2024
As the unwinding of the Medicaid continuous coverage requirement continues, both states and the federal government are tracking and monitoring the impacts of the resumption of eligibility redeterminations and disenrollments. The Centers for Medicare & Medicaid Services (CMS) continues to release monthly batches of required state data reporting metrics. However, given the time-lags and caveats of the CMS data, many states have decided to also publish their own state data dashboards. On December 18, 2023 CMS released an informational bulletin that, for the first time, officially encouraged states to supplement their federal reporting with their own state-specific data analysis, as well as to follow best practices of reporting data broken down by eligibility group and other demographic characteristics (e.g., age, race, ethnicity, language).
Releasing state-data via a dashboard or some other format allows states to follow other specific best practices, including the ability to provide additional detail about definitions, timeframes, and state context that are important for communicating the unique and specific circumstances that states are experiencing during unwinding. Colorado’s state dashboard, for example, highlights the state’s lower unemployment rate and provides context around the state’s reconsideration period in order to help users understand the CMS data reports. Several states are also using state data and insurance dashboards to report how many individuals have been reinstated in Medicaid after a termination (see the SHVS expert perspective on States’ Reporting of Medicaid Unwinding Reinstatement Data), thus telling a more complete story about what happens to individuals after they are disenrolled.
States Publicly Posting Unwinding Data
To date, 47 states including the District of Columbia (D.C.) have publicly published their own unwinding data in some format (this does not include states with pre-existing enrollment dashboards that don’t specifically identify unwinding cohorts). In most cases, state Medicaid departments are releasing those data, although some State-Based Marketplaces (SBMs) are also publishing unwinding data (see the SHVS expert perspective on SBM Marketplace Transition Data During the Unwinding). Of the 47 states currently reporting data:
- 24 release state unwinding data online in either an interactive dashboard or static pdf format.
- Three states only release copies of their required CMS Monthly Unwinding Data
- 20 states release both state data and their CMS Monthly Unwinding Data reports.
In some cases, states are publishing unwinding information in an ad-hoc way—such as by a press release. Because these data are not being systematically reported, they are not represented in the map above.
As unwinding has progressed, the number of new states reporting unwinding data has slowed significantly and states are updating their data less frequently. Fifteen states have not updated their state unwinding data reports since October. Arkansas and Idaho report to have completed all redeterminations and are no longer reporting through their unwinding dashboards. Iowa, which was one of the first states to publish a state unwinding dashboard, has removed renewal data from its “Medicaid and Covid Unwind Dashboard.” Both Arkansas and Iowa, however, do continue to make monthly reports to CMS publicly available.
The public release of unwinding data has proven to be a valuable tool in understanding who is losing Medicaid coverage and why. States and advocates have successfully used the data to both monitor outcomes and adjust strategies. While CMS previously indicated it would continue reporting unwinding data through June 2024, CMS’ December informational bulletin noted that states that are not meeting unwinding deadlines or experiencing other compliance issues may be required to provide additional data and/or report information more frequently. Therefore, we encourage all states to continue to make detailed disenrollment, renewal, and call center data (in addition to the enrollment data most states already report) available publicly on an ongoing basis.
SHADAC will continue to update this expert perspective as states update their unwinding data.
Variation in States’ Reporting of Indicators
There is a wide variation in the indicators that states are reporting on their state data dashboards and reports. Of the 47 states reporting publicly, most are now reporting renewal and termination data. Some states are also reporting other interesting indicators such as:
- Reasons for procedural denials (see Colorado example below).
- Number of cases terminated that are re-enrolled or reinstated in Medicaid (see Massachusetts example below).
- Qualitative data from individuals about reasons why they did not renew Medicaid (see New Hampshire example below).
- Enrollment in CHIP (see Utah example below).
It’s important to note that states use different terminology, definitions, population denominators, and timeframes on their dashboards making it difficult to compare one state’s data to another. In some instances, the data displayed on state dashboards also varies from what states include in their monthly reports to CMS (see Georgetown’s State Unwinding Renewal Data Tracker for a summary of states’ monthly CMS reports).
Another cause of variation in the types of indicators reported across states is that states began disenrolling people from Medicaid in different months. For example, Arkansas resumed eligibility determinations in April 2023, and as of October 9th, the state indicated that it had fully completed its statutorily required six-month unwinding process. In contrast, Oregon started initiating procedural terminations in October and plans to take 10 months to complete eligibility redeterminations. Data reporting and interpretation across states is further complicated by the announcement from CMS on August 30, 2023 that 29 states and D.C. had been making ex parte renewal determinations on a household, rather than an individual level as regulations require. This caused some states to pause procedural terminations, reinstate coverage and/or implement temporary extensions for renewal.
Unwinding Indicators & Disaggregated Data Reported by States
Few states are reporting disaggregated data on their dashboards. The most common breakdowns that states are providing are by age and geography (typically by county). Although CMS only requires states to report data by modified adjusted gross income (MAGI) and non-disability applications versus disability applications, additional data breakdowns by age, race, ethnicity, and program type can elucidate important trends about the disproportionate impact of unwinding on groups that have been economically or socially marginalized. (See the state dashboards below for examples of disaggregated data reporting).
Visit the SHVS Expert perspective to view examples of state unwinding / insurance dashboards in the following states: Arizona, Colorado, Indiana, Massachusetts, Minnesota, New Hampshire, Oregon, Utah, and Washington.
Blog & News
States Reporting of Medicaid Unwinding Reinstatement Data (SHVS EP Cross-Post)
November 16, 2023:
.
The following content is cross-posted from State Health & Value Strategies.
Authors: Emily Zylla and Elizabeth Lukanen, SHADAC
States, the federal government, advocates, and the media have all been closely tracking and monitoring the impacts of eligibility redeterminations during the unwinding of the Medicaid continuous coverage requirement. While there has been a strong focus on disenrollment data, recently, several states have also voluntarily begun reporting Medicaid reinstatement (also sometimes referred to as “re-enrollment” or “re-opening”) data. Medicaid and Children’s Health Insurance Program (CHIP) reinstatement data (especially when paired with enrollment data) allows states to tell a more complete story about what happens to individuals after they are disenrolled.
Individuals can be reinstated in Medicaid or CHIP for a variety of reasons. Recently, the Centers for Medicare & Medicaid Services (CMS) directed 29 states and Washington D.C. who self-identified as conducting ex parte renewal processes at the household level, rather than at the individual level, to reinstate coverage for at least 500,000 individuals whose coverage was terminated inappropriately.[1] Individuals may also have their coverage reinstated as a result of fair hearing cases, or as a result of re-enrolling in Medicaid or CHIP within the 90-day reconsideration period.[2]
This expert perspective reviews current state reporting of Medicaid reinstatement data and provides recommendations for the reporting of such data. To facilitate transparency, states are encouraged to report data for at least 90-days, disaggregate data by race, ethnicity, age and other population characteristics and provide additional information to contextualize reinstatement data.
States’ Reporting of Medicaid Reinstatement Data
SHADAC’s review of public unwinding data identified nine states that report some type of Medicaid reinstatement data:[3]
The federal government does not require states to report reinstatement data as part of their Monthly Unwinding Data; and, while CMS could presumably leverage Transformed Medicaid Statistical Information System (T-MSIS) data to track whether Medicaid or CHIP members who are disenrolled are later reinstated, the availability of such data is delayed. Without a standardized national approach, each of the nine states are reporting a measure with a slightly different definition. Specific differences include the population being counted within the “reinstatement” category and the timeframe being reported and tracked (Table 1).
Table 1. States Reporting Medicaid Unwinding Reinstatement Data*
| State | Reinstatement Measure Being Reported | Timeframe |
|---|---|---|
| Arizona | Count of individuals who have completed their renewal within the 90-day reconsideration period after a procedural discontinuance. | Within the 90-day reconsideration period |
| Connecticut | Status of individuals who were disenrolled for 30/60/90 days. | 30/60/90 days later |
| Kentucky | Number of individuals reinstated (no further definition provided). | Not defined |
| Massachusetts | Members who have departed and regained MassHealth benefits. | 0-3; 4-6; 7-12 months |
| New Hampshire | Number of protected individuals who closed and subsequently re-opened by the timeframe during which they returned to coverage (e.g., within 30 days of closing). | 0-30 days; 31-60 days; 61-90 days |
| New Jersey | Members [Modified Adjusted Gross Income (MAGI) and Aged, Blind, or Disabled (ABD)] who were due for renewal in June and July respectively; and who were reinstated in NJ FamilyCare. Reasons for reinstatements include responding to renewal during the 90-day reconsideration period, automatic renewal following a previous termination, or reinstatement due to a pending or finalized fair hearing case. | June & July cohorts |
| New York | Individuals who were reinstated in accordance with the CMS Household Ex Parte (administrative) Renewal Guidance. | June & July cohort reinstatements |
| Pennsylvania | Individuals whose cases were closed with Medicaid during the 12-month unwinding period and who have since had their Medicaid re-opened within four months of closing. | 4 months |
| Virginia | Number of individuals who were closed for procedural reasons who were reinstated in the first, second or third month. | 1, 2, & 3 months |
| Source: SHADAC review of states’ unwinding dashboard metrics. Note the definitions listed in the table are the definitions/wording provided by states. |
||
Variation in Reinstatement Measures
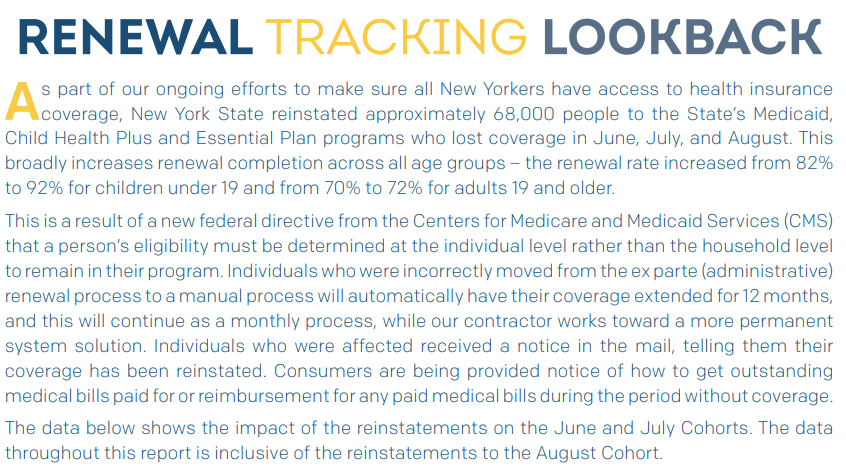
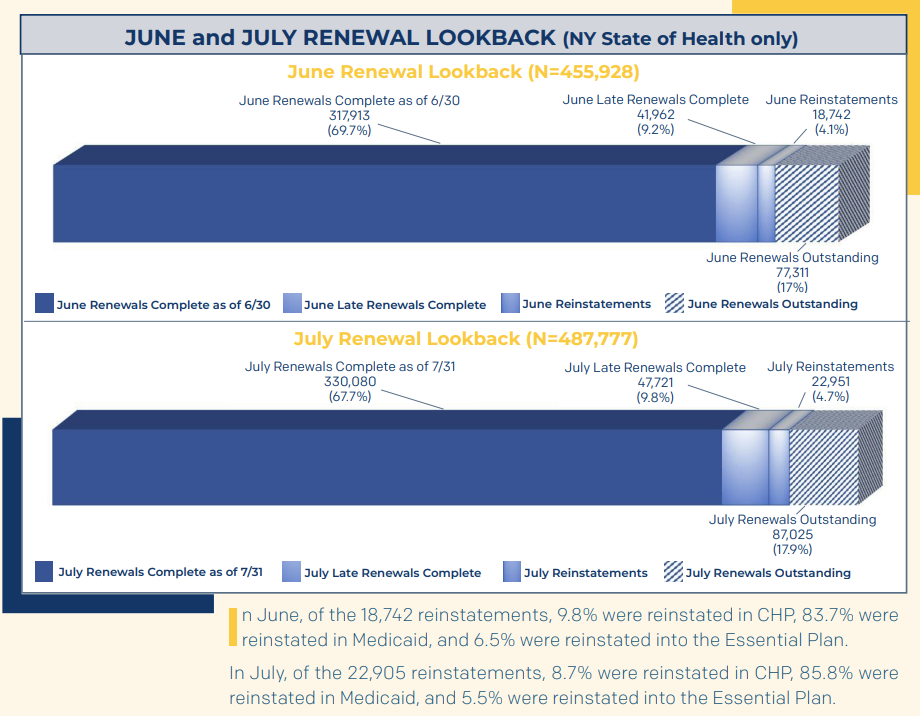
As seen above, there is wide variation in the definitions, timeframes, and amount of detail provided in the reinstatement data that states are reporting. For example, New York only reports the number of individuals reinstated in accordance with the CMS Ex Parte Renewal Guidance (Figure 1).
Figure 1. New York Medicaid Unwinding Data – Reinstatements
In contrast, Massachusetts reports the number of members who have departed and regained MassHealth benefits for any reason over the past 12 months (not just those reinstated due to CMS guidance) and for every month since the unwinding began (Figure 2). (Note, however, that Massachusetts does not provide a breakdown by the specific reinstatement reason.)
Figure 2. Massachusetts Unwinding Data – Re-Openings
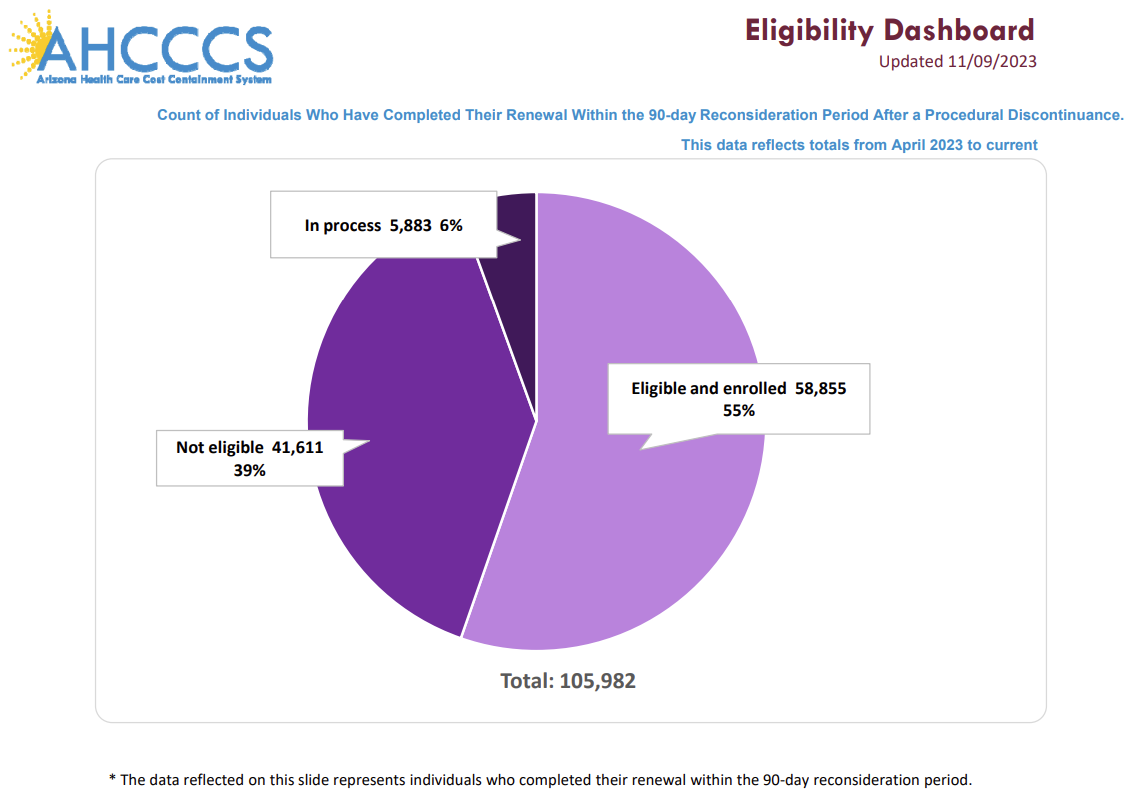
Arizona reports a cumulative total of reinstatements for those individuals who were procedurally disenrolled since the unwinding began in April (Figure 3).
Figure 3. Arizona Unwinding Data – Renewals After a Procedural Discontinuance
Best Practices for Reporting Reinstatement Data
Although it is not required, reporting Medicaid and CHIP reinstatement data publicly promotes transparency. Like the reporting of closure reason or transition outcome data (i.e., whether individuals who were disenrolled transitioned to coverage through a Marketplace plan or an employer-sponsored plan), reporting Medicaid reinstatement data (especially when paired with enrollment data) allows states to give the full picture about what happens to individuals after they are disenrolled. Being more transparent about who is coming back into Medicaid can help provide additional context about the impact of unwinding processes on populations.
Tracking and reporting Medicaid and CHIP reinstatement data over a 90-day period at a minimum is highly recommended. States that have reinstatement periods longer than 90 days can consider tracking and reporting data over both a 90-day period and the longer, state-elected period. If possible, states should also provide a breakdown of the type of reinstatements. For example, the number of individuals who were procedurally disenrolled and reinstated, the number of individuals who lost coverage due to an erroneous ex parte redetermination and were reinstated in accordance with the CMS Ex Parte Renewal Guidance, etc. While these standards are best, state reporting systems may have different functionality.
For example, some states are counting reinstatements for individuals who were terminated for procedural reasons as new applications, making those cases more difficult to track. Regardless of system capacity, states are encouraged to report at least some of the number of people who are reinstated, using whatever definition is feasible for ongoing reporting. Even limited reporting can be paired with state context to help shed light on the larger impact of unwinding.
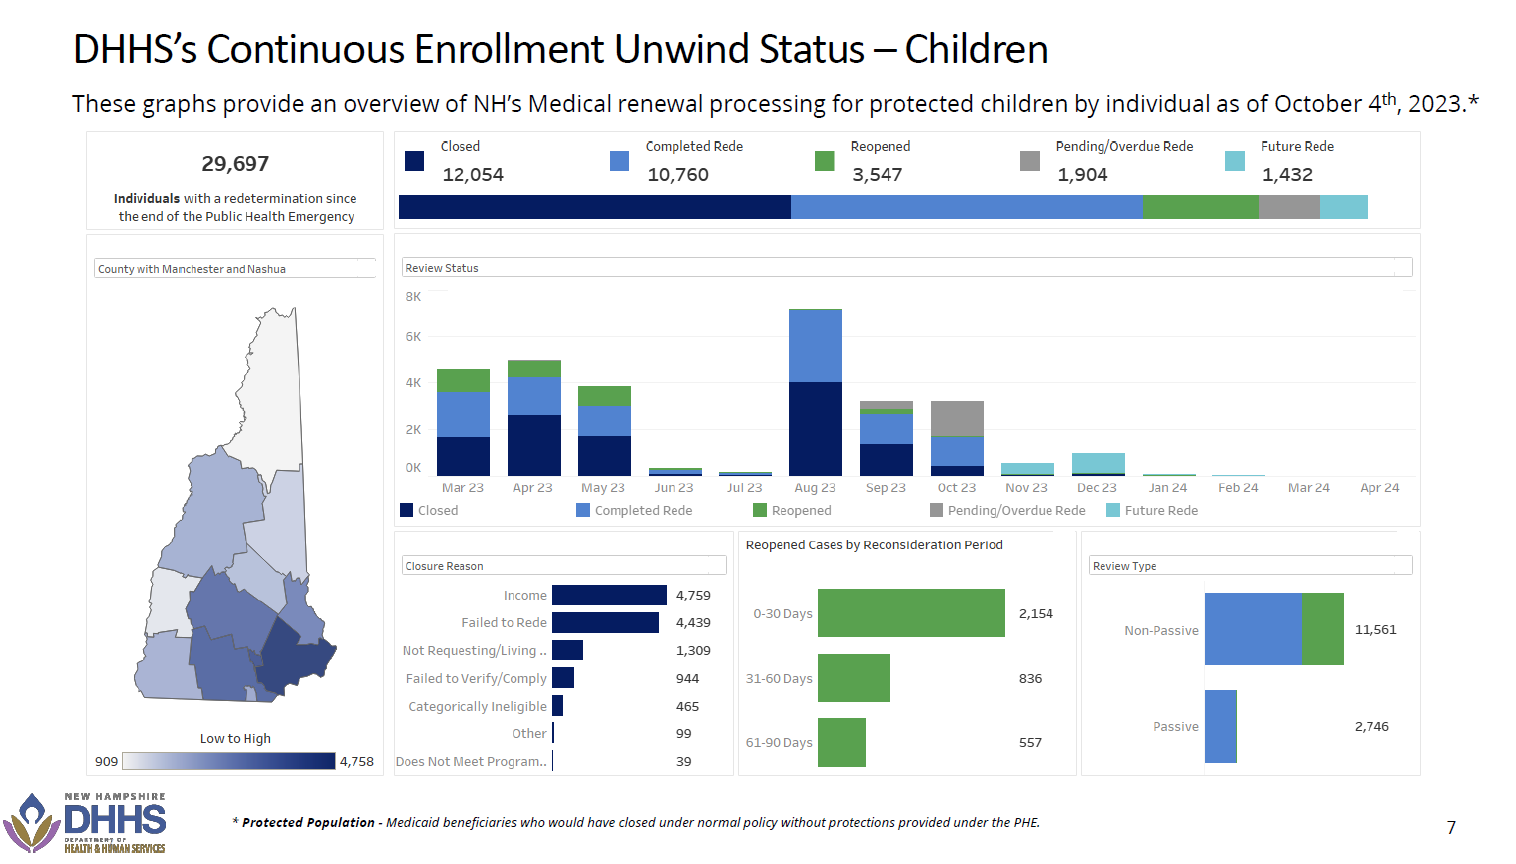
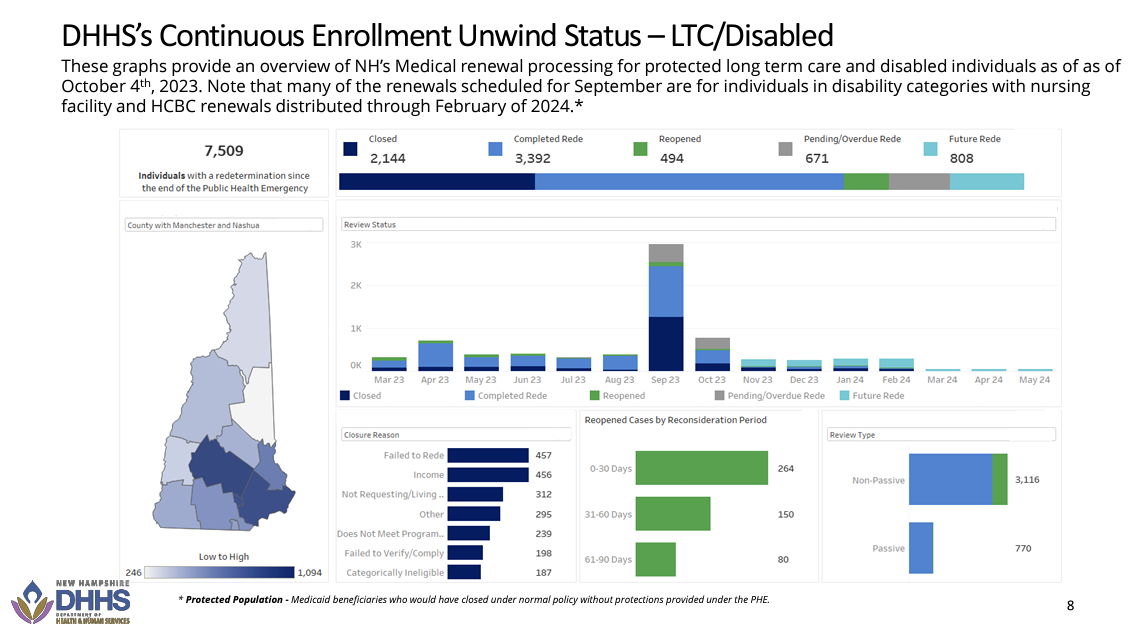
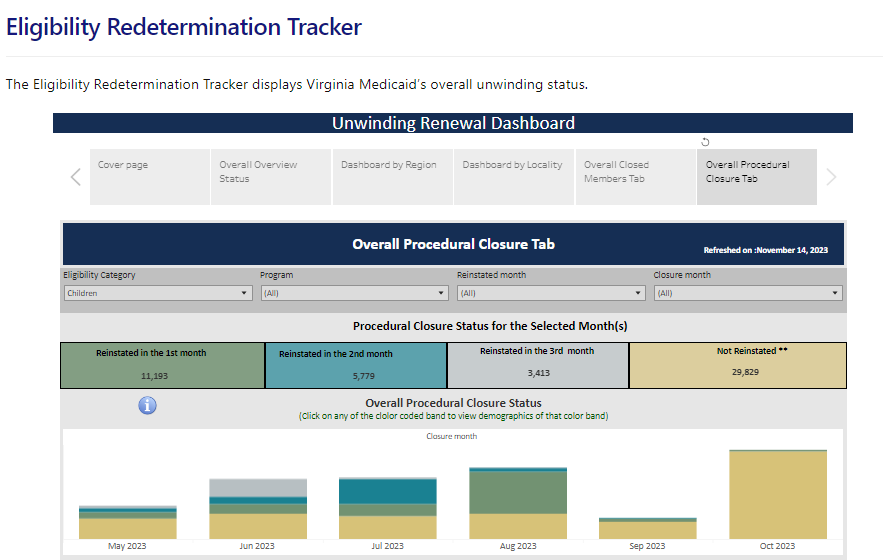
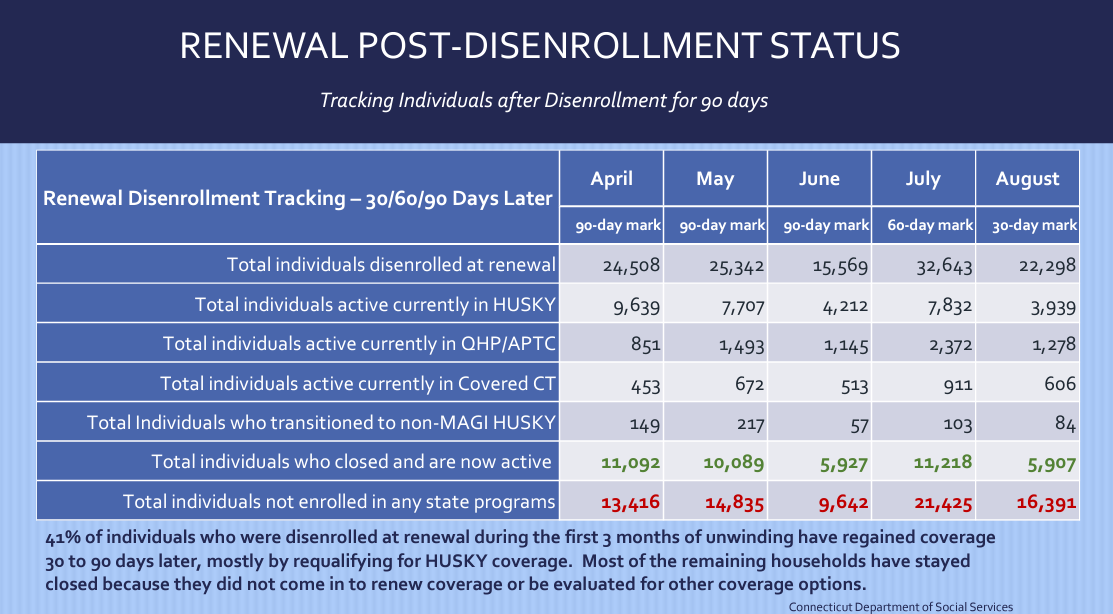
Reporting reinstatements by enrollee characteristics, such as age, race or ethnicity, or on the basis of eligibility (i.e., MAGI, CHIP, and non-MAGI if applicable) might also help provide insights into where barriers might exist, enabling states to target outreach. For example, New Hampshire reports the number of Medicaid cases that are reopened and provides breakdowns by both age (adults and children) and for individuals in long-term care (LTC) and disability categories (Figure 4). Virginia also reports reinstatements for individuals with a procedural closure that can be broken down by eligibility category (e.g., individuals who are blind or disabled, children, enrolled due to pregnancy, etc.) and by program type (i.e. fee-for-service versus managed care) (Figure 5). Connecticut provides detailed breakdowns showing where individuals who have been disenrolled have regained coverage and by what type (i.e., whether they have enrolled in a qualified health plan with advance premium tax credits, transitioned to a non-MAGI Medicaid program, or regained active Medicaid coverage) (Figure 6).
Figure 4. New Hampshire Unwinding Reopening Data – Children and Individuals who Are Disabled or in Long-Term Care
Figure 5. Virginia Eligibility Redetermination Tracker – Procedural Closure Tab
Figure 6. Connecticut Unwinding Data – Renewal Post-Disenrollment Tracking
Finally, states are strongly encouraged to include data labels, detailed definitions, and context for reinstatement data. Describe population numerators and denominators if relevant. And, if the format allows, link to information that can help contextualize the data, such as overall application or enrollment data or comparisons to a previous time period that might help a user understand the historical context of the data.
Conclusion
While Medicaid churn remains a challenge, states are working hard to maintain Medicaid enrollment for eligible individuals, and they should present data that provides a more complete picture of their efforts and impacts on coverage. Renewals and disenrollments remain important measures of successful unwinding, but there is a growing need for states to provide more information to tell the whole story. To convey a more nuanced narrative, states should provide information on CHIP and Medicaid reinstatement in whatever form is most feasible. This approach ensures that states effectively keep the public, policymakers, and advocates informed of their progress.
[1] See SHVS’ expert perspective, CMS Guidance on Conducting Eligibility Redeterminations at the Individual Level, for additional information.
[2] During the reconsideration period, states must reconsider eligibility without requiring the individual to fill out a new application if the renewal form or documentation is returned within 90 days after the date of the MAGI enrollee or CHIP enrollee’s termination. States have the option to (1) adopt a reconsideration period of longer than 90 days for MAGI enrollees, and (2) provide a 90-day (or longer) reconsideration period for individuals enrolled on a non-MAGI basis.
[3] No states reporting separate CHIP reinstatement data were identified—only New Hampshire and Virginia report reinstatement data by age.


