
Blog & News
Hest, Robert
Lanigan, Lindsey
Stewart, Andrea


CPS ASEC: 2022 National Health Insurance Coverage Estimates Show Falling Rates of Uninsurance and Direct-Purchase Coverage (Infographic)
September 12, 2023:
Related Releases and Materials
|
The U.S. Census Bureau has released an initial report detailing the state of health insurance coverage in the United States for 2022.
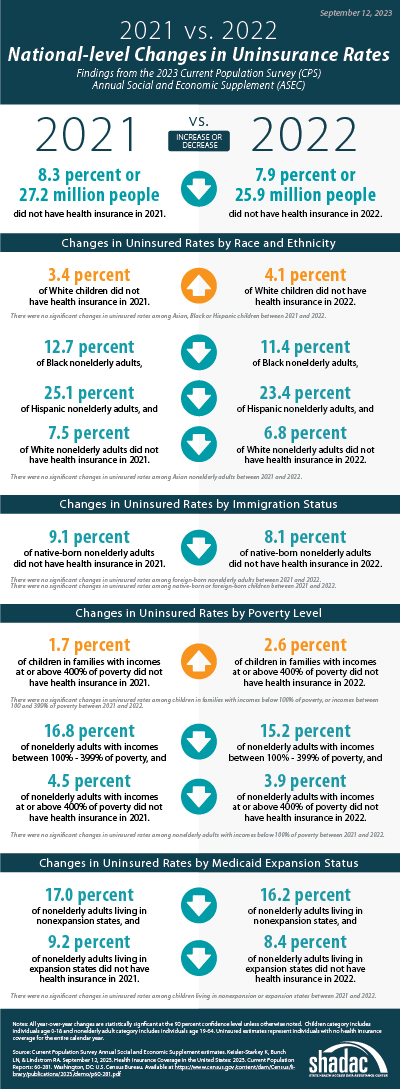
Drawing on data from the Current Population Survey Annual Social and Economic Supplement (CPS ASEC), the report highlights good news overall as the percentage of the population without health insurance coverage at any point in 2022 fell to 7.9% from 8.3% in 2021—a decrease of 0.4 percentage points or approximately 1.3 million people (25.9 million in 2022 vs. 27.2 million in 2021).
The following blog post explores changes in national-level coverage rates by demographic characteristics - such as age, employment, race and ethnicity, immigration status, poverty status, and Medicaid expansion status - for nonelderly adults (age 19-64) and for children (age 0-18). While neither group saw an overall significant change in uninsured rates, both experienced shifts across demographic subgroups.
Additionally of note, though not within the scope of this blog to explore further, elderly adults (age 65+) saw a significant increase in Medicare rates, which the Census Bureau notes is due to a larger elderly population overall, not a larger share of those adults having Medicare. The continued growth of an aging population will continue to have ramifications for a number of health-related measures, including health insurance coverage rates, and bears following in future research.
Changes in Uninsurance by Age (Nonelderly Adults age 19-64, and Children age 0-18) and Characteristics
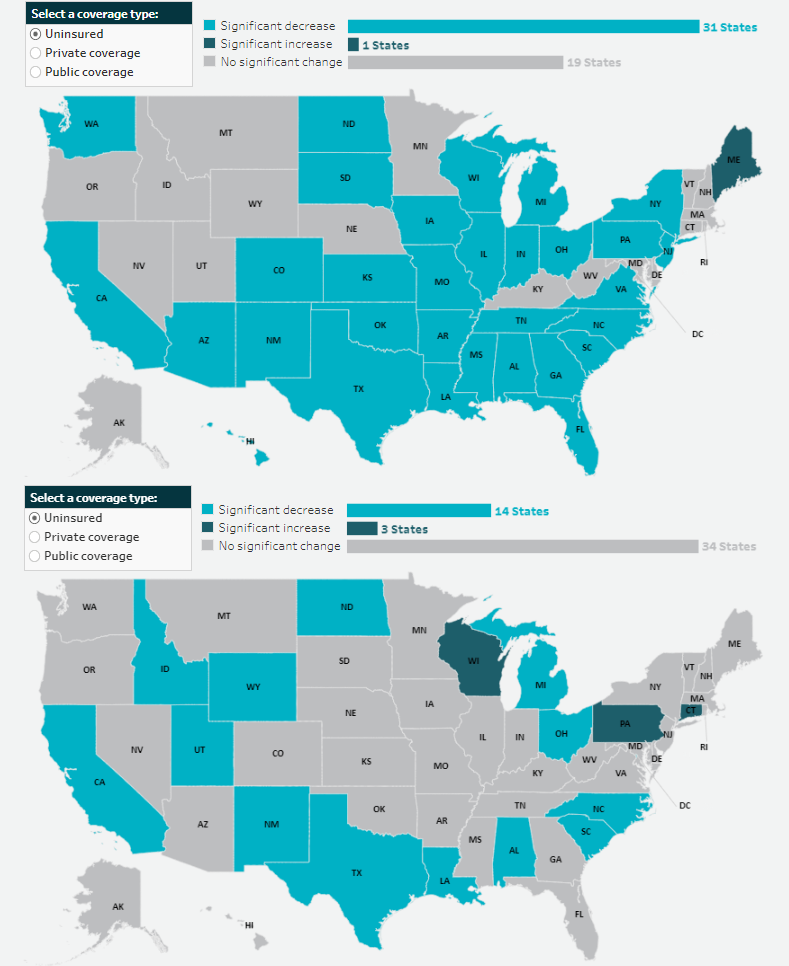
 Among nonelderly adults, the overall rate of uninsurance fell to 10.8% in 2022, a 0.8 percentage point (PP) decrease from 2021.
Comparatively, the uninsured rate among children remained statistically unchanged from 2021 (5.0%) at 5.4% in 2022.
Race and ethnicity
In 2022, rates of uninsurance fell among nonelderly Black, Hispanic, and White adults, declining to 11.4%, 23.4%, and 6.8% (versus 12.7%, 25.1%, and 7.5%), respectively. Rates of uninsurance among nonelderly Asian adults were unchanged at 7.4%.
Similarly, while uninsurance rates remained stable for children of several racial and ethnic groups in 2022 - 4.1% for Asian children, 4.7% for Black children, and 8.6% for Hispanic children - the rate of uninsurance rose significantly among White children, increasing to 4.1% in 2022 from 3.4% in 2021.
Immigration status
The rate of uninsurance among native-born nonelderly adults fell to 8.2% in 2022 from 9.1% in 2021, while the uninsurance rate among foreign-born adults remained statistically unchanged at 22.1% in 2022 compared to 22.8% in 2021.
Rates of uninsurance were unchanged among native-born children at 4.7% in 2022 and among foreign-born children at 20.6% in 2022.
Poverty level
When examining coverage by poverty level, rates of uninsurance were unchanged at 24.2% among nonelderly adults with incomes below 100% poverty, decreased to 15.2% from 16.8% for those between 100%-399% poverty, and decreased to 3.9% from 4.5% for those living at or above 400% poverty.
In 2022, rates of uninsurance were unchanged for children in the two lower poverty level categories—8.9% for those in families with incomes below 100% poverty and 6.1% for those living in families with incomes between 100%-399% poverty. However, uninsured rates rose to 2.6% among children in families with incomes at or above 400% of poverty, an increase of 0.9 PP from 2021.
Medicaid expansion status
As of January 1, 2022, 38 states and the District of Columbia have chosen to act on the option provided by the Affordable Care Act (ACA) and expand Medicaid eligibility requirements, with the additions of Missouri and Oklahoma last year. Comparing rates of uninsurance by expansion and nonexpansion states revealed divergent trends for nonelderly adults and children.
In 2022, the uninsured rate fell to 8.4% in 2022 from 9.2% in 2021 for nonelderly adults living in expansion states and fell to 16.2% in 2022 from 17.0% in 2021 for those in nonexpansion states.
However, children in expansion and nonexpansion states saw no significant change in uninsured rates for 2022 compared to 2021 at 4.1% and 8.1%, respectively.
Notable Public and Private Coverage Changes
Among nonelderly adults, rates of public coverage and private coverage were unchanged at 19.1% and 72.9%, respectively. Rates of employer-based coverage increased to 63.5% in 2022 among nonelderly adults, up 0.6 PP from 2021. Rates of Medicare coverage fell to 3.6% among nonelderly adults in 2022, down from 3.8% in 2021.
By Race and Ethnicity (Total Population)
Rates of private and public coverage were statistically unchanged among Asian (72.2% and 27.8%, respectively) and Hispanic individuals (49.4% and 37.7%, respectively).
Among Black persons, the percentage with private coverage rose to 56.6% in 2022, up from 55.1% in 2021, and the percentage with public coverage fell to 41.2% in 2022, down from 42.7% in 2021.
Among White individuals, the percentage with private coverage fell to 72.3% in 2022, down from 73.2% in 2021, and the percentage with public coverage rose to 35.4% in 2022, up from 34.6% in 2021.
Immigration Status (Total Population)
Rates of private and public coverage were unchanged among the native-born population at 67.6% and 36.7%, respectively. Among the foreign-born population, the percent with private coverage was unchanged at 54.4% while the percentage with public coverage rose to 32.8% in 2022 from 31.7% in 2021.
Medicaid Expansion Status (Total Population)
In expansion states, the share with private coverage fell to 66.6% in 2022 from 67.1% in 2021 while the share with public coverage rose to 37.6% in 2022 from 36.9% in 2021. In nonexpansion states, the share of the population with private coverage and public coverage were unchanged at 63.6% and 32.9%, respectively.
Employment Status (Nonelderly Adults)
Public coverage rose among working nonelderly adults in 2022 to 12.6% from 11.8% in 2021 while the share with private coverage was stable at 80.0%. Public coverage rose among those who worked full-time year round and those who worked less than full-time, year round, rising to 8.9% and 23.5%, respectively. Private coverage was unchanged among these groups at 84.8% and 66.0%, respectively. Private and public coverage were unchanged among those who did not work, at 47.5% and 42.6%, respectively.
More on the insurance coverage changes among working-age adults can be found in a topically focused blog released today by the Census Bureau.
Notes
All changes are tested at the 90% confidence level.
All estimates come from the 2022 and 2023 Current Population Survey Annual Social and Economic Supplements, which provide data for years 2021 and 2022, respectively.
Uninsured estimates represent individuals with no health insurance coverage for the entire calendar year.
Estimates of health insurance coverage type represent individuals with that type of coverage at any point during the calendar year. Types of health insurance coverage are not mutually exclusive.
COVID-19 Public Health Emergency Impacts
Continuous Coverage Requirement
The continuous coverage requirement that prevented states from terminating individuals’ Medicaid coverage during the pandemic ended on March 31, 2023. The resumption of Medicaid eligibility redeterminations and renewals (and potential disenrollments), a process commonly referred to as the “unwinding,” began on April 1, 2023, and each state has a year to navigate a return to normal operations while also meeting reporting requirements set by CMS for publicly sharing coverage transitions and outcomes data during this time. While the health insurance estimates released by the US Census Bureau for 2022 precede the beginning of the unwinding process, the data will provide an essential baseline for understanding how health insurance coverage is distributed across the U.S. and among the states prior to the unwinding, as well as marker to measure the impacts of this seismic coverage transition as potentially millions of individuals, both adults and children, are poised to lose Medicaid and must either find another form of coverage (e.g., state-based marketplace or employer-sponsored insurance [ESI]), or risk becoming uninsured.
Several resources have been compiled by SHADAC to track the unwinding process in a variety of avenues, falling under several broader categories:
Guidance for States
- Using Surveys to Monitor Coverage Transitions During the Unwinding of the Medicaid Continuous Coverage Requirement
- Best Practices for Publicly Reporting State Unwinding Data
Health Insurance Coverage Data Tracking
- State-Based Marketplace Transition Data During the Unwinding
- State Dashboards to Monitor the Unwinding of the Medicaid Continuous Coverage Requirement
- Tracking Health Insurance Coverage During the Unwinding: Monthly Data from the Household Pulse Survey
Data Collection and Dissemination - Nonresponse Bias
While Census Bureau researchers have not cited any concerns with CPS ASEC data collection or release processes, an ongoing issue of persistently lower response rates and resultant nonresponse bias has been documented for the past few years, coinciding with the beginning of the COVID-19 pandemic. In March 2023 (the point in time that the CPS is administered), the response rate fell to its lowest point yet, at 68.9%, compared to a pre-pandemic rate of 82% (March 2019). This lower response rate particularly affects the CPS measures of income, and since 2020, the Census Bureau has been working to address the bias in higher reported earnings using new weighting methods to create adjusted income and poverty estimates. More detail on this methodology can be found in a companion blog released today by Census Bureau researchers.
Blog & News
Lukanen, Elizabeth
Planalp, Colin
Using Surveys to Monitor Coverage Transitions During the Unwinding of the Medicaid Continuous Coverage Requirement (Cross-Post)
August 8, 2023:
.
The following content is cross-posted from State Health & Value Strategies.
Authors: Elizabeth Lukanen and Colin Planalp, SHADAC, and Kevin Caudill, GMMB
The unwinding of the Medicaid continuous coverage requirement represents the largest nationwide coverage transition since the Affordable Care Act. Not surprisingly, policymakers, advocates and the media are watching coverage transitions closely and many states have released Medicaid administrative data documenting their progress. While state and federal administrative data can quantify the number of successful Medicaid renewals and coverage terminations, they typically cannot provide details on what happens to people leaving Medicaid. For instance, are people gaining employer-sponsored insurance (ESI) upon leaving Medicaid coverage, or are they becoming uninsured? Those administrative data also are limited in their ability to tell us why patterns are occurring. For instance, among people who remained eligible for Medicaid coverage, why were some successfully renewed while others were not?
Individual-level surveys of people who were enrolled in Medicaid during the continuous coverage requirement can help to answer such questions. The federal government’s Household Pulse Survey, which the U.S. Census Bureau established during the COVID-19 pandemic, serves as one key example of how surveys can fill critical data gaps to answer questions during unique circumstances. Similarly, states may consider conducting their own survey of consumers.
Motivation for Conducting a Medicaid Consumer Survey
Targeted surveys of people who have been enrolled in health coverage (referred to as “consumers” in this expert perspective), can be a relatively inexpensive and quick way for states to obtain information on coverage transitions and consumer experiences. In the context of unwinding, surveys would target Medicaid enrollees who recently went through the redetermination process. These surveys could be leveraged by officials in Medicaid or the Marketplace to:
- Better understand coverage transitions.
- Did an enrollee transition to employer-sponsored coverage, some other source of coverage, or become uninsured?
- Why did the enrollee exit Medicaid if they were still eligible?
- If they were eligible for a qualified health plan (QHP) but didn’t enroll, why?
- Gather information on what messages and message strategies resonated with consumers.
- Assess what shopping, assistance and customer service tools were used.
- Educate people on tools, resources, or coverage options available to them.
- Serve as a final nudge to consumers that they need to take action to stay covered or transition to new coverage.
- Inform future research, such as longer targeted surveys, user experience testing or consumer focus groups.
Survey Mode
Given the dynamic nature of the unwinding, surveying consumers quickly is important. For this reason, states should consider short surveys that are distributed by email or text message using a convenience sample (i.e., Medicaid disenrollees for whom the state has contact information). For the sake of administrative ease, states could work with a web survey vendor that offers a user-friendly interface and (if possible) with whom they have an existing subscription or contract.
Many web-based vendors can send surveys via email or text. When sent via email, these surveys can typically be distributed in two ways: 1) consumers are sent a generic survey—the same survey link goes to everyone on the distribution list; 2) consumers are sent a unique survey link—a unique survey link is distributed individually to everyone on the distribution list. These options entail trade-offs. A benefit of a generic link is that it can be sent using the state’s existing communication platform. This avoids the need to import consumer contact information into the survey vendor platform, which might raise privacy and other legal concerns. Alternatively, a benefit of using a unique, individualized survey link is the ability to connect survey responses to state administrative data on the respondent, notably, characteristics (e.g. income, age, race, household type, etc.). This reduces the need to collect demographic data via the survey, can result in richer demographic detail about survey respondents, and provides insights into those who did not respond to the survey.
Text or SMS surveys can also be distributed in two ways. One option is to send a “2-way” survey, where respondents text their replies to each question (best suited for a one question survey). The second option is to distribute a link to the survey which is sent to the consumer’s phone and can be opened in a mobile browser. During the unwinding, states are often focused on very short surveys. In some cases, they might ask a single question (typically focused on assessing coverage transitions) or other very brief surveys (3 to 10 questions). In some cases, states might attempt both—starting with a single question survey to assess coverage transition, followed up by a longer survey that captures information about the consumer experience. While there is wide concern that state Medicaid programs might not have up-to-date contact information for Medicaid enrollees, especially in a time-sensitive situation such as the unwinding, it is likely most practical to reach out to people using contact information already on file—often including a cell phone number or email address.
The primary benefits of web-based surveys sent via text or email are speed and cost. If a state has in-house expertise, funding, and can leverage an existing partnership (e.g., a state–university partnership) or an existing survey effort, they could also consider a more robust, mixed-methods survey that supplements a mailed survey (and online option) with interviews. For example, New Mexico recently fielded the New Mexico 2023 Office of the Superintendent of Insurance (OSI) Health Access Survey, commissioned by the New Mexico OSI and conducted by the University of New Mexico. This was a larger and sophisticated effort—a statewide survey of 1,900 adults, conducted by a survey firm in both English and Spanish using multiple modes (telephone and online). While the focus of the survey was broad, to better understand the opinions and attitudes New Mexicans have regarding health insurance, the state recognized the opportunity to use this vehicle to gain insights into unwinding. The survey found that residents were generally aware that pandemic funding for Medicaid was ending, but this awareness was lower for Latino/a, Native American, Spanish-speaking and lower-income New Mexicans, which highlighted the importance of targeted messaging and outreach.
Target Population and Timing
During the unwinding, states should focus on consumers who are scheduled to be redetermined for Medicaid. Logistically, states could consider sending the survey in waves, aligning with unwinding cohorts. If state systems allow them to target more granular groups, the state could send slightly different surveys to different groups. For example, if a state is targeting those who exited Medicaid and shopped for plans in the Marketplace, they could send slightly different questions to those who ultimately selected a plan than to those who did not select a plan.
States should also carefully consider the timing of any consumer survey as they finalize their questions. For example, questions about shopping and plan selection should happen fairly quickly, ideally within a couple of weeks of when consumers should have engaged in these activities. If a consumer can still submit redetermination paperwork or sign-up for a QHP, the questions and wording should make that clear and not imply the consumer has no option to take action. As mentioned above, given the nature of many states’ phased unwinding approach, states should consider sending surveys weekly or monthly based on renewal cohorts.
Questions of Interest
States considering consumer surveys related to the unwinding tend to be interested in a fairly narrow set of questions. They want to understand coverage transitions, specifically whether people enrolled in employer-sponsored or Marketplace coverage after leaving Medicaid, and the enrollee’s experience navigating the process. States might use these surveys to assess specific outreach methods (e.g. the impact of mailing campaigns to send people letters on colored paper). And for states with available customer service resources, they could use the survey to connect people with a customer service channel (for instance, asking respondents if they would like assistance with the application and enrollment process). By collecting demographic information along with these questions, states can also get a sense for whether there are population differences between those who successfully transitioned to another source of coverage and those who remain uninsured.
Common survey question domains include:
(A list of sample questions is included at the end)
- Current coverage/coverage transitions
- Reasons/motivations to have or not have coverage
- Experience shopping for insurance
- Establish who shopped (if this cannot be identified using administrative data)
- Outreach and assistance
- Impacts of uninsurance
- Demographics
- Did an enrollee transition to employer-sponsored
As states consider what questions to ask, they should take care to tailor their surveys to the strengths and limitations of this data collection method. Surveys are good at collecting information on people’s experience and impressions, but they are less useful for collecting specific, detailed and nuanced information (e.g. specific information about ESI cost-sharing, specific detail on what programs consumers qualified for).
Another best practice is to ask questions that only require the respondent to reflect on one concept at a time. For example, when constructing questions about the shopping process, avoid phrasing questions that conflate opinions about the shopping experience and plan choice, which could pose a challenge to respondents if they found the online interface easy to use but the plan options to be underwhelming, or vice versa.
Finally, states should consider the goals of the survey and tailor the questions to those goals. Especially in the unique circumstances of the unwinding, states may be looking for ways to make their redetermination processes more user-friendly for Medicaid in the near-term, so they can maximize the number of eligible individuals reenrolled in the program. In that case, states should prioritize questions that are likely to yield data that are actionable in the coming weeks or months, rather than years. Relatedly, states should take care in how they interpret survey data collected during the unwinding and temper their expectations for the generalizability of the survey findings into the future. Because the current circumstances are so unusual, it is possible that the experiences of Medicaid enrollees going through the redetermination process today may not resemble the experience of people going through the redetermination process in a couple of years. However, if states find these survey data useful, they could incorporate similar surveys even after the unwinding, as part of their ongoing, regular course of business.
Communications Best Practices
As states are developing survey instruments, it is important to also keep in mind the surrounding communications to potential respondents to maximize participation, reinforce validity, and mitigate against concern about scams. Below are some helpful tips that states should consider when developing communications to support consumer research. While these apply primarily to email, they can also be applied to other mediums such as text messages.
Establish your tone/voice. The tone of your subject line and email should reflect your Marketplace or Medicaid agency brand. Reinforcing your role as an official program is key. Determine where you will fall on the spectrum of conversational (e.g. “A few minutes to share your feedback?”) versus professional (e.g. “We’d appreciate your feedback to help us serve you better.”)
Personalize as much as possible. Personalizing is more than a name; it’s reflecting the experience you want feedback on. For example: “How did we do with Medicaid/Marketplace enrollment?” or “Did you have all the enrollment information you needed?”
Talk about the benefits of completing the survey. Explain up front why their participation matters. For example: “Help us make Medicaid enrollment better” or “Your feedback will make Marketplace enrollment better.” Within the body of the email itself, briefly explain how their feedback will be used and express appreciation for their time and input.
Ask a question in the subject line.
Try to keep subject lines under 50 characters. This is so participants can get the full headline on their mobile device.
States should consider these recommendations as they develop customized messaging for survey communications. These steps can help states get the most helpful information from their survey efforts. Ultimately, communications should reflect the unique goals that each state will determine for its research effort so there is no one size fits all approach.
Interpreting the Results
This type of consumer survey can be very useful to gather information on consumers’ experiences, identify areas where they are struggling with the process and which resources or outreach methods are resonating. In this case, it can also be useful for gaining some insights into coverage transitions outside of Medicaid or the Marketplace. That said, it will rely on a convenience sample, it is likely to have a low response rate and the results will not be representative of the target population as a whole. When interpreting the results, these limitations should be considered. States shouldn’t assume that survey results collected using a convenience sample during the unwinding represent everyone who experiences the Medicaid redetermination process. For example, consumers’ experiences might be different during a more typical renewal period and might be different for those who did not respond to the survey.
Agency Coordination
States considering these surveys should work closely with their legal, marketing, customer service and other relevant teams. Support and guidance from a legal team can be critical as states consider specific details about how the surveys are sent and distributed. For example, can the state send text messages to consumers and with what limitations? Can the state upload consumer contact information into survey vendor platforms for the purposes of distributing a survey? Involving the marketing and public relations team is also a good idea as they can ensure the terminology is consistent and that messages are aligned with what is being sent regarding redeterminations. And it is important to let customer service teams know when these surveys are going out, particularly if they are designed to spur final action or are directing enrollees to specific supports.
Sample Questions
A list of sample survey questions can be downloaded using the link below. The sample questions can be customized and used by states interested in conducting a consumer survey during the unwinding.
Blog & News

SHADAC's Lynn Blewett Featured on 'Hospitals in Focus' Podcast
November 01, 2023: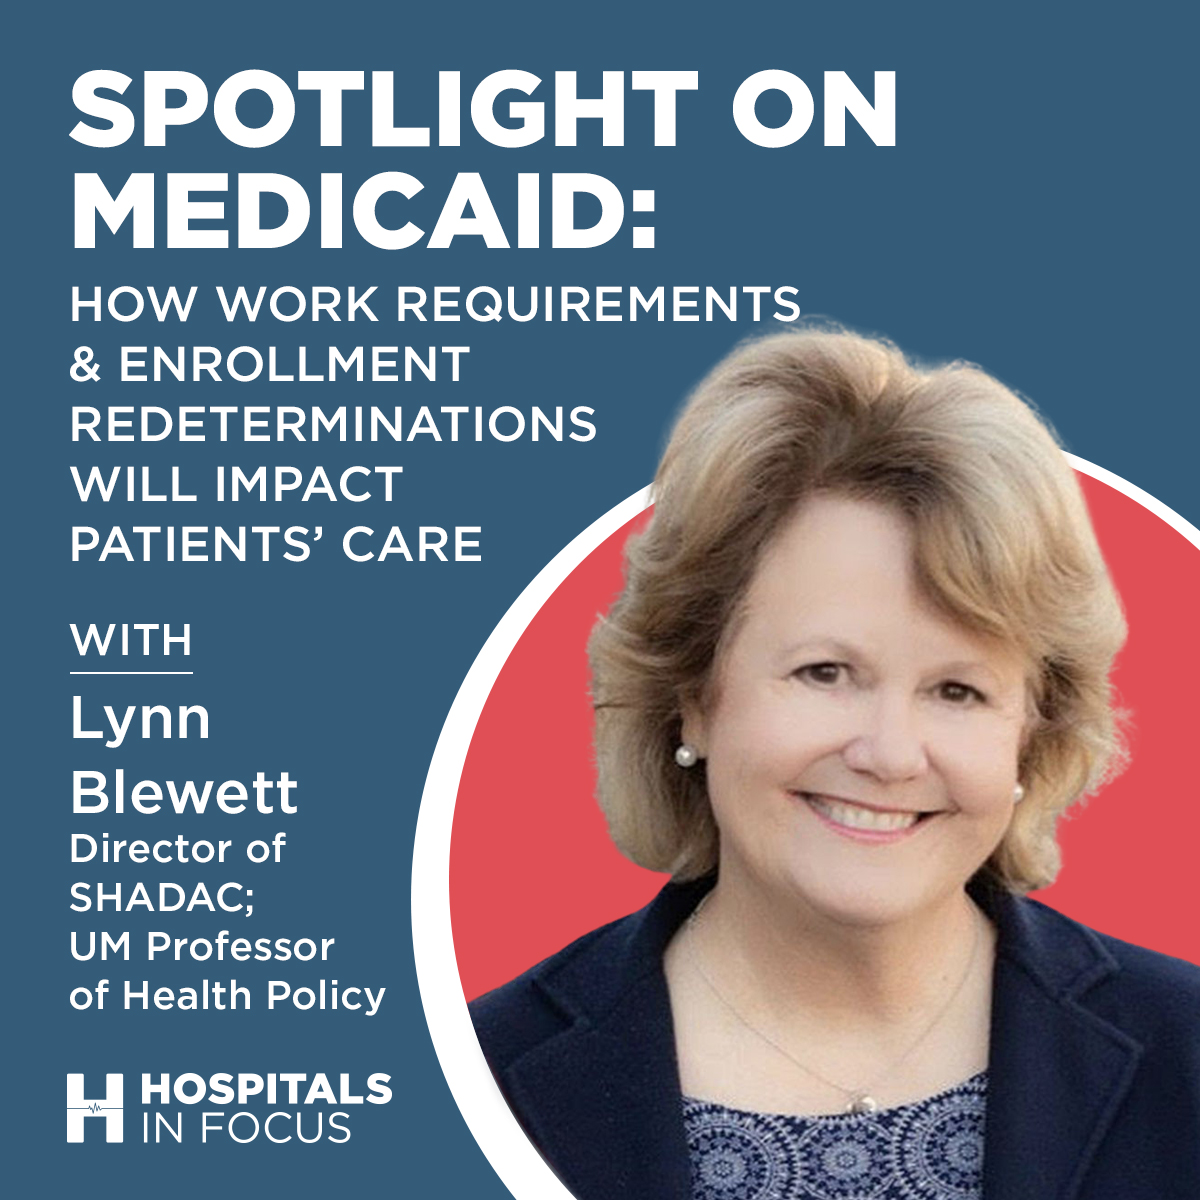 SHADAC Director Dr. Lynn Blewett was recently invited to join Federation of American Hospitals CEO and President Chip Kahn as a guest on his podcast Hospitals in Focus to share her thoughts on the impacts of the unwinding of the Medicaid continuous coverage requirement. The “unwinding” is a term used to describe the progressive ending of the provision included in the Families First Coronavirus Response Act (FFCRA), that allowed people to remain on Medicaid without needing to go through the re-enrollment process during the COVID-19 epidemic. With the end of this in sight, it’s been projected that millions are now facing either the need to quickly find other coverage or a total loss of coverage due to barriers for re-enrollment.
In the episode, Dr. Blewett discusses this very large change that’s occurring across the U.S. healthcare system. As of April 1, 2023, “States have started to redetermine all of the people on their programs to make sure they’re eligible,” she says, and “a new analysis shows that 500,000 people across eleven states have already dropped off Medicaid.” The podcast discusses specific cases and lessons that can be learned from states’ experiences - the good and the bad. Dr. Blewett dives into the different states’ methods for approaching the re-enrollment process, and how certain methods and diligence will affect any potential for procedural errors during this tumultuous period. There are also some states who are deciding to reinstate certain work requirements for people on Medicaid, which Blewett says “haven’t worked very well,” pointing out that: “There’s an estimate that 8 out of 10 Medicaid recipients who are not blind, disabled, or are able to work, already work. They either work part-time or full-time, and so you’re really targeting a very small number of people.”
In addition to the primary concern of people losing access to healthcare, there are many practical reasons that keeping populations on Medicaid actually helps state economies. To close out the discussion, Dr. Blewett highlights the financial impact that the unwinding could have on certain hospitals who were previously being compensated by the federal support that was coming from the increased number of Medicaid enrollees.
Publication
Data to Monitor the Unwinding of the Medicaid Continuous Coverage Requirement
On July 27, 2023, SHADAC Deputy Director Elizabeth Lukanen presented to the Protecting Immigrant Families Coalition, Medicaid Unwinding Task Force. This presentation included a brief overview of the potential coverage impacts of the unwinding of the Medicaid continuous coverage requirement, including variations by state and a review of actions states are taking to manage transitions and mitigate coverage loss. It featured information on the type of data advocates and policymakers can use to monitor the unwinding – focusing on state-released data.
Click the image below to download the slide deck from this presentation.
Blog & News
Lukanen, Elizabeth
Zylla, Emily
Best Practices for Publicly Reporting State Unwinding Data (Cross-Post)
June 30, 2023:
The following content is cross-posted from State Health & Value Strategies.
Authors: Elizabeth Lukanen, Emily Zylla, SHADAC
Original publication date: June 30, 2023.
The unwinding of the Medicaid continuous coverage requirement represents the largest nationwide coverage transition since the Affordable Care Act. With the restarting of eligibility redeterminations, millions of Medicaid enrollees are now at risk of losing their coverage and there is intense interest in monitoring the impact on coverage. To promote transparency, the Centers for Medicare & Medicaid Services (CMS) is requiring that states report the results of eligibility redeterminations and many states are making that data public. SHVS continues to monitor the states that are publicly reporting their unwinding data either in the form of data dashboards or static pdfs and the states posting copies of their required CMS Monthly Unwinding Data reports.
As advocates and researchers start to analyze unwinding data, it has become clear that it is difficult to compare different states for a variety of reasons. For example, states are initiating redeterminations and therefore disenrollments in different months and some states are staging redeterminations in a way that focuses on certain groups first, such as starting with people least likely to remain eligible. States are using a variety of different strategies to mitigate procedural terminations. States also use different terminology, definitions, population denominators, and timeframes on their reporting, which also makes it difficult to compare one state’s data to another.
In spite of data challenges, there are some best practices states can follow when reporting unwinding data.
- Release CMS Monthly Reports. While we typically don’t recommend releasing competing sources of data on the same topic, in this case, we recommend releasing CMS Monthly Reports alongside any state-specific data reporting to help satisfy calls from advocates and the media for comparable data across states. However, we recommend that states provide context about why the information may differ on state dashboards from CMS monthly reports. Kansas, for example, explains that data on their monthly unwinding reports is different from data on their dashboard because members move between reported categories.
- Timely release. Given the magnitude and scrutiny of unwinding coverage transitions, we recommend that states produce a data report that can be updated easily and frequently – at least monthly. We recommend prioritizing accuracy and timeliness over depth. And, if states are refreshing state unwinding data monthly, they should consider releasing it in tandem with the CMS Monthly Unwinding data reports.
- Prioritize key measures. Because timeliness of this data is so important, the report or dashboard needs to have enough data points to convey key information, but be limited enough to update quickly. In this case, we recommend focusing on measures that are already being reported (CMS Performance Indicators and indicators from the CMS Monthly Unwinding Data report). Key measures include:
- Renewals initiated
- Successful renewals
- Ex-parte/passive renewals
- Coverage terminations
- Procedural terminations
- Medicaid cases sent to the Marketplace
- Call center volume
- Number of terminations who reenroll in a specific period of time (e.g. 90 days)
- Publish disaggregated data. While required CMS data reporting includes very limited data disaggregation, there is a great interest in understanding who is being impacted by the unwinding. At a minimum, we recommend displaying data breakdowns by:
- Program type
- Age (children versus adults)
- Race
- Ethnicity
- Language
- Income
- Geography (ZIP code is best, but by county or any other level lower than statewide is helpful)
- Provide context and transparency. As noted above, there are many reasons that the data reported by different states might be difficult to compare. We strongly encourage states to use their reporting vehicle to contextualize and explain various measures. This includes:
- Document data revisions. We anticipate that states may be asked by CMS to make various adjustments retroactively to their data. States do not need to wait until data is final to post it publicly. They can address this by including revision dates when new data are posted. And wherever possible, maintain an archive of older data for comparability.
- Include both proportions and counts. Proportions are especially useful to help make comparisons across states on measures like procedural denials, but counts are critical for understanding the denominators being used and to get a sense for the magnitude of impacts within states.
- Include data labels, definitions, and context. Provide clear data labels, establish defined date ranges for data being displayed, add data refresh dates (as needed), describe population numerators and denominators if relevant (including exclusions such as pending cases). If the format allows, link to information that can help contextualize the information. This might include the state’s unwinding timeline, information about how redeterminations are being staged or any analysis or reaction to the results to date. For example, California posts their plan for prioritizing and distributing renewals on the same page as their unwinding data. Kentucky also has a webpage dedicated to unwinding that includes the state’s unwinding dashboard (the Kentucky Medicaid Renewals Data Snapshot), their required CMS unwinding reports and materials from monthly stakeholder sessions that provide a summary of the federal requirements, state goals and activities and their progress to-date.
Related SHVS Expert Perspectives:

