
Blog & News


Charting Two Decades of the Evolving Opioid Crisis
November 18, 2022:
In more than 20 years, the overdose crisis has shifted and grown from prescription opioids to a range of illicitly trafficked drugs |
Just over a decade after the U.S. Centers for Disease Control and Prevention (CDC) declared an “epidemic” of overdoses from prescription painkillers in 2011, the opioid crisis is worse than ever—yet it only vaguely resembles those earlier days. While people are still dying of overdoses tied to prescription opioids, the problem has largely shifted to illicitly trafficked opioids, such as fentanyl, and is now deeply intertwined with other non-opioid substances, such as methamphetamine and cocaine.
This blog examines the history and evolution of the opioid crisis through several charts based on data from SHADAC’s State Health Compare.
Changing attitudes in opioid prescribing
Today, it is broadly accepted that the over-prescribing of opioid painkillers—such as the blockbuster drug Oxycontin (a brand-name version of oxycodone produced by Purdue Pharma) and related semi-synthetic opioid hydrocodone—sparked what became an epidemic of overdoses and deaths. Over more than 10 years, deaths from overdoses involving those medications gradually crept upward until they finally capture widespread attention. When the toll of overdose deaths from prescription opioids was fully recognized and the U.S. healthcare system started to grapple with the problem, efforts to curb prescribing began.
In the first chart, data from the U.S. Drug Enforcement Agency show how legal sales of oxycodone and hydrocodone began the early days of the crisis at about 5 kilograms per 100,000 people in 2000. But within a decade, oxycodone sales roughly quadrupled and hydrocodone sales almost tripled (Figure 1). Following growing awareness of the problem, legal sales of both drugs—driven by prescriptions written by healthcare providers—have declined substantially. In 2021, hydrocodone sales had fallen to about 5 kilograms per 100,000 people, and oxycodone sales to less than 10 kilograms per 100,000 people.
Figure 1: Prescription opioid painkiller sales, 2000-2021
Source: SHADAC analysis of U.S. Drug Enforcement Agency's Automated Reports and Consolidated Ordering System (ARCOS) Retail Drug Summary Reports, obtained from statehealthcompare.shadac.org.
These data demonstrate that legal sales of prescription opioid painkillers are down dramatically from their heights when the CDC first rang alarm bells over the issue. However, some experts and advocates argue that the abrupt pivot in opioid prescribing practices was not done carefully enough, with many people who were already addicted to opioids suddenly cut off without sufficient screening for addiction or access to treatment. And data show that although deaths from prescription opioids have essentially plateaued since prescribing of opioid painkillers dropped, opioid overdose deaths have still continued to climb.
Persistently growing rates of opioid overdose deaths
Because overdose deaths were driven largely by prescription opioid painkillers in the early days of the epidemic, the hope and expectation was that death rates would drop as healthcare providers curtailed their prescribing of the risky medications. But this next set of charts shows that this hope was not fully realized.
In fact, the enhanced scrutiny on opioid prescribing and declining sales of prescription opioid painkillers appears to have marked a turning point in the epidemic. While deaths from prescription opioid painkillers have not declined dramatically, their growth trend leveled off and has remained relatively steady, around 4 deaths per 100,000 people, for almost a decade (Figure 2).
Figure 2: Prescription opioid painkiller death rates, 1999-2020
Source: SHADAC analysis of National Center for Health Statistics mortality files, obtained from statehealthcompare.shadac.org.
But to the shock and horror of many, overall overdose death rates—including prescription opioid painkillers as well as all other kinds of opioids—only continued to accelerate.
Figure 3: Death rates from all opioid types, 1999-2020
Source: SHADAC analysis of National Center for Health Statistics mortality files, obtained from statehealthcompare.shadac.org.
In less than a decade, the overdose death rate from all opioids roughly tripled, from 7.3 deaths per 100,000 people in 2011 to 21.4 deaths per 100,000 people in 2020 (Figure 3). But this time, the growth came from different types of opioids. First came heroin—an opioid that is without legal medical uses in the U.S. and is only available through the illicit drug trade. This was followed by fentanyl (and other closely related synthetic opioids), which does have legal medical uses but has been adopted by traffickers as a new drug of choice.
Figure 4: Death rates from fentanyl and other synthetic opioids, 1999-2020
Source: SHADAC analysis of National Center for Health Statistics mortality files, obtained from statehealthcompare.shadac.org.
In just a few years, the opioid crisis had transformed. What began as a problem rooted in widespread availability of prescription opioid painkillers shifted to illicitly trafficked opioids as legal opioid sales started to fall. By 2020, heroin overdose death rates had more than tripled since the CDC declared an opioid epidemic. And overdose death rates from fentanyl and similar synthetic opioids had grown more than 20 times (Figure 4).
In some ways, those developments may not be surprising. Economics tells us that when a good becomes scarce—such as prescription opioids after recognition of the crisis—people tend to cut back their consumption. But when people can’t simply stop their consumption, as in the case of addiction, they often turn to substitutes. With opioids, that unfortunately left many people to seek out substances such as heroin on the illicit market, where the purity and potency is unreliable, making them even riskier than prescription opioids. And once drug traffickers embraced the potent opioid fentanyl, it pervaded the illegal drug trade and became entangled with non-opioid substances, such as cocaine and methamphetamine.
A metastatic phase of the crisis
The opioid crisis is complex, and definitive evidence of how the epidemic evolved is hard to find. That is particularly the case in understanding the role of the illicit drug trade. However, it is widely accepted that some people shifted to heroin as prescription opioid painkillers became harder to obtain. Afterward, drug traffickers incorporated fentanyl into their supplies, sometimes to cheaply boost the potency of their heroin or simply to pass fentanyl off as heroin. Another approach was manufacturing counterfeit prescription medications, such as fake Oxycontin pills that actually contained fentanyl rather than the less-potent opioid oxycodone.
Over time, fentanyl became ubiquitous in the U.S. illicit drug market. Non-opioid illicitly trafficked substances, particularly cocaine and methamphetamine, are now often contaminated with fentanyl and related powerful opioids. And various kinds of illicitly trafficked counterfeit medications are found to contain fentanyl. In some cases, those counterfeit pills may mimic prescription opioid painkillers, but other counterfeit pills may contain fentanyl, even if the legitimate version does not. For instance, law enforcement agencies have reported interdicting fake stimulants (e.g., Ritalin and Adderall pills) that are mixtures of methamphetamine and fentanyl, even though the genuine medications do not contain opioids.
Ultimately, the pernicious impact of fentanyl and related synthetic opioids have transformed the opioid crisis. The prescription opioid painkillers that sparked this epidemic now only account for a fraction of drug overdose deaths in the U.S. (Figure 5), dwarfed by the toll of synthetic opioids such as fentanyl. And largely because of the pervasiveness of fentanyl in the market for illicit substances, deaths involving non-opioids also have grown to historic levels.
Figure 5: National Death rates for opioid and non-opioid substances, 2020
Source: SHADAC analysis of National Center for Health Statistics mortality files, obtained from statehealthcompare.shadac.org.
Lessons from opioids data
More than two decades into the opioid crisis, the main consistency is that the problem is continually evolving. When the role of prescription opioids in overdose deaths led the health care system to curtail dangerously generous prescribing of those medications, some people seemingly transitioned to illicitly trafficked opioids. When drug traffickers saw an opportunity to enhance their profits on heroin sales by using fentanyl and by manufacturing counterfeit pills, the epidemic became even deadlier. And as fentanyl became more pervasive, it also became intertwined with non-opioid substances, such as cocaine and methamphetamine—further extending the deadly reach of opioids.
To better understand and address the opioid crisis, it is important to use data to identify evolving patterns and trends and to anticipate new developments before they snowball into larger public health threats. Examining the history of the opioid crisis may prove useful to avoid recurrences of similar situations in the future, but it is also important to recognize the limitations of retrospective data for designing solutions to a dynamic situation. For instance, an overemphasis on prescribing of opioid painkillers now, when the vast majority of drug overdose deaths are caused by illicitly trafficked substances, could be considered akin to driving down a busy interstate highway while fixed on the rearview mirror.
Related Reading:
Blog: 2020 U.S. alcohol-involved deaths climbed by 26.6%, and drug overdose deaths by 30.6%
Resource Page: The Opioid Epidemic in the United States
Blog & News

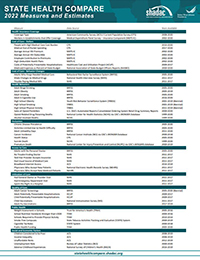
Six Measures on SHADAC’s State Health Compare Now Updated to Include Pandemic-era Data for Health Behaviors and Outcomes
March 18, 2022:As part of our commitment to releasing relevant and timely state-level data, estimates for six measures on SHADAC’s State Health Compare web tool have recently been updated with data from the first years of the COVID-19 pandemic, 2020 and 2021. Data for each of these measures is drawn from a variety of different data sources, which are detailed in the notes below.
Measures that have been updated include:
- Alcohol-Involved Deaths (2020)
Alcohol-Involved Deaths is a newer measure that was added to State Health Compare last year. Estimates for this measure provide state-level rates of deaths that were determined to be “alcohol-induced,” as defined by the Centers for Disease Control (CDC), including deaths from conditions such as alcohol poisoning and alcoholic liver disease that CDC considers to be entirely alcohol-attributable (a full listing of which is available on the data measure homepage). Data are available for years 1999 through 2020.
 Opioid-Related Deaths (2020)
Opioid-related Drug Poisoning Deaths is a measure that encompasses all age-adjusted rates of deaths caused by drug poisoning (i.e., overdose) per 100,000 people. Users can select national and state-level estimates for this measure for comparison by individual drug types, including legal (natural and semi-synthetic opioids; synthetic opioids [non-methadone]) and illegal (heroin) opioids, cocaine, and psychostimulants, as well as high-level “all opioids” and “all drugs” categories. Estimates are available from 1999 through 2020.
- Suicide Deaths (2020)
Suicide Deaths provides a measure of age-adjusted deaths from suicide per 100,000 people. Estimates can be viewed across categories that include age, sex, race/ethnicity, firearm or non-firearm method, and metropolitan status. Data are available for years 1999 through 2020.
- Premature Death (2020)
Premature Death measures the average number of years of potential life lost prior to age 75 per 100,000 persons. In addition to viewing this measure for the entire state population, data users can compare rates of premature death by race and ethnicity. Data are available for this measure for years 2000 through 2020.
- Adverse Childhood Experiences (2019-2020)
Adverse Childhood Experiences measures the percent of children (age 0–17) residing in households who had experienced no, one, or two or more adverse childhood experiences (ACEs) out of a possible nine ACEs ([1] hard to cover basics on family's income; [2] parent or guardian divorced or separated; [3] parent or guardian died; [4] parent or guardian served time in jail; [5] saw or heard parents or adults slap, hit, kick, punch one another in the home; [6] was a victim of violence or witnessed violence in neighborhood; [7] lived with anyone who was mentally ill, suicidal, or severely depressed; [8] lived with anyone who had a problem with alcohol or drugs; and [9] treated or judged unfairly due to race/ethnicity). Data users can make national and state-level comparisons of ACEs rates of by age, health insurance coverage type, parental education, poverty level, and race/ethnicity. Data are available for the two-year pooled periods 2016–2017, 2017–2018, 2018–2019, and 2019-2020.
- Unemployment Rate (2021)
Unemployment Rate measures the average annual percent of the civilian labor force (age 16 and older) that was unemployed. Individuals are defined as unemployed if they do not have a job, have actively looked for work in the prior four weeks, and are currently available for work. Users are able to compare data estimates for years 2000 through 2020 for national and state total population; however, only 2000-2020 data is available for viewing by race/ethnicity categories, as 2021 data is still forthcoming.
Notes
Data for Alcohol-involved Deaths, Opioid-related Deaths, and Suicide Deaths come from the CDC WONDER system. Data for Premature Death come from the CDC WISQARS system. Estimates for Adverse Childhood Experiences are produced using microdata from the National Survey of Children’s Health. Data for Unemployment Rate come from the U.S. Bureau of Labor Statistics’ Local Area Unemployment Statistics program.
Blog & News
2020 U.S. alcohol-involved deaths climbed by 26.6%, and drug overdose deaths by 30.6%
February 16, 2022:Size of alcohol, drug overdose death increases in first pandemic year were unparalleled
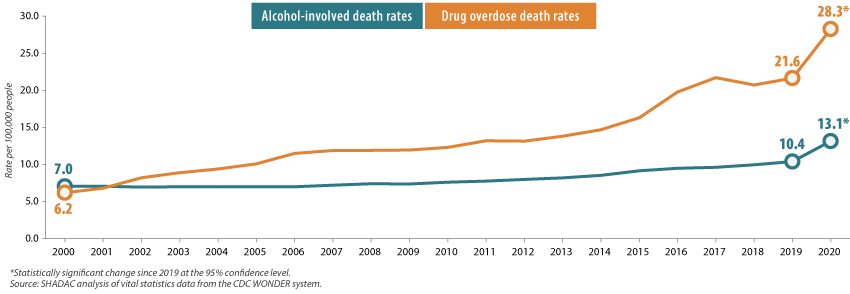
With the recent release of 2020 mortality data from the U.S. Centers for Disease Control and Prevention (CDC), we now know that fears that the pandemic could result in increased drug and alcohol deaths were well-founded. In just a single year, the U.S. alcohol-involved death rate increased 26.6%, and drug overdose deaths grew by 30.6% (Figure 1).
Figure 1. U.S. alcohol-involved and drug overdose death rates, 2000-2020
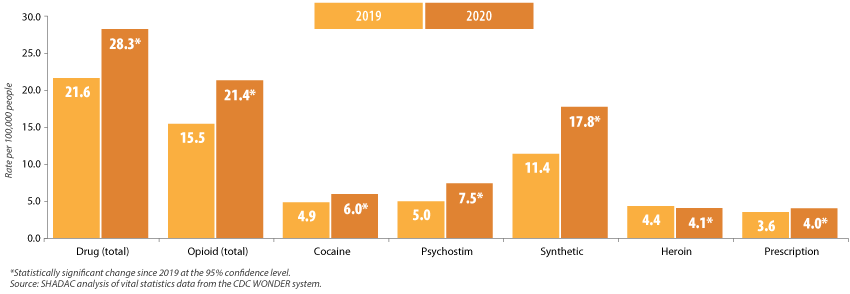
Overdose death rates increased significantly across most drug types (declining only for heroin), and they were led by a 55.6% increase in deaths from fentanyl and similar synthetic opioids, and a 48.2% increase in deaths from methamphetamine and other psychostimulant drugs (Figure 2).
Figure 2. Changes in U.S. drug overdose death rates by type, 2019-2020
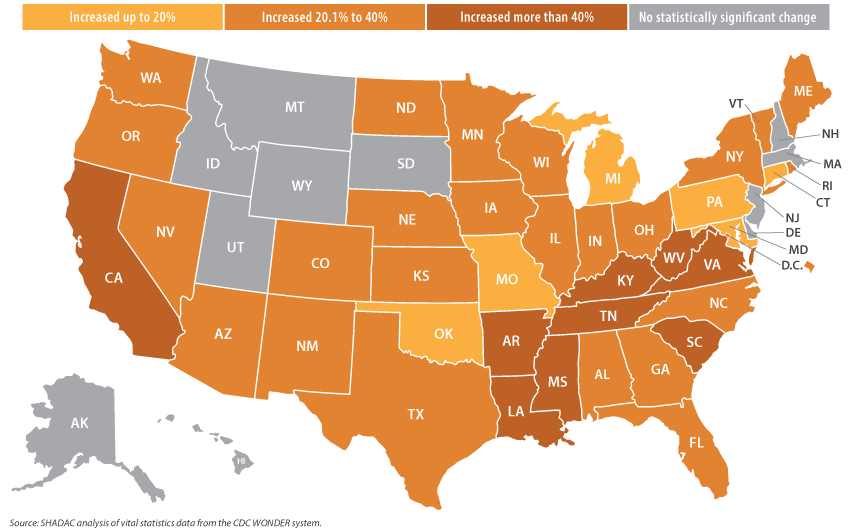
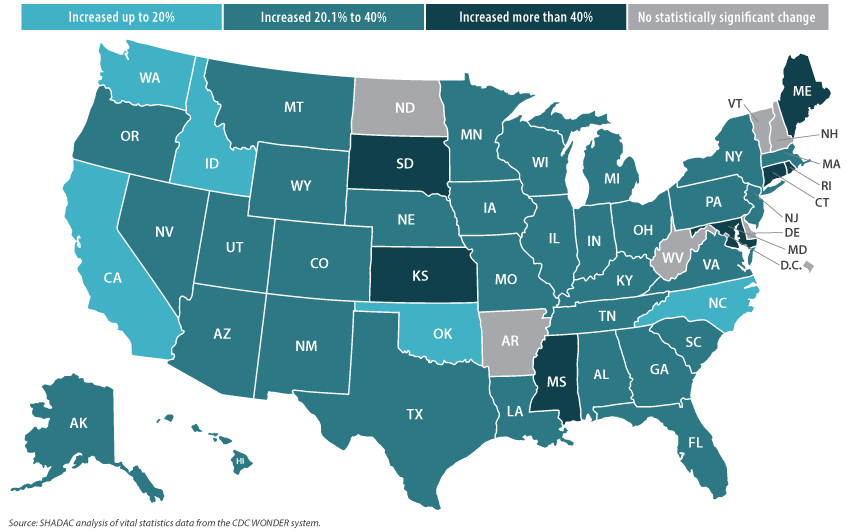
The story was similarly grim across the states. From 2019 to 2020, forty states experienced statistically significant increases in their drug overdose death rates. Those ranged from the smallest increase of 12.9 percent in Connecticut (from 34.7 deaths per 100,000 people in 2019 to 39.1 in 2020) to the largest increase of 54.8 percent in Mississippi (from 13.6 deaths per 100,000 people in 2019 to 21.2 in 2020) (Figure 3).
Figure 3. Statistically significant state-level increases in drug overdose death rates, 2019-2020
During the same period, 44 states recorded statistically significant increases in their rates of alcohol-involved deaths, ranging from the smallest increase of 15.2 percent in Oklahoma (15.1 deaths per 100,00 people in 2019 to 17.4 in 2020) to the largest increase of 67.2 percent in Mississippi (7.0 deaths per 100,00 people in 2019 to 11.8 in 2020) (Figure 4).
Figure 4. Statistically significant state-level increases in alcohol-involved death rates, 2019-2020
While these increases in alcohol-involved and drug overdose death rates follow patterns a decade or more in the making, the twin crises of high-risk substance use clearly reached a crescendo during the pandemic, as evidenced by the unparalleled heights of substance-related death rates reported in recent decades.1,2 And though data for 2021 are not yet fully available, provisional reports indicate that drug overdose deaths continued at historically elevated levels.3 Mortality data clearly show that the fallout of the pandemic has included the exacerbation of dangerous drug and alcohol use patterns in the U.S., and it is an issue that deserves redoubled focus as the COVID-19 emergency eventually begins to ebb.
The U.S. and state-level data analyzed in this blog post are all available on SHADAC’s State Health Compare data website: http://statehealthcompare.shadac.org/.
1 Planalp, C., Au-Yueng, C.M., & Winkelman, T.N.A. (April 2021). Escalating Alcohol-Involved Death Rates: Trends and Variation Across the Nation and in the States from 2006 to 2019. State Health Access Data Assistance Center (SHADAC). https://www.shadac.org/sites/default/files/publications/Alcohol-Involved-Deaths/AID-4.21-SHADAC-Brief.pdf
2 Planalp, C. & Hest, R. (August 2020). Overdose Crisis in Transition: Changing National Trends in a Widening Drug Death Epidemic. State Health Access Data Assistance Center (SHADAC). https://www.shadac.org/sites/default/files/publications/2020%20NATIONAL_SHADAC_Opioidbrief.pdf
3 Ahmad, F.B., Rossen, L.M., & Sutton, P. (2022, January 12). Provisional drug overdose death counts. National Center for Health Statistics (NCHS). https://www.cdc.gov/nchs/nvss/vsrr/drug-overdose-data.htm
Blog & News

Brief: Strategies to Increase Access to Medications for Opioid Use Disorder during the COVID-19 Pandemic and Beyond
October 25, 2021: Impacts of the COVID-19 pandemic have been demonstrably far-ranging, including changes to substance use-related behaviors.1 Evidence indicates that opioid use disorders (OUDs), overdoses, and overdose deaths grew as a result of COVID-19-related isolation and economic anxiety, and mortality data indicate that opioid overdose deaths, in particular, reached record levels in 2020.
SHADAC researchers Carrie Au-Yeung and Lynn Blewett, along with Hennepin Healthcare researcher Tyler Winkelman, authored a new Milbank Foundation policy brief that examines the federal and state policies changes put in place to improve access to medications for opioid use disorder (MOUD) during the COVID-19 pandemic, during which time MOUD became especially challenging to access because MOUD patients are typically required to have as many as six in-person clinic visits a week. The authors conclude with federal and state policy recommendations based on their analysis.
What is MOUD?
MOUD – sometimes referred to as medication-assisted treatment, or MAT – is the use of medications (methadone, buprenorphine, and naltrexone) to treat OUD, reduce opioid use, and lower the risk of overdose mortality. MOUD is frequently coupled with counseling and behavioral therapies and is the standard of care for OUD.
What policy solutions were put into place to make MOUD more accessible during COVID-19?
A number of policy solutions were put into place at the federal and state level in order to reduce the number of in-person clinic visits required for MOUD and to make MOUD more accessible in general. These solutions involved service delivery rules, prescribing rules, dispensing and refill rules, drug-testing requirements, counseling requirements, Medicaid prior authorization rules, and Medicaid coverage of telehealth.
For example, at the state level:
- Telehealth visits were allowed to replace in-person MOUD visits around prescriptions, assessments, and counseling.
- Some states loosened restrictions on dispensing and refill rules for MOUD and also allowed opioid treatment programs (OTPs) to deliver medications to quarantined or otherwise homebound patients.
- Some states gave more latitude to practitioners to use their own clinical judgment regarding toxicology screening and drug testing, and relaxed state-level counseling requirements or suspending them altogether.
- Individual states temporarily suspended certain Medicaid prior authorization requirements for MOUD, extended prior authorizations through the end of the COVID-19 emergency period, and/or expedited prior authorizations through documentation flexibility.
- All 50 states and the District of Columbia (D.C.) modified Medicaid policies regarding telehealth to allow for more virtual visits: some upped payment rates for telehealth visits to match in-person visits, others extended policies to cover a wider array of providers, and others expanded “telehealth” to cover audio-only (telephonic) visits.
At the federal level, policy solutions included:
- In-person examination requirements for buprenorphine initiation were removed while for methadone, initiation must be in person, but subsequent visits can occur via telemedicine.
- In April 2021, the US Department of Health and Human Services altered prescribing rules to exempt eligible physicians and practitioners from federal training requirements to obtain a waiver to prescribe buprenorphine small numbers of patients (i.e., fewer than 30).
- Dispensing and refill rules, such as the standard take-home schedule for methadone, was relaxed by the Substance Abuse and Mental Health Services Administration (SAMHSA).
- The American Society for Addiction Medicine suggested pausing, limiting, or using alternative protocols for drug-testing requirements in certain areas to combat community spread of COVID-19.
Recommendation
The need to expand access to MOUD will not end with the COVID-19 emergency, as the number of individuals who need treatment far exceeds the capacity of MOUD providers and facilities. Some of the policy changes that have made MOUD more accessible during the pandemic have already been made permanent at the state level (e.g., expanding the definition of “telehealth” in Medicaid). The continuation of other changes, however, will require ongoing support from state and national policymakers.
The authors recommend continued efforts around three regulatory strategies in particular:
- National and state policymakers should encourage the continuation of federal policies allowing buprenorphine initiation via telemedicine and the removal of state-level restrictions that go beyond federal requirements.
- National and state policymakers should also promote the continuation of federal policies allowing OTPs to dispense more doses of methadone and the removal of any additional state-level methadone dispensing restrictions that exist.
- Policymakers should work to prohibit Medicaid prior authorization requirements for MOUD and to make permanent any temporary suspensions of prior authorization requirements for these medications that were implemented during the COVID-19 emergency.
The authors note that, though there are other policy avenues for expanding access to MOUD, these three areas are particularly relevant for reducing logistical barriers to treatment. Moreover, evidence and testimony from providers and patients indicates that these mechanisms have been safe and effective during the COVID-19 pandemic and that continuing them beyond the pandemic period is warranted.
1 Planalp, C. (2021, July 15). Drug overdose deaths grew by almost 30 percent in 2020. SHADAC blog. https://www.shadac.org/news/drug-overdose-deaths-grew-almost-30-percent-2020
Planalp, C. (2021, June 14). Pandemic drinking may exacerbate upward-trending alcohol deaths. SHADAC blog. https://www.shadac.org/news/pandemic-drinking
Blog & News
Au-Yeung, Caroline
Planalp, Colin
(Webinar) U.S. Health On the Rocks: The Quiet Threat of Growing Alcohol Deaths
June 06, 2023:Date: Tuesday, September 21st
Time: 3:00 PM Central / 4:00 PM Eastern
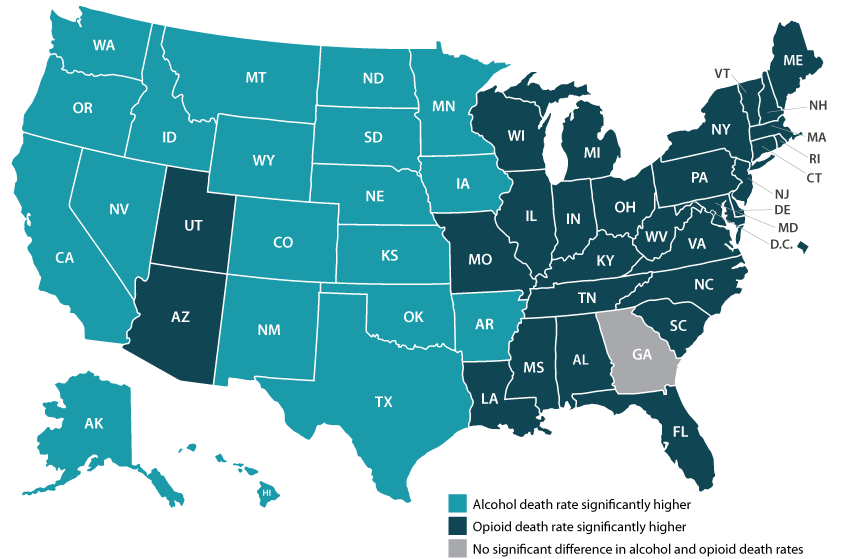
While much public attention has been given to the opioid epidemic, the United States has been quietly experiencing another growing public health crisis that surpasses opioid overdoses as a cause of substance abuse-related deaths in nearly half of all states: alcohol-involved deaths.
Using data from a recent analysis of alcohol-involved deaths from 2006 to 2019, SHADAC will host a webinar on Tuesday, September 21st detailing the trends in rising alcohol-involved deaths across the U.S., among the states, and for certain demographic groups.
Speakers
Carrie Au-Yeung, MPH, SHADAC – Ms. Au-Yeung will speak about variation in alcohol-related death rates across the states, as well as provide comparisons to opioid-related death rates in order to better understand the scale and context of substance use issues among the states.
Colin Planalp, MPA, SHADAC – Mr. Planalp will talk about national-level increases in alcohol death rates as well as rising rates for demographic groups by race and ethnicity, age, gender and urbanization.
Tyler Winkelman, MD, MSc, Hennepin Healthcare – Dr. Winkelman will discuss how the data serve can help us understand the impacts of the pandemic on alcohol-involved disease and deaths as well as the case for expanding our response to substance use issues beyond opioids.
A question and answer session will be open for all attendees following the webinar presentation. Attendees are encouraged to submit questions for any or all of the speakers prior to the webinar, and can do so here.
Slides from the webinar are available for download.
Resources
Escalating Alcohol-Involved Death Rates: Trends and Variation across the Nation and in the States from 2006 to 2019 (Infographics)
U.S. Alcohol-Related Deaths Grew Nearly 50% in Two Decades: SHADAC Briefs Examine the Numbers among Subgroups and States (Blog)
Pandemic drinking may exacerbate upward-trending alcohol deaths (Blog)
BRFSS Spotlight Series: Adult Binge Drinking Rates in the United States (Infographic)

